2026-10-19 · 17 min · kimi · vllm · kernels · cuda · nvidia · inference · speculative-decoding · mixture-of-experts · benchmarks
A 1:57 narrated explainer, drawn in code. Every number and picture in it is this article's own; the sources are below.
› transcript
Hi, I'm Linchpin! vLLM rewrote Kimi K3's decode step for one user on GB300 GPUs. Here's how it works. For one user, most of a decode step is spent between kernels, not reading weights. So vLLM fused the communication into the work around it. Each layer starts with projections tuned for the batch size, then the attention core. The output projection, its all-reduce and the residual are one kernel. Partial sums go straight into buffers the other GPUs read. The router and the latent projection are split across the GPUs instead of repeated on each. One persistent kernel runs the routed experts. The tail folds the second reduction and the next norm together. While the GPUs talk, a side stream pulls the next weights into cache. Stock vLLM: one hundred and thirty microseconds and twenty-three kernels per layer. The specialized path: sixty-nine microseconds and thirteen kernels, the fused ones outlined. On sixteen GPUs, a step fell from seven point three eight to three point nine milliseconds. Streaming the weights alone takes about one. Speculative decoding sits on top. A small drafter proposes seven tokens. The target checks eight rows in one step, about the cost of a batch of eight. The headline forces six accepted tokens a step. That is where eight hundred and forty-two comes from. The fair comparison: same sixteen GPUs, no speculation. The other multipliers divide by different GPU counts. For one user, the overhead between kernels is the target. Fuse the communication into the work around it. Collectives inside the kernels, a verify that costs a batch of eight, and a denominator under every speedup. Every source is in the full article. I'm Linchpin. Bye!
Why read this
Solidtop 85%Reads the merged vLLM PR and reconciles 842, 423, 1.68x and 1.8x: one user, 16 GPUs, a forced acceptance length, and 27% of the bandwidth ceiling.
- Original analysis
- Concrete numbers to act on
- Explained from first principles
GPUs, kernels & systemsNeeds datacenter GPUsApache-2.0Practitioner tool
How this was scored
- Is it new?
- 1 of 3: An incremental tweak
- Can I trust it?
- 2 of 3: Measures key facts from files, code or configs
- Can I run it?
- 1 of 3: API-only, gated or restrictive licence
- Will I understand it?
- 2 of 3: Mechanism from first principles with figures
- Can I act on it?
- 2 of 3: A concrete recipe, numbers or comparison
- Will it last?
- 1 of 3: Relevant for months
- Does it affect many?
- 1 of 3: A specialist community
- Only here?
- 2 of 3: A teardown or measurement few others did
Score 56 of 100, ranked 406 of 577 rated articles. Each question is answered 0–3 by hand, and a 3 is rare. How articles are scored
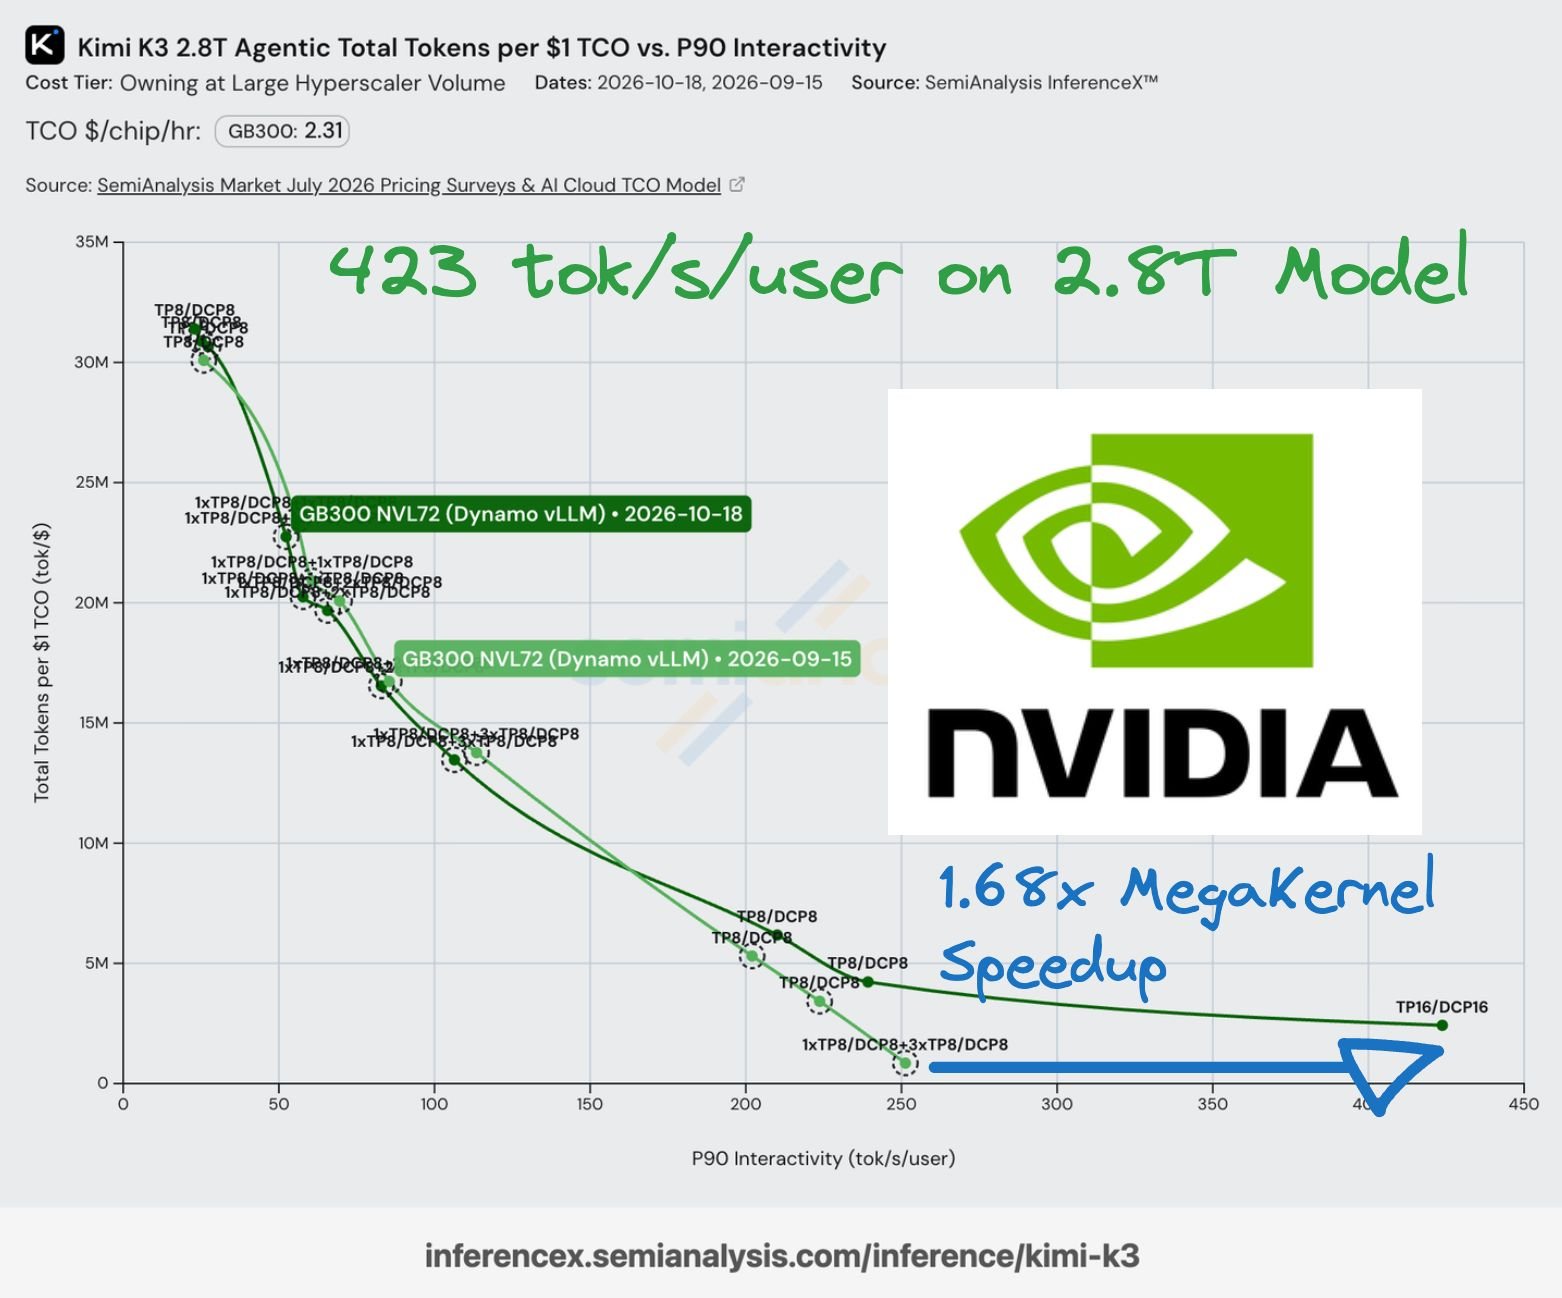
Two posts went out within forty minutes of each other on 18 October. vLLM's: "Kimi K3 decode on NVIDIA GB300 NVL72: 842 tokens/s at batch 1 with DSpark." SemiAnalysis's: "423 tok/s/user on the 2.8T Parameter Kimi K3 model via a new upstream vLLM optimization. 1.68x Faster on the Same Hardware!", credited to "a 12,000 LoC Megakernel" and "the future of advanced AI-assisted kernel generation."
Two different numbers, two different speedups, and both describe the same pull request. The
engineering write-up is Hyper Optimizing Kimi K3 in vLLM
by Benjamin Chislett (NVIDIA). The code is vllm-project/vllm#61867,
merged on 16 October as commit 642c18d.
Short answer: the work is real and the mechanism is sound, but neither headline is the clean number. 842 is one user on 16 of the rack's 72 GPUs, at an acceptance length set by a benchmark switch. 423 is a different workload against a different baseline. The cleanest like-for-like figure is in the post's own table: 1.88x at batch 1 on the same 16 GPUs, without speculation.
What one decode step of Kimi K3 does
Kimi K3 is a 2.8T-parameter mixture-of-experts. From the C port's accounting: 93 layers, 69 of them Kimi Delta Attention (KDA, a linear-attention recurrence whose state does not grow with context) and 24 MLA. 92 of them are MoE layers, routing each token to 16 of 896 experts. The dense trunk is 108.81 GB of bf16 that every token reads. The experts ship in MXFP4, at 17,547,264 bytes each. One token touches 1,472 experts, 25.83 GB of them.
A decode step for one user walks all 93 layers for one row. Per layer that is a residual and attention-residual mix, the input projections, the KDA or MLA core, the output projection, an all-reduce across the tensor-parallel group, the router, the shared expert, 16 routed experts and a second all-reduce. Every matmul is one row against a weight matrix: about one FLOP per byte, so the tensor cores mostly wait on HBM (decode is memory-bound covers the general case).
Why batch 1 on a rack is not only a bandwidth problem
If bytes were the whole story, a step would cost bytes over bandwidth. A GB300 has 8,000 GB/s of HBM (NVIDIA's figure, Reported), and the PR shards K3 across 8 or 16 GPUs with tensor parallelism. For 16 GPUs:
That is a ceiling of about 951 tok/s for one user with no speculation (Reasoned). The precision
matches what the PR reads. Its projection GEMMs reject any weight that is not bf16 or fp16, and its
expert kernel is documented as "FP4 x MXFP8 FC1/FC2 MMAs": packed FP4 weights, activations
quantised to MXFP8 on the fly (Measured, from gemm/projection.py and moe/experts.py).
Stock vLLM's batch-1 step on those 16 GPUs is 7.38 ms (Reported, in the PR's commit message). That is 7x the floor. The other 6 ms is everything that is not streaming weights:
- Launches and gaps. The stock path runs 23 kernels per layer, roughly 2,100 a step (Reasoned, 23 x 93). Inside a CUDA graph a launch is cheap, but each kernel still ramps up, drains, and leaves HBM idle at its edges.
- Communication. Two all-reduces per layer over NVLink, about 186 a step (Reasoned). At batch 1 each moves a few kilobytes, so each is pure latency.
- Serial small work. Router scores, top-16 selection, norms, the KDA recurrence: short, dependent and bandwidth-idle.
That is why "use the whole NVL72" does not help one user. 72 GPUs' HBM would put the floor near 0.23
ms (Reasoned), but every extra rank in the tensor-parallel group shrinks each GPU's share of the
bytes, while the all-reduces and the serial chain stay the same or grow. The PR only accepts
tensor_parallel_size of 8 or 16 and rejects expert parallelism at startup (Measured, from
runtime/__init__.py). So "on GB300 NVL72" means a 16-GPU tensor-parallel group inside one NVL72's
NVLink domain, which the post says outright: "over 840 tokens/s at batch 1 on 16 NVIDIA GB300 GPUs."
The post's table gives one more clue that the fixed overhead dominates. Subtract the bandwidth floor from each batch-1 step. Stock leaves about 6.1 ms on TP8 and 6.3 ms on TP16. The fused path leaves 3.07 ms and 2.85 ms (Reasoned). Doubling the GPUs halves the floor and barely moves the rest. The fusion's whole win is in the rest: 3.0 to 3.4 ms a step, or 32 to 37 µs a layer.
What the fused path changes
The PR adds an opt-in executor behind --additional-config '{"decode_backend": "latency_specialized"}'.
Uniform decode steps and DSpark verify steps of up to 64 tokens run as "one FULL CUDA graph of
persistent CuTe DSL kernels" (the commit message). Prefill, mixed batches and everything else run the
stock forward. All of it lives under vllm/models/kimi_k3/nvidia/.
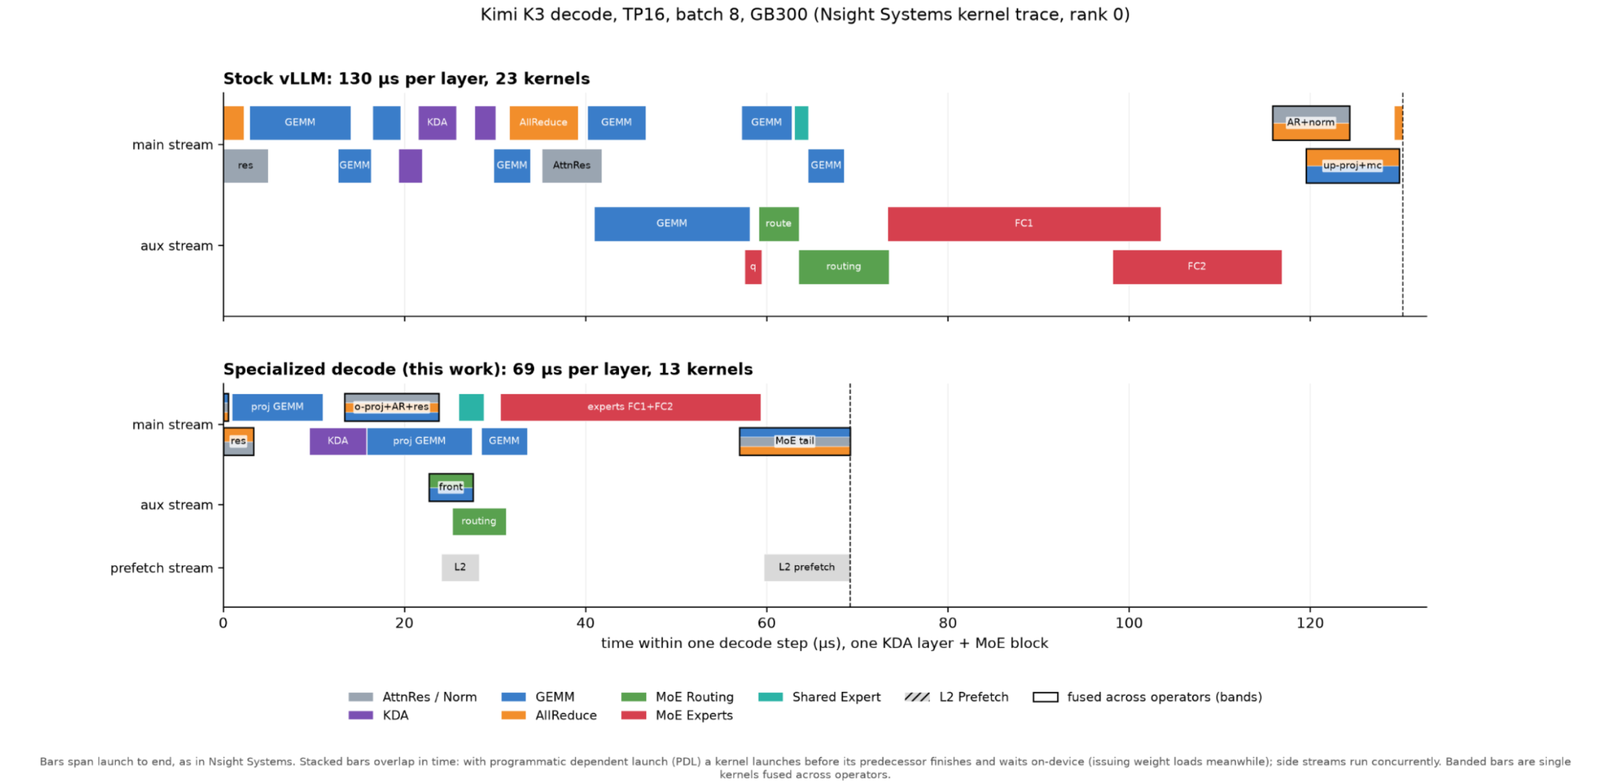
Four changes, in the post's order, each visible in the trace:
- Shapes tuned per batch. Small-matrix kernels at batch 1-2, split-K at larger batches, so a one-row GEMM still occupies every SM.
- Communication fused into compute. The attention output projection, its all-reduce and the
following residual are one kernel (
o-proj+AR+res). Producers write partial sums into NVLink-addressable buffers; consumers combine them and continue. The post calls the exchange "fence-less"; the code calls the buffers mailboxes. At larger batches it switches to a two-stage reduce-then-broadcast. - The MoE front split across ranks. Stock computes the full router scores and latent input
projection on every GPU. The fused path gives each rank a share, exchanges the results over
NVLink, and runs the shared expert on a side stream. The routed experts are one persistent kernel
doing FC1 and FC2, and the
MoE tailfolds the down-projection reduction and the next norm together. - L2 prefetch on a third stream. While the GPU waits on communication, a small kernel walks a table of upcoming weight ranges and pulls them into L2, so the next GEMM starts on a warm cache.
The widget redraws both traces from the figure. The fused layer is shorter for three visible reasons. There are fewer boundaries. The gap between the routed experts and the final all-reduce is gone, because the all-reduce is now inside the tail. And the MoE front starts at 23 µs instead of 41 µs. The per-layer ratio, 130 over 69, is 1.88x. Multiplied by 93 layers it predicts 12.09 and 6.42 ms a step; the table's measured batch-8 steps are 12.37 and 6.91 ms (Reasoned; the trace is one KDA layer, and the difference is MLA layers, the embedding, the LM head and sampling).
It is not one kernel. The PR adds 30 functions decorated @cute.kernel and 219 @cute.jit
helpers across 48 Python files (Measured). The trace shows 13 kernels per layer, chained by
programmatic dependent launch inside one CUDA graph. Compare
Inferact's TPU megakernel, which really is one Pallas call for all
93 layers and stages the next layer's weights across the boundary. The GPU path gets most of that
effect with L2 prefetch and PDL instead of one program. So "megakernel" is SemiAnalysis's word, not
vLLM's.
What DSpark adds
DSpark is a block drafter: a small model proposes several tokens in one pass, and the target verifies them in one step. The PR supports DSpark verify with 3-7 draft tokens and rejects other speculative methods (Measured). The headline run uses 7, so each verify step reads eight rows: the anchor plus seven drafts.
Eight rows route independently. Each layer touches about 120 distinct experts instead of 16, so a verify step reads about 303 GB, not 135 (Reasoned, with the expected union ). The trunk is still read once. That is the cost LFM2.5-DSpark pointed out: verifying a block takes back much of a sparse model's advantage.
Tokens per second then becomes acceptance length over step time. The post's setup line is explicit: "TP16, DSpark with seven draft tokens, synthetic acceptance length of 6, DL=7, ISL=1, OSL=1k, batch size 1." So:
- Specialized: 6 / 842 = 7.13 ms per verify step (Reasoned).
- Stock: 6 / 488 = 12.30 ms per verify step (Reasoned).
Those are almost exactly the table's batch-8 steps without speculation, 6.91 and 12.37 ms. A verify of eight rows costs what a batch of eight costs, plus about 0.2 ms of drafting on the fused path. That consistency is a good sign the numbers are what they say they are. It also means 842 is the batch-8 step rate multiplied by a chosen 6.
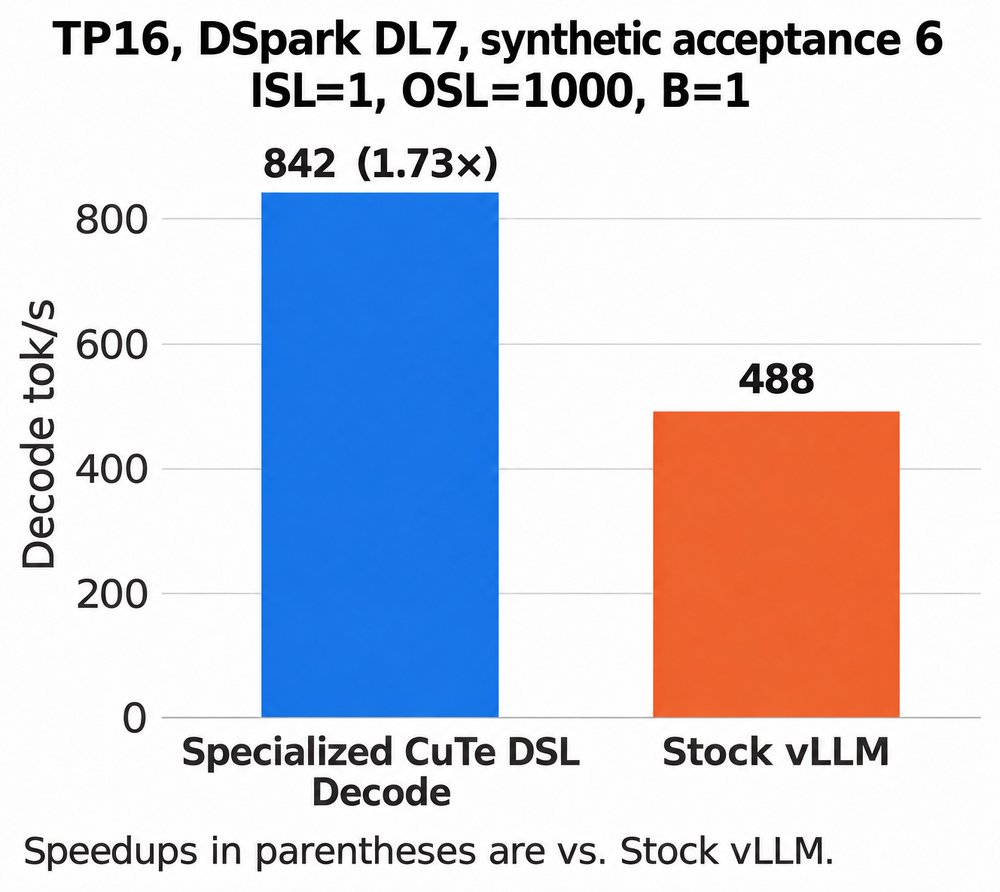
"Synthetic" is vLLM's forcing mode. The recipe page, quoted in the TPU article, warns that it "skips real verification: never use it to serve users or to evaluate accuracy." vLLM's own DSpark training post measured this drafter at a macro-average acceptance of 4.11 across nine domains. At 4.11 the same step times give about 577 against 334 tok/s (Reasoned, holding the step fixed, which the TPU article found it nearly is).
The widget puts every reported step next to its bandwidth floor. Two things stand out. First, the fused path's share of the floor rises with batch, from 27% at batch 1 to 48% at batch 64 on TP16 (Reasoned), because more rows amortise the same fixed overhead. Second, stock's share at batch 1 is 14%. The fusion doubled the fraction of the memory bus a single user gets, from about an eighth to about a quarter.
Reconciling the headlines
842 against 423
They are different benchmarks.
| vLLM, 842 | SemiAnalysis, 423 | |
|---|---|---|
| workload | 1 input token, 1,000 output tokens | AgentX: replayed coding-agent sessions |
| context | about 1,000 positions | long, multi-turn, with KV-cache reuse |
| metric | decode tok/s, one stream | P90 interactivity, tok/s per user |
| speculation | DSpark, acceptance forced to 6 | not stated |
| GPUs | 16, TP16 | 16, TP16/DCP16 |
AgentX is the harder workload, so 423 is the more realistic number. The post does not say whether DSpark was on for it. But 423 is above the 256.4 tok/s the fused path reaches at batch 1 with no speculation and a one-token context, and a longer context can only slow a step. So speculation must have been running with real acceptance, at no less than about 2.9 tokens a step if a step costs at least the 7.13 ms above (Reasoned, from 403.2 x 7.13 ms).
1.68x against 1.8x and 1.5-2x
Each multiplier divides by a different baseline.
- 1.8x (vLLM, AgentX): 403.2 against 223.7 tok/s per user, both at concurrency 1. The post says plainly that this "compares the optimized run on 16 GB300 GPUs with the earlier vLLM result on 8 GB300 GPUs." Twice the GPUs, as a reply on X pointed out (Reported; 403.2 / 223.7 = 1.80).
- 1.68x (SemiAnalysis): 423 against 251.3, which is 1.683 (Reasoned). vLLM's AgentX chart labels
251.3 as the old curve's best point and notes it "uses 32 GPUs". SemiAnalysis's chart writes that
point as
1xTP8/DCP8+3xTP8/DCP8, which in Dynamo's notation probably reads as one prefill and three decode workers of 8 GPUs each, so a decoding user was still on 8. Either way, "the same hardware" means the same GPU model, not the same GPU count. vLLM's chart has 403.2 where SemiAnalysis's has 423; the two are separate runs two days apart, and I cannot see SemiAnalysis's underlying data. - 1.5-2x (vLLM, headline): the no-speculation table. On TP16 it holds everywhere: 1.62x to 1.92x. On TP8 it does not at larger batches: 1.31x to 1.43x from batch 8 up (Reported).
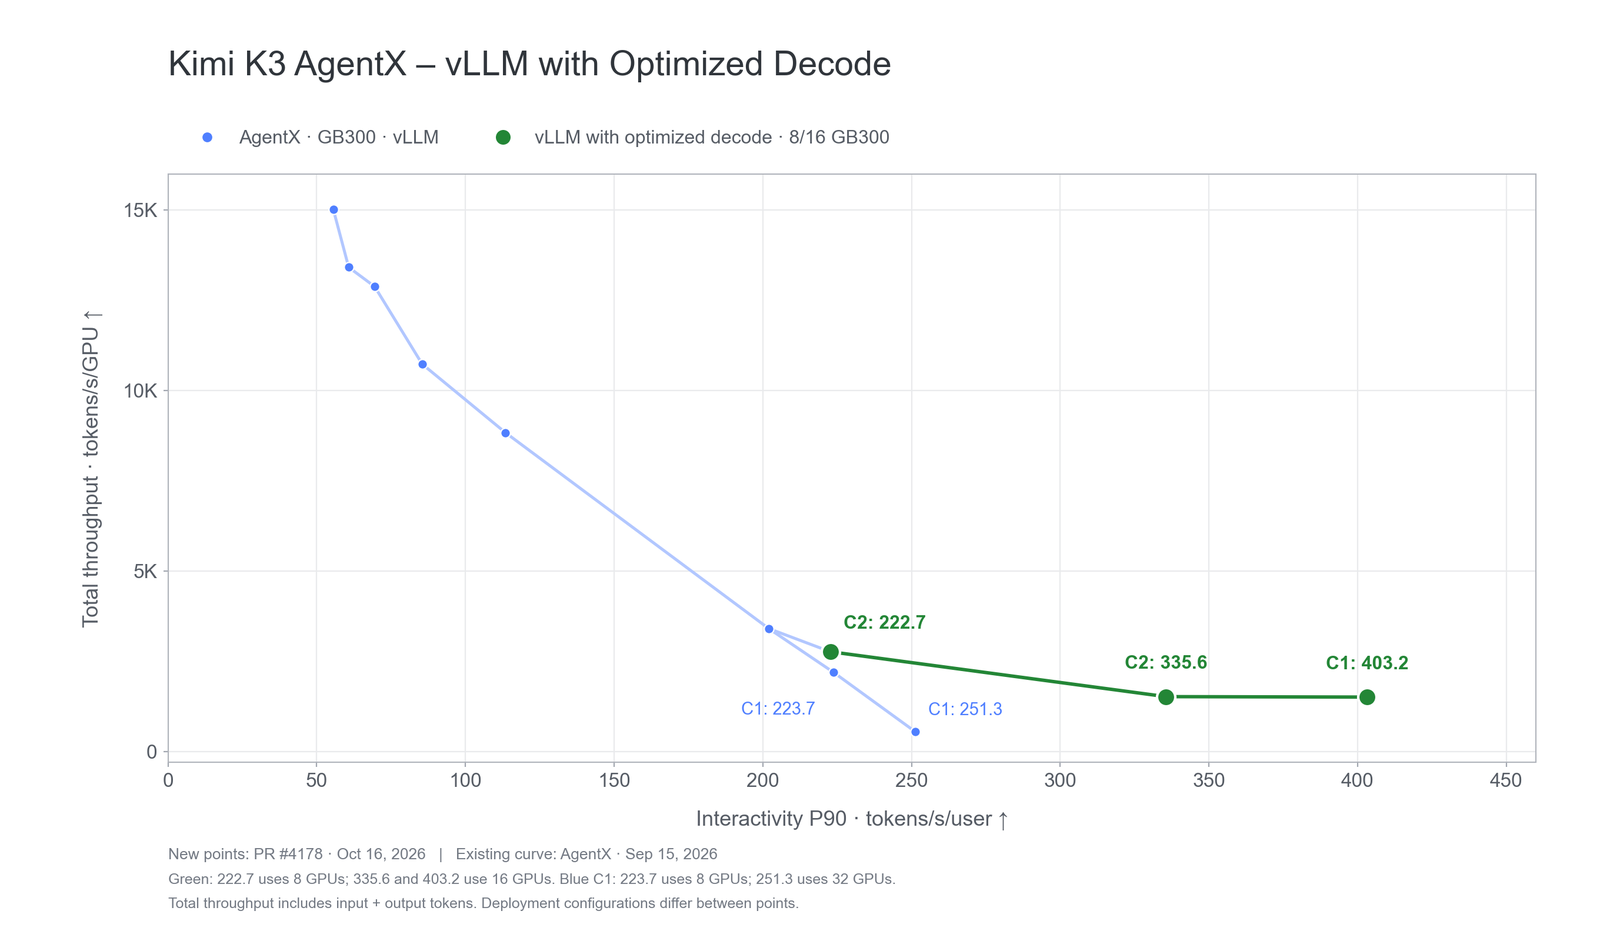
The fair comparison is already in the post. Same 16 GPUs, same one-token context, no speculation: 256.4 against 136 tok/s, 1.88x. The commit message gives the step times behind it, 3.90 against 7.38 ms (Reported). On TP8 it is 1.58x. Those are the numbers I would plan around.
How does it compare with the TPU kernel? Inferact reported 249 tok/s at batch 1 and 709 at a forced acceptance length of 6, on 16 TPU v7 chips. The fused GB300 path is 256.4 and 842 on 16 GPUs (Reported). Against their own bandwidth ceilings the TPU kernel sits at 32% and this one at 27% (Reasoned; the TPU figure is from that article). Two different designs, the same rough place on the roofline, and both well short of it.
Correctness, and how it was checked
Fusing collectives and reordering loads is where silent numerical bugs live. The post is more candid than most:
Our audit discovered that the compiler moved activation reads ahead of a synchronization wait. The fix restricted that load type to static weights.
And: "long-context and long-generation evaluations such as MRCR and AIME25 surfaced sensitive numerical issues in attention and communication kernels that were not reproducible in standalone kernel tests."
The PR description reports AIME25, GPQA-Diamond, GSM8K and MRCR v2 for stock TP8 against four fused configurations, with and without DSpark. A few rows, as score with standard error (Reported; I read the table through a page renderer that rebuilt split cells, so check the PR before quoting a cell):
| task | stock TP8 | fused, range over 4 configs |
|---|---|---|
| GPQA-Diamond, no spec | 0.924 ± 0.011 | 0.914 to 0.929 |
| AIME25, no spec | 0.867 ± 0.033 | 0.867 to 0.917 |
| GSM8K, no spec | 0.867 ± 0.009 | 0.856 to 0.873 |
| MRCR v2, no spec | 0.282 ± 0.039 | 0.226 to 0.334 (TP8 only) |
Most cells sit within one standard error of stock. The widest gap is MRCR v2 on TP8 at concurrency 8, 0.226 against 0.282, about one combined standard error on 100 samples. The PR also describes greedy log-probability comparisons against a one-ulp noise floor and decode-against-prefill rescoring.
What the merge does not contain: tests. The 50 changed files in 642c18d include none under
tests/, and nothing under tests/ references the specialized path (Measured). The PR says why: "I
am happy with the validation, but still unclear how much we want to put into CI." The post's own
second half argues for automated validation. It has not landed with the first contribution.
The LoC and the "AI-assisted" claim
LoC. The merge commit adds 12,805 lines and deletes 3, across 50 files. 12,731 of those lines are
in specialized_decode/; without blank lines, comments and docstrings, 10,469 are code (Measured,
counted with Python's tokenizer). The largest files are moe/experts.py at 1,579 lines and
moe/tail.py at 1,031. "12,000 LoC" is fair for the whole PR. "One megakernel" is not.
AI assistance. The post says "we used agent-assisted development to build a unified CuTe DSL
decode path." The PR description says "AI assistance was used during the creation of this PR"
(Reported). In the history, all three non-merge commits carry a Co-Authored-By: Claude Opus 5.5
trailer. One merge commit is authored by vllm-agent <[email protected]>, and the squash commit lists
both as co-authors (Measured). Neither the post nor the PR says which parts an agent wrote, how many
iterations it took, or what the human did. The post's argument is about review, not generation:
agents should deliver tests, evaluations and documented operating conditions so reviewers can judge
the evidence rather than read every line. That is a reasonable ask, and this PR shows both why it
matters and that it is not finished.
What I'd take from it
- At batch 1, the overhead is the target, not the bytes. Stock K3 decode on 16 GB300s spent about 6 ms of a 7.4 ms step on things other than streaming weights. Fusing collectives into their producers and consumers, and prefetching into L2 during communication, removed about half of it.
- Quote the step, then the multiplier. 7.13 ms per eight-row verify is a kernel measurement. 842 multiplies it by 6, chosen by a flag.
- Check the denominator of every speedup. 1.8x divides by half the GPUs; 1.68x divides by a 32-GPU point; 1.88x is the same 16 GPUs.
- The scope is narrow on purpose. SM100/SM103 only, TP8 or TP16, batch up to 64, DSpark with 3-7 drafts or nothing, no LoRA, no expert parallelism (Measured, from the support checks). The post says the same pattern is under way for DeepSeek-V4.1-Flash in #61868.
What would change my mind
3 claims above, and what would falsify each
842 tok/s was measured at an acceptance length forced to 6, not produced by real drafting.
The post's setup line says "synthetic acceptance length of 6". A run with DSpark's natural acceptance on real prompts near 6 and a rate near 842 would make it a workload number.
The fused path reaches about 27% of its HBM bandwidth ceiling at batch 1 on TP16.
The ceiling assumes 134.64 GB per token over 16 x 8,000 GB/s with perfect sharding. If the deployment kept the trunk in FP8 rather than bf16, the floor would fall and the share would rise. The PR's projection GEMM accepts only bf16 or fp16 weights, so I do not expect that.
DSpark was active for the 403.2 and 423 AgentX points.
Neither post says so. I inferred it because both exceed the 256.4 tok/s no-speculation batch-1 rate at a one-token context. An AgentX run with speculation off reaching 400 tok/s per user would break that inference.
Throughput, latency and the kernel-trace figure are Reported from vLLM's
post (16 October 2026) and
PR #61867; code facts are Measured from the merge
commit 642c18d and the PR head 063c0c6, read on 19 October. The 423 and 1.68x are SemiAnalysis's,
from its post on X. Figures are captured
from those pages and served from this site. K3's byte counts come from
kimi-k3-in-c; the TPU comparison from
the TPU megakernel article. For vLLM's day-0 kernel work on another
92-layer, 1M-context model, see Step 5 Preview; for a speculative-decoding
benchmark that hedges its own headline, see speculative decoding on AMD GPUs.