2026-10-23 · 19 min · inference · deepseek · kv-cache · speculative-decoding · mixture-of-experts · benchmarks · vllm
A 1:56 narrated explainer, drawn in code. Every number and picture in it is this article's own; the sources are below.
› transcript
Hi, I'm Orrery! Here is how DeepInfer, DeepSeek's newly opened engine, serves one request. The release is the engine. The storage, the transfer and the balancers are described, but kept back. A request enters through the recipe, which makes tokens, and the entrypoint, which routes it. Prefill and decode are separate services, each behind its own balancer, over a shared cache store. The recipe encodes the request. The entrypoint matches its prefix against the store. A prefill engine swaps the cached part in, and computes only the new tokens. The cache and window state move to a decode engine on sixty four GPUs or more. Decode streams tokens out, and writes its cache back. Many layers look back over a short sliding window. After a cache hit, DeepInfer recomputes just the last hundred and twenty eight tokens. It is approximate. Decode uses DSpark. The trick is choosing how much to verify. Each request drafts five tokens. A confidence head rates each draft's chance to survive. Every draft in the batch is sorted by that chance. The scheduler adds them until tokens per millisecond stop rising. Here is the formula. The headline chart measures steps per second, times tau. Tau assumes three drafts, each accepted three quarters of the time. DeepSeek's own numbers suggest that is high by about a sixth. On one denominator, at matched speed, DeepInfer's chart is about one and a half times the best vLLM run. The engine is open. The service around it, and a like-for-like benchmark, are not yet. An open engine, a greedy verifier, and a chart to read closely. Every source is in the full article. I'm Orrery. Bye!
Why read this
Notabletop 60%DeepInfer read from the code: what shipped vs what's described, the DSpark verify greedy rebuilt, and the viral chart's numbers traced back to their sources.
- Checked against the source
- A lasting reference
- Concrete numbers to act on
Inference & servingNeeds datacenter GPUsApache-2.0Practitioner tool
How this was scored
- Is it new?
- 1 of 3: An incremental tweak
- Can I trust it?
- 3 of 3: Reproduces the headline result, or shows from primary files it is wrong
- Can I run it?
- 1 of 3: API-only, gated or restrictive licence
- Will I understand it?
- 2 of 3: Mechanism from first principles with figures
- Can I act on it?
- 2 of 3: A concrete recipe, numbers or comparison
- Will it last?
- 2 of 3: A reference for a year or more
- Does it affect many?
- 1 of 3: A specialist community
- Only here?
- 2 of 3: A teardown or measurement few others did
Score 65 of 100, ranked 213 of 577 rated articles. Each question is answered 0–3 by hand, and a 3 is rare. How articles are scored
On 20 October DeepSeek posted a four-part thread: "Introducing DeepInfer, our in-house inference framework, now fully open source! Powering DeepSeek-V4.1-Flash at scale with high throughput and low latency." The second post lists "High-performance kernels & optimized inference engine", "Distributed inference & speculative decoding" and "SWA Bounded Replay & structured outputs". The third adds deepseek-recipe, "our production token encoding & decoding component".
An hour later a community chart went round. It took SemiAnalysis's InferenceMAX plot for DeepSeek-V4.1-Flash, where the best configuration tops out near 6,000 output tokens a second per chip, and drew an arrow off the top of the page to "25600 TPS/GPU" for DeepInfer. One reply said the real gain was 1.3x to 1.5x. Another asked to see the maths.
So I read the code, ran what runs on a CPU, and traced every number in that chart to its source. Labels throughout: measured means I computed it from a file or a run, reported is DeepSeek's or SemiAnalysis's figure taken as given, reasoned is my arithmetic on the other two.
- license
- Apache-2.0
- branch
- main
- tests
- 21 files
- source
- 2.8 MB
- commit date
- 2026-10-21
by size of tracked source at this commit, file counts in brackets; docs, data and vendored trees excluded
local clone, 2026-10-23 at 9bd9cf2 — branch, commit, commitDate, fileCount, hasTests, languages, license, licenseFile, shallow, testFileCount
shallow clone: counts describe the pinned tree, not the history
What shipped, and what didn't
The README is unusually direct about this. "This open-source release provides offline inference with the core features needed for serving at scale." Then, under "Required for a complete inference service (not included in this release)": a KV cache system, "VE/Prefill/Decode disaggregation (most required engine functionality is already implemented)", and load balancing across data-parallel replicas.
The code agrees. LLMEngine's docstring says the LLM class wraps it "for offline batched inference.
This release does not include an online-serving wrapper." The hooks that would save KV to the store or
hand it to a decode machine (init_pd_split, pe_prepare_save_kvcache, pe_do_save_kvcache) sit under a
comment that translates as "from here on these are all virtual functions", and each body is a docstring.
What does ship is the engine that runs on either side of that split: EngineType has NORMAL,
PROMPT (prefill only) and COMPLETION (decode only), and the scheduler handles all three (measured).
The repository is 348 tracked files: 270 Python files holding 54,929 lines, and 5,908 lines of C++ in 15
.cpp and 18 .hpp files. There are no .cu files at all (measured). Twenty-three Python files open with
# Derived from vLLM; modified by DeepSeek., and the acknowledgements say it "was originally built
primarily on vLLM, with additional inspiration from SGLang and TensorRT-LLM" (measured, reported). The
licence is Apache-2.0; deepseek-recipe is MIT (measured).
What fills the gap is doc/inference_deployment_qa.md, a long Q&A describing the whole service. Almost
everything below about storage and balancing comes from it, so it is reported.
The system the engine was cut from
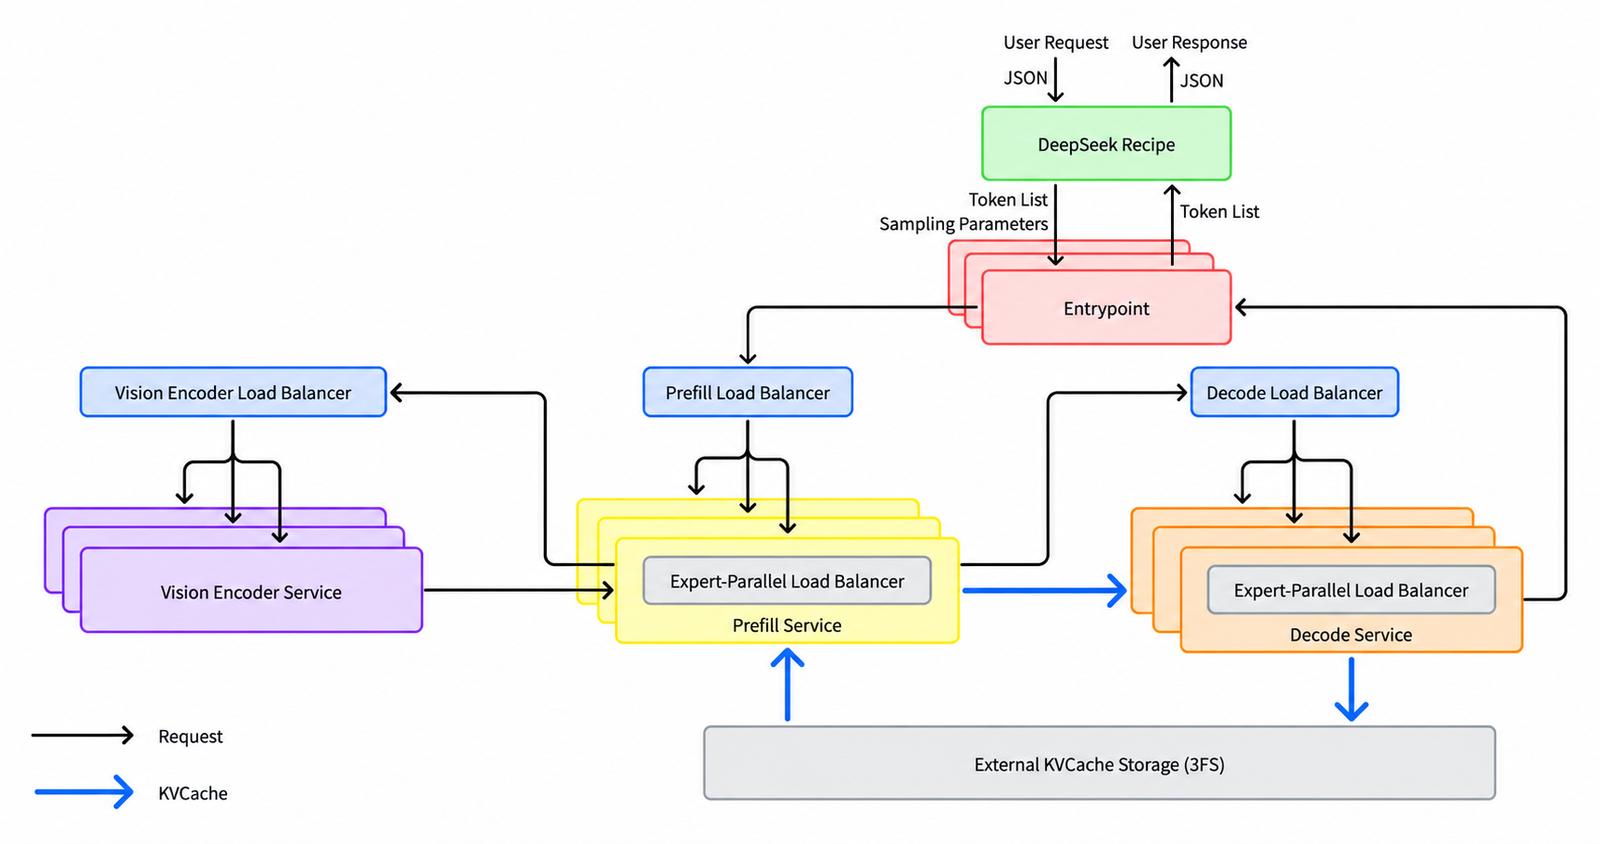
The shape is the one DeepSeek described for V3: separate prefill and decode, attention in data parallel, the MoE in expert parallel with as many EP ranks as DP ranks. What changed is the numbers (reported):
- Prefill runs EP2 to EP8, "the smallest EP/DP that HBM allows". Decode runs EP64 to EP128, "the largest EP/DP that the available GPUs allow". No tensor parallelism.
- Prefill and decode GPUs come in roughly a 1:1 ratio, so "the smallest efficient deployment unit is 64 GPUs of prefill plus 64 GPUs of decode".
- The KV cache lives on a dedicated 3FS cluster of about 100 PiB, kept 3 days for agent traffic and 7 for chatbot traffic, and decode writes its KV back too. Any prefill machine can hit any prefix, so the prefill balancer does no prefix-affinity routing.
- "A single cluster currently serves 155 trillion tokens per day, with overall revenue of US$38 per GPU-hour (at valley pricing)." Neither number can be checked from the repository.
Here is one request through it, with what each stage holds. Solid boxes are code you can read today; dashed ones are prose.
In words: deepseek-recipe turns the API request into tokens. The entrypoint matches the prefix against store metadata and computes the hit before routing. The prefill balancer buckets requests into four context tiers (under 16K, 16K to 64K, 64K to 256K, 256K and up). A prefill engine swaps the cached KV in layer by layer over GPUDirect RDMA while its forward runs, and computes the rest. The KV and the sliding-window state move to a decode machine. The decode balancer places the request to even out both request count and total KV length. The decode engine drafts, verifies and streams tokens back.
Inside the engine: C++ schedules, Python launches
The control loop is Python (LLMEngine.step), but the scheduler, sequence state, block manager,
input-tensor preparation and output processing are C++ behind pybind11. Scheduler::_schedule releases
the GIL on entry. Three design choices stand out against vLLM and
SGLang.
One step type per DP group. vLLM's V1 scheduler mixes prefill chunks and decode tokens in one batch.
DeepInfer's NORMAL engine never does: each step the whole DP group votes, through an all-reduce, on
whether to run prefill or decode. The comment says only that a DP group must run one step type; the
MoE all-to-all, which every rank joins, is the likely reason (reasoned). Every prefill_attempt_interval decode steps it asks whether all
ranks have prefill work; every prefill_any_attempt_interval steps it asks whether any do, so a lone
rank's prompt waits a bounded number of steps (measured, from scheduler.hpp).
Prefix caching is not the engine's job. vLLM hashes blocks inside the engine; SGLang keeps a radix
tree. DeepInfer's BlockManager is a reference-counted free list with no hashing at all: the prefix
index lives in the entrypoint and the bytes in 3FS. Decode admits sequences shortest-output-first and,
when blocks run out, preempts from the longest-output end. The header comment says it preempts the
shortest; the code sorts by output length descending and evicts running[l], the longest (measured,
_schedule_decode).
Async scheduling. It follows SGLang and NanoFlow, the Q&A says: while the GPU runs forward(N) and
sample(N), the CPU runs schedule(N+1), launches it, and only then post-processes step N−1. That is why
the C++ keeps two counters per sequence (schedule_cnt, process_cnt) and accepts being one step behind
on acceptance rates.
A KV cache for three kinds of attention memory
DeepSeek-V4.1-Flash has 40 layers, a 128-token sliding window, compressed attention with a sparse
indexer, and two Engram n-gram tables at layers 1 and 14 (measured, from the Hugging Face config.json).
The V4.1-Flash-1017 article covers the weights; here is what the
serving side keeps per request.
cache_engine.py allocates two pools. The paged pool holds the compressed main KV and the indexer
keys in fixed blocks, stored in FP4: "per-16, e4m3" for main KV and MXFP4 for the indexer (reported).
The state pool gives each sequence one fixed StateBlock: an SWA ring per layer plus the compression
accumulators. The ring is the 128-token window plus DEEPINFER_MAX_BACKTRACKING_TOKENS, which defaults to
draft length plus one, so 134 tokens at 528 bytes each (measured from environ.py and cache_engine.py).
The layout is ordered by what must persist. Only the first 20 layers' SWA goes to disk, and the Q&A gives the size: "20 layers × 134 tokens × 528 B = 1,415,040 B per sequence". The arithmetic holds (reasoned). The other 20 layers are the decoder half of V4.1's encoder-decoder split: their block KV is projected from the last encoder layer, so after a cache hit only their SWA needs rebuilding.
That is what SWA bounded replay buys. Rebuilding a sliding-window cache exactly means running the last 2,560 tokens through 20 decoder layers. DeepInfer recomputes only the last 128, truncating each query's window to the replayed span, which "yields an approximate SWA KV cache". The README's default keeps 140 tokens. The Q&A says this nearly halves total prefill compute (reported). It is a lossy shortcut, and the release says so: approximate, used for decode only, never written to the prefix cache.
The Engram tables are handled the opposite way from the community recipes. engram.py shards them
across an engram-parallel group into a DeepEP EngramBuffer and fetches rows by n-gram hash across
ranks (measured). SemiAnalysis's vLLM recipes for the same model offload the tables "to host DRAM through
UVA while the KV cache stays GPU-resident" (reported, InferenceX changelog), because those recipes run
on four GPUs. Spread over 64 decode GPUs, the 202.76 GB of tables is about 3.2 GB each (reasoned).
Kernels: mostly reused, some new
Every GPU kernel in the tree is TileLang: 93 files and 23,331 lines under tilelang_ops/, with CUDA and
Ascend variants (measured). They cover the glue: Engram gathers, KV stores and loads, the DSpark
verify-length kernel, sampling, structured-output masks. The heavy lifting is DeepSeek's existing
libraries, pinned as git submodules: DeepGEMM, FlashMLA, DeepEP and DeepSelect,
plus tile-kernels from PyPI and FlashAttention-4 for the vision encoder only (measured). TileLang
itself is covered here.
On whether the public kernels are the production ones: the internal versions are "broadly the same"; public FlashMLA "lacks one hand-tuned SASS optimization, which makes the decoding kernel 5%–10% slower", and end-to-end performance is "at most 5% apart" (reported).
Expert parallelism and EPLB
With 384 routed experts and 64 redundant slots at EP64, each GPU holds 448 / 64 = 7, matching the Q&A's
"7 experts per GPU" (reasoned). The policy in eplb/policy.py is pure PyTorch, so I ran it on a CPU. On
synthetic Zipf-skewed loads over 384 experts, a plain six-per-GPU placement gave a max-over-mean GPU load
of 3.58 at skew 0.6 and 10.50 at skew 1.0; after the policy placed 448 copies it gave 1.004 and 1.009
(measured, 2 threads on a shared 4-core VM). Those numbers are in-sample, planned and scored on the same
counts. The Q&A's production figure, re-planned every 10,000 steps on a 1,000-step window, is
moe_lb = 1.090 (reported).
DSpark: how many drafts to verify
DSpark drafts five tokens and a confidence head estimates each one's chance
of acceptance. The DSpark paper describes a load-aware verifier; DeepInfer's version is
MTPVarlen::schedule in csrc/engine/mtp_varlen.hpp, and it is not a threshold. It is a greedy:
- For every draft of every request, take the cumulative acceptance rate: the chance it and every draft before it survive. Sort all of them, across the batch, highest first.
- Start with one query token per request. Add drafts down the sorted list one at a time, tracking expected tokens and the step time from a profiled curve of step time against query tokens.
- Keep the size where expected tokens per millisecond peaks; then give each request one extra query token per draft of its own that made the cut.
Because cumulative rates fall within a request, the cut always keeps a prefix of each request's drafts. Under asynchronous scheduling the CPU fixes only the total, and a TileLang kernel redistributes it on the GPU with the freshest confidences.
To see the trade, I rebuilt the greedy in the widget below. The step-time curve is DeepInfer's own decode chart read back as milliseconds per step: 9.99 ms at 32 query tokens per rank, 13.20 at 256, 18.21 at 512 and 31.53 at 1,024 (reasoned, from the chart in the next section).
Below a few hundred query tokens, a step costs about the same however many tokens it carries, so verifying all five drafts is free and the greedy keeps them. Past that, each extra draft costs time and the low-probability tail is cut first. With mean acceptance 0.75 and 60 requests per rank, my reconstruction verifies 3.88 drafts per request and gains 2.8% over verifying all five; at 96 requests, 3.42 drafts and 8.2% (reasoned). The Q&A's own table, from EP64 benchmark data: 3.58 drafts and +5.4% at 60 requests per rank, 3.24 and +11.0% at 96 (reported). Its fixed-five throughput, 13,730 tokens/s per rank at 60, sits within 4% of my curve's 13,271 (reasoned), which says the curve I read back is about right.
What the benchmark measures
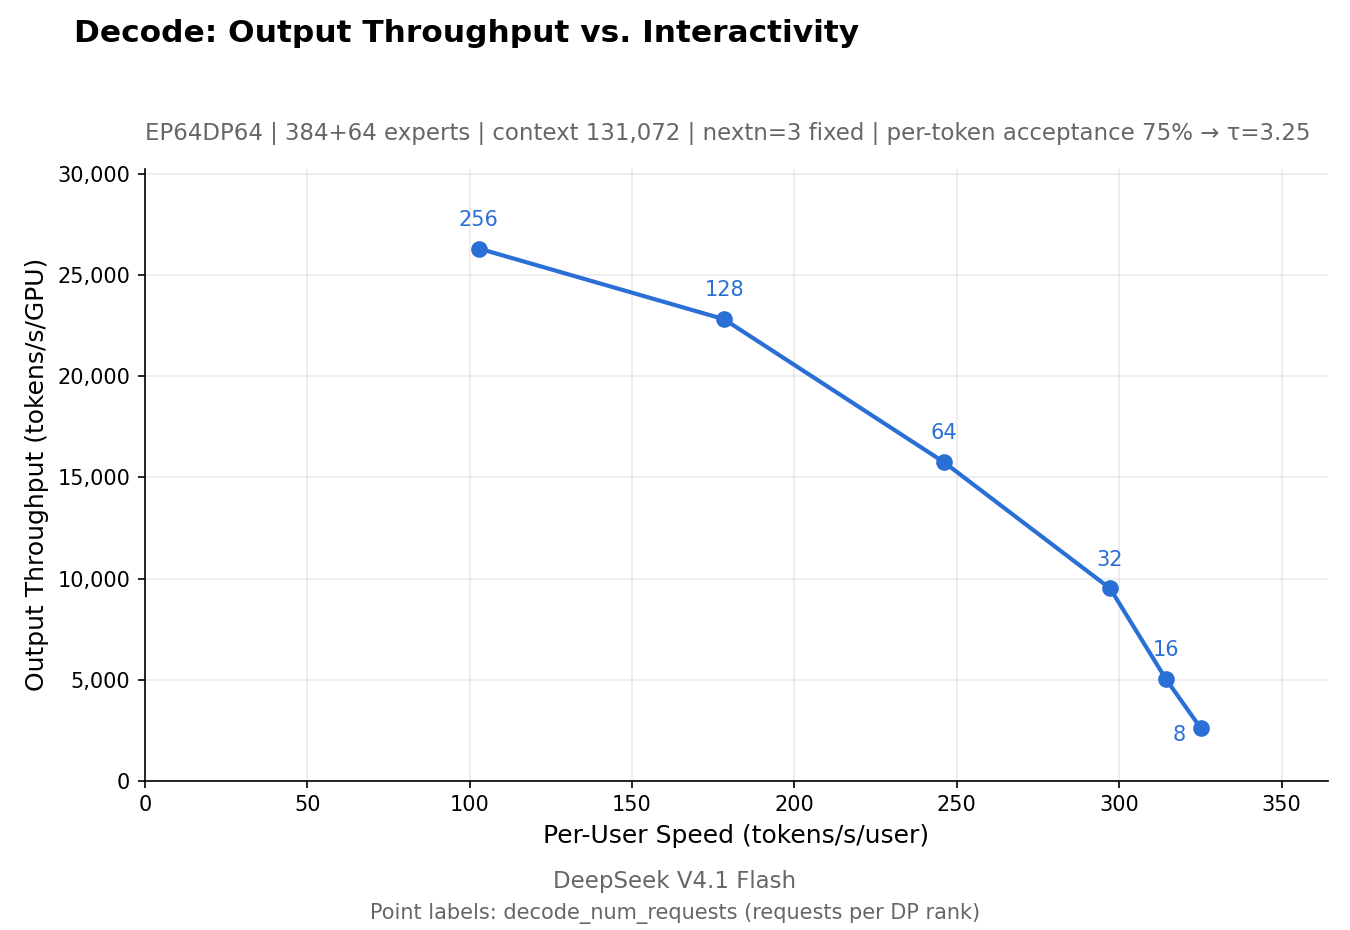
The README says these were "Measured on 4 SM100 GPUs for prefill and 64 for decode — each within one
scale-up domain". The script that makes the plot is examples/sweep/run_sweep.sh, and the axes come
from plot_pareto.py:
# examples/sweep/plot_pareto.py (abridged)
def decode_tau(points, draft_acceptance):
    """τ = 1 + nextn × a"""
    assert not points[0]["mtp_varlen"]
    return 1 + points[0]["nextn"] * draft_acceptance

xs = [p["decode_avg_sps"] * tau for p in points]
ys = [p["decode_avg_sps"] * p["decode_num_requests"] * tau / p["cp"] for p in points]
decode_avg_sps is steps per second, measured over 60 steps after 50 of warm-up, with fixed-length
verification; a comment in benchmark.py translates as "each step always commits 1+nextn tokens, so it
does not depend on the acceptance rate". Then both axes are multiplied by τ = 1 + 3 × 0.75 = 3.25, which
is an input to the plotting script, not a measurement. Every request runs ignore_eos at 131,072
tokens of context with 4,096 not cached (measured, from the scripts).
Reading the six points off the PNG's pixels against its gridlines gives 26,270 tokens/s per GPU at 103.1 tokens/s per user, 22,806 at 178.5, 15,746 at 246.2, down to 2,619 at 325.2. Divide the first axis by the second and you get the batch label every time, 254.9 for 256 and 64.0 for 64, because the y-axis is the x-axis times requests per rank (measured). Per-user speed over 3.25 gives the step time: 31.53 ms at 256 requests and 9.99 ms at 8 (reasoned).
How fair is 3.25? Two things say it is optimistic. Speculative acceptance is a chain: a draft only counts if every draft before it was accepted. The Q&A reports a fixed-five accepted length of 3.29 at the production operating point; a chain with a constant 0.75 per position reproduces that (1 + 0.75 + … + 0.75⁵ = 3.29), and the same chain cut at three drafts gives 2.73, not 3.25 (reasoned). Independently, SemiAnalysis measured V4.1-Flash's DSpark acceptance on SPEED-Bench coding prompts: 3.27 at three drafts with thinking off, 2.90 with thinking on, and 3.51 at five drafts with thinking on (reported). DeepSeek's own 3.29 at five drafts sits below even that. Scale 3.25 down to about 2.7 and the decode chart drops by roughly a sixth (reasoned).
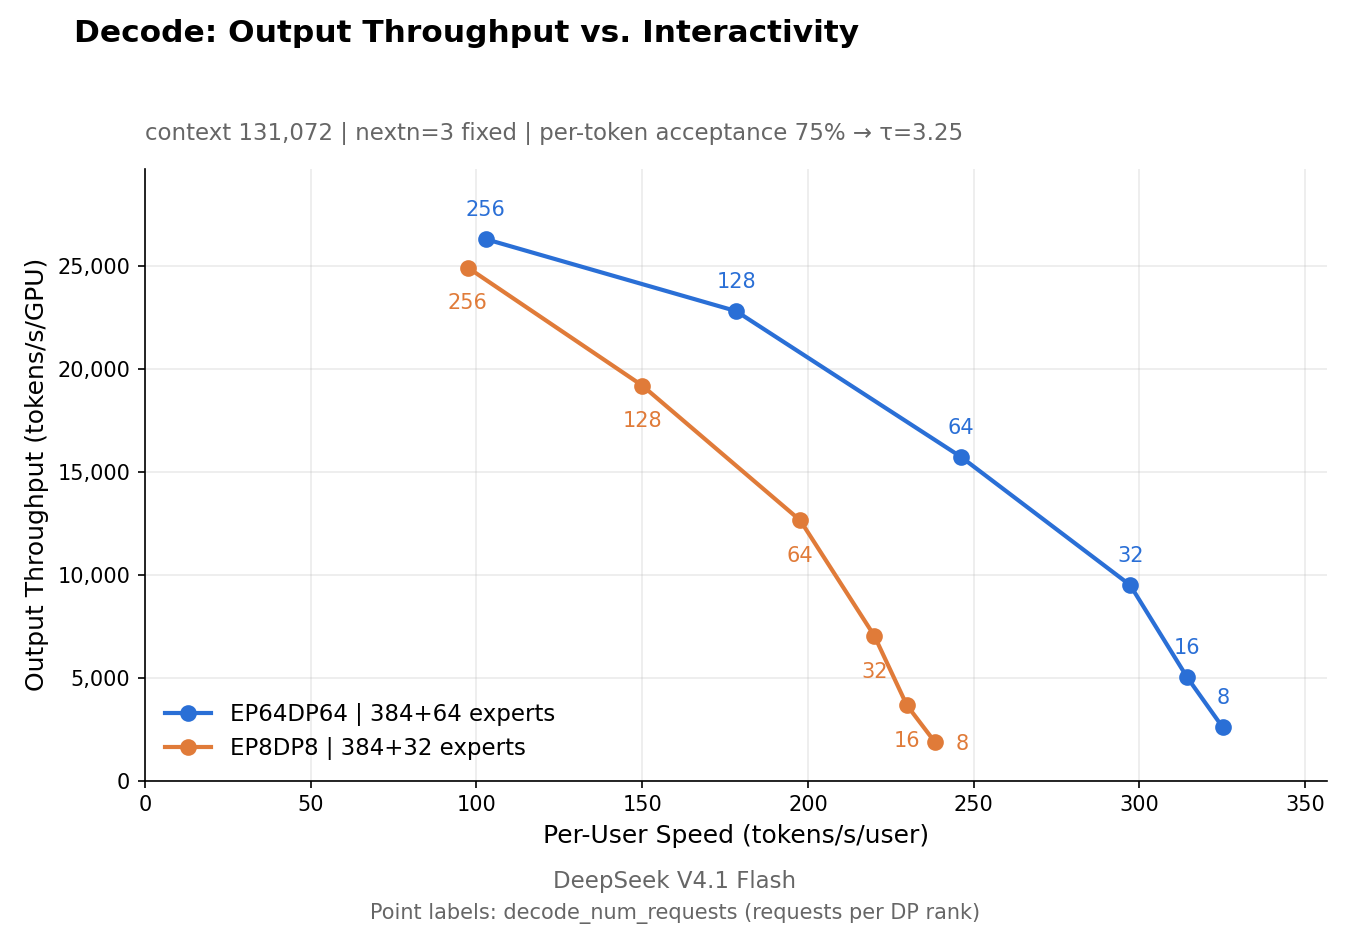
The Wide-EP chart makes the case for 64-GPU decode. At 64 requests per rank, EP8 reaches 12,646 tokens/s per GPU at 197.7 per user; EP64 reaches 15,746 at 246.2 (measured from pixels). Fewer experts per GPU, fewer weight bytes read per step.
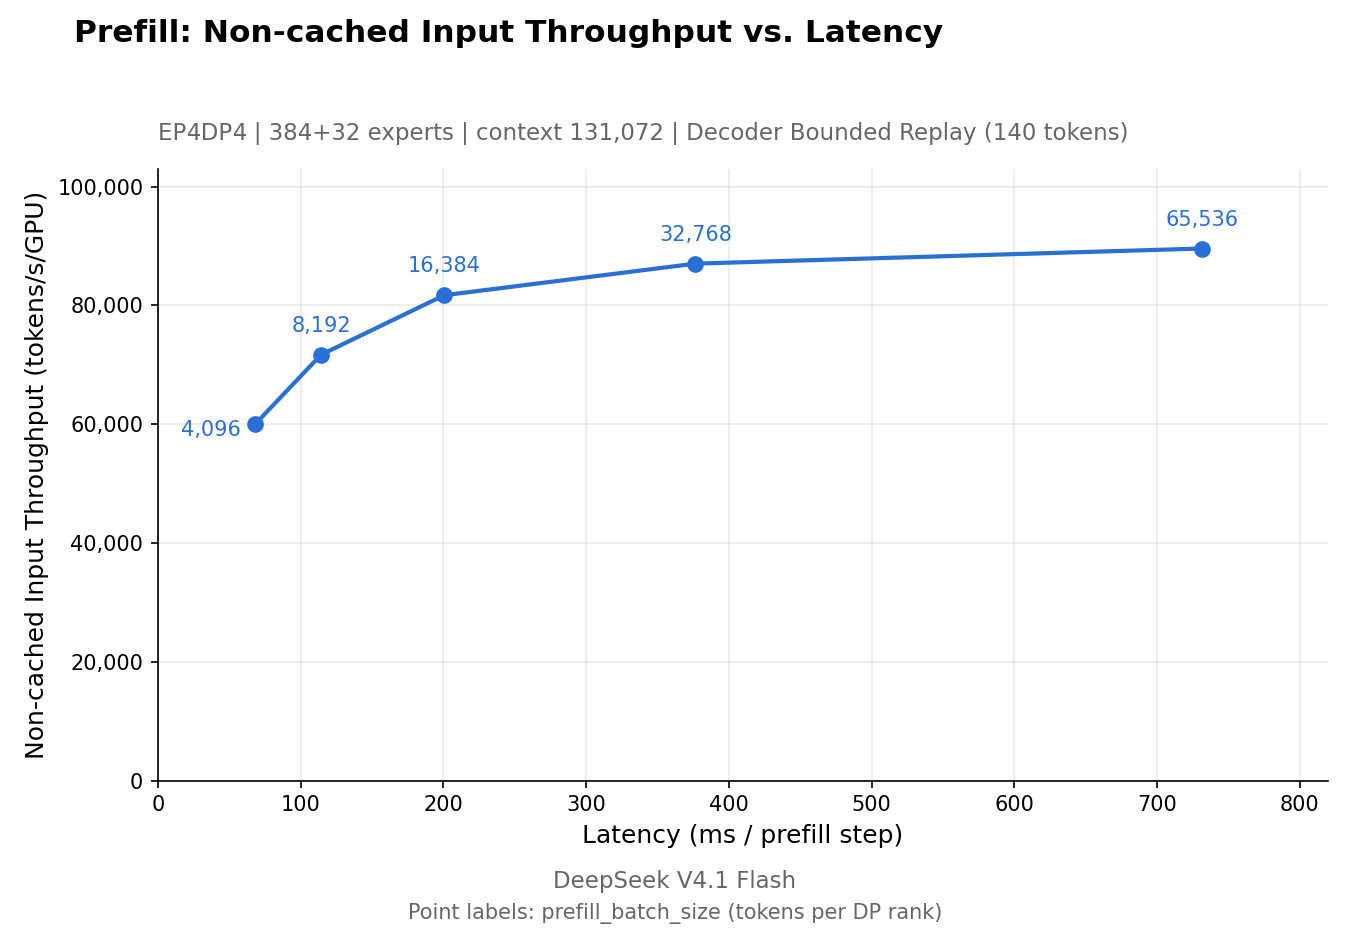
Prefill on four GPUs runs 60,051 tokens/s per GPU at 4,096 tokens a step in 68.3 ms, and 89,474 at 65,536 tokens in 731.7 ms (measured from pixels). This curve has no assumed factor in it.
The chart that ran off the page
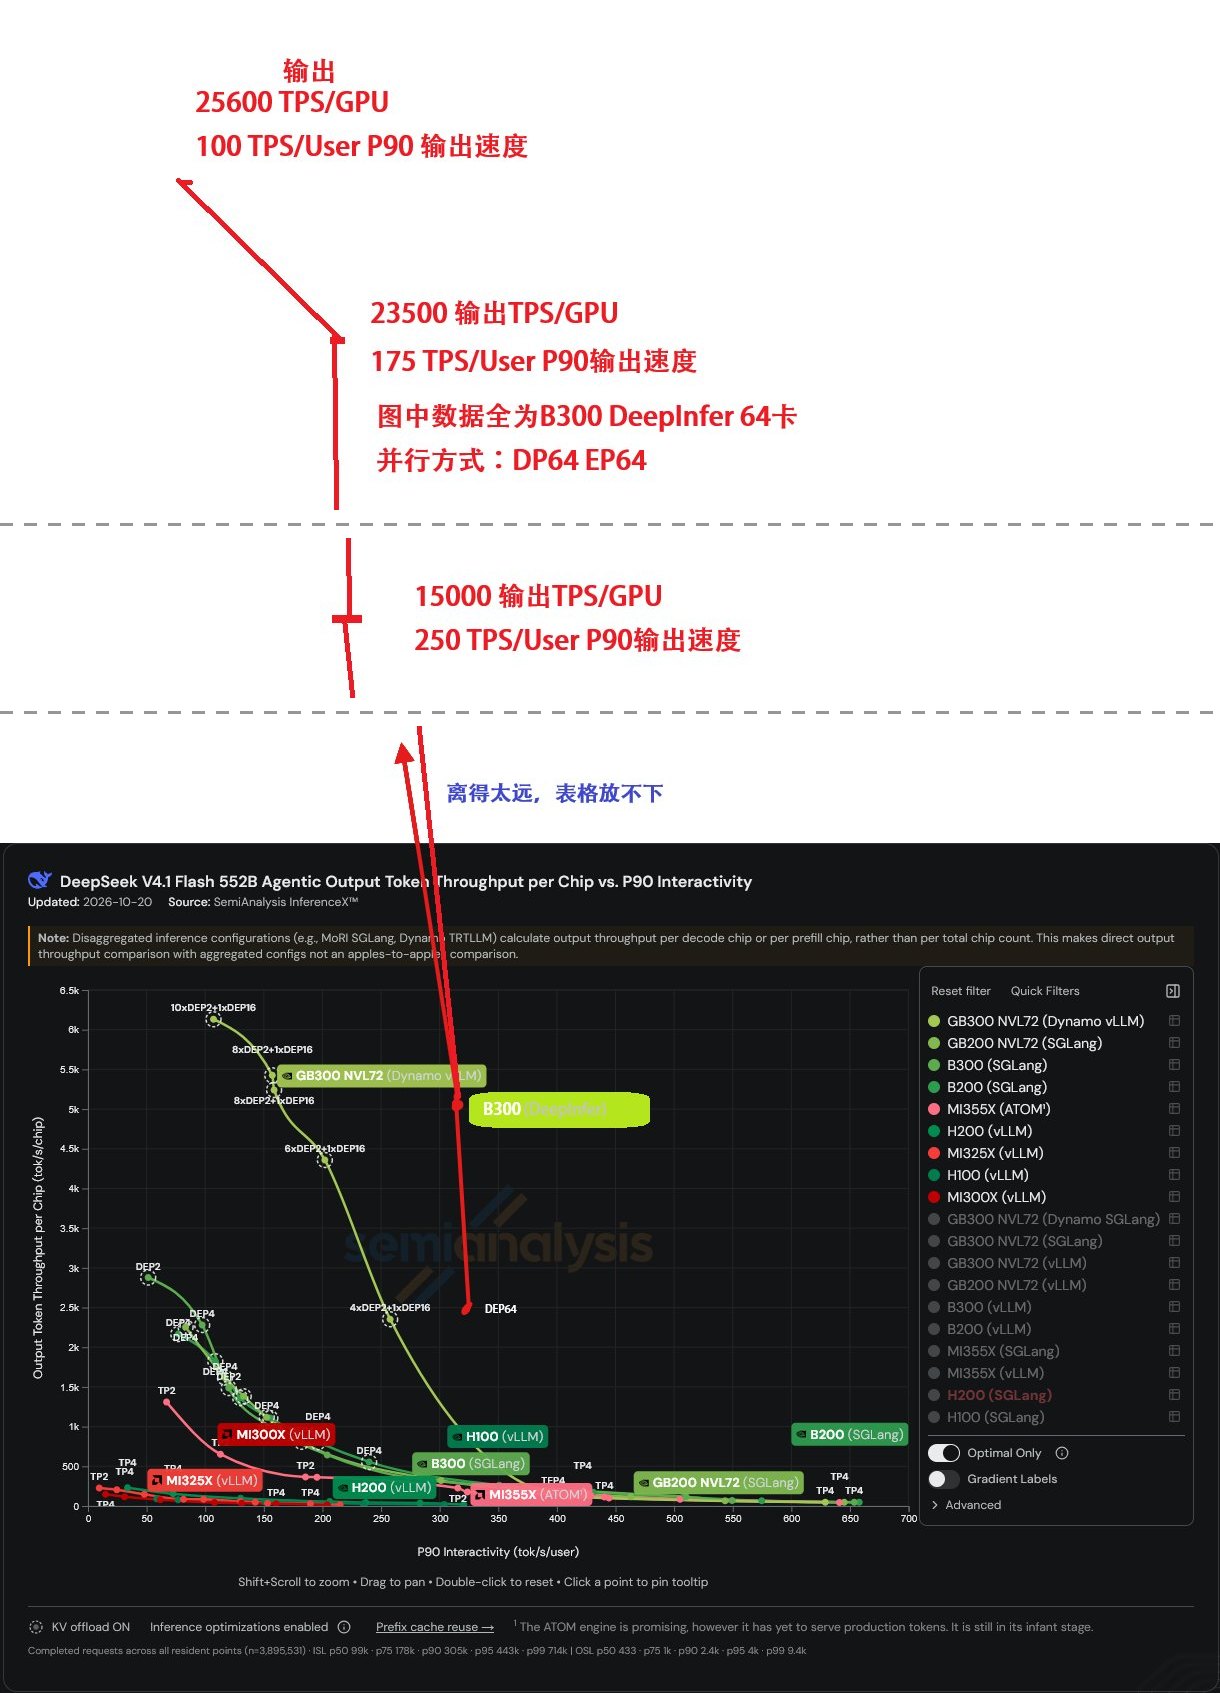
The red text reads: "Output 25600 TPS/GPU, 100 TPS/User P90 output speed"; "23500 … 175"; "15000 … 250"; "All data in the figure is B300 DeepInfer on 64 cards. Parallelism: DP64 EP64." The post says "Data comes from SemiAnalysis's InferenceMAX". Four things about that:
- The DeepInfer numbers are not InferenceMAX's. They are DeepInfer's README chart, read by eye: 25,600 at 100 against 26,270 at 103.1, and so on. SemiAnalysis's benchmark repository contains no DeepInfer configuration at all (measured, by search of a fresh clone).
- "P90" is wrong. InferenceMAX's x-axis is P90 interactivity across a trace replay. DeepInfer's is the mean step rate of a fixed batch, times 3.25.
- "B300" is unverified. The README says SM100 and "one scale-up domain" of 64 GPUs. An eight-GPU B300 box is not a 64-GPU NVLink domain; that needs a rack-scale system such as GB200 or GB300 NVL72 (reasoned). DeepSeek doesn't say which.
- Per GPU means different GPUs. For a disaggregated row, InferenceMAX's API divides output by prefill plus decode GPUs: GB300 Dynamo vLLM at concurrency 7,480 reports 250,443 tokens/s on 18 + 16 GPUs, 7,366 per GPU (measured, API rows fetched 23 October). DeepInfer divides by decode GPUs only, and its Q&A says prefill and decode come 1:1.
Put both on one denominator (decode GPUs) at matched interactivity, and interpolate DeepInfer's curve:
| Run | Per-user speed | Output tok/s per decode GPU | DeepInfer at that speed | Ratio |
|---|---|---|---|---|
| GB300 Dynamo vLLM, DEP16 decode, c7,480 | 145.6 (P90) | 15,653 | 24,317 | 1.55x |
| GB300 Dynamo vLLM, DEP32 decode, c10,888 | 196.5 (P90) | 13,732 | 20,929 | 1.52x |
| GB300 Dynamo SGLang, DEP16 decode, c4,096 | 146.8 (P90) | 9,456 | 24,262 | 2.57x |
| GB300 Dynamo SGLang, DEP16 decode, c2,884 | 196.5 (P90) | 6,978 | 20,929 | 3.00x |
The InferenceMAX columns are measured from its API; DeepInfer's column and the ratios are reasoned. Against the best vLLM run the gap is about 1.5x, which is what the "1.3x-1.5x" reply guessed, and before taking 3.25 down toward 2.7. It is still not like for like. DeepInfer's side is offline decode with no arrivals, no prefill interference and a mean; InferenceMAX's is an agentic trace replay at P90 with mean inputs near 140K tokens, on EP16 or EP32 rather than EP64, and with its own simulated acceptance. The honest summary is that DeepInfer's decode looks clearly ahead of the open engines' best published V4.1 runs, by less than the chart drew. Nobody has yet run DeepInfer under InferenceMAX's harness. That needs 64 GPUs and the store, router and transfer code DeepSeek kept back.
For a single-user number on similar hardware, see Kimi K3 on GB300; for why a Pareto chart is not a deployment, see Qwen3.8 on vLLM.
What I ran
In a Python 3.12 venv with CPU PyTorch 2.14.1, on a shared 4-core cloud VM, no GPU:
tests/models/test_eplb_policy.py: 26 passed, 6 skipped (CUDA cases), with an emptydeep_epstand-in so the package's imports resolve.tests/test_cuda_sync_guards.py: 6 passed, 1 skipped.tests/distributed/test_shm_broadcast.py: 3 passed.- The EPLB probe above.
What did not run: the C++ extension deepinfer._C. setup.py builds it as a CUDAExtension linked
against libcuda, so the scheduler, block manager and DSpark greedy tests (test_sequence.py,
test_flops_estimator.py) cannot load without a CUDA toolkit. Hence the widget re-implements the greedy
rather than calling it. I did not build or run deepseek-recipe's Rust crates.
Where this leaves things
- The release is the engine, not the service (measured). KV storage, P/D transfer and the four load balancers are described, not shipped, and the Q&A says they are "tightly coupled to our internal infrastructure".
- The scheduler is C++, with no in-engine prefix cache and one step type per DP group (measured).
- DSpark's verify length is a greedy over a profiled step-time curve, worth a few percent at production concurrency and more under load (reported, and reproduced in shape, reasoned).
- The headline decode chart multiplies a measured step rate by an assumed 3.25, which DeepSeek's own acceptance numbers suggest is high by about a sixth (reasoned).
- The viral comparison mixed sources and denominators; on a common denominator DeepInfer is about 1.5x vLLM's best GB300 V4.1 run (reasoned).
- Not verified: the GPU model, the 155-trillion-tokens-a-day and $38-per-GPU-hour figures, and anything about the unreleased store and balancers.
For the request side, deepseek-recipe is the more immediately usable piece: an MIT Rust library that renders V4 and V4.1 prompts and parses DSML tool calls the way the official API does. Combine it with DeepSeek Harness and the client end of DeepSeek's stack is now open. The serving end is open as far as one engine, which is further than most labs go. If prefill and decode are new to you, start there.
- license
- MIT
- branch
- main
- tests
- 2 files
- source
- 951.1 kB
- commit date
- 2026-10-19
by size of tracked source at this commit, file counts in brackets; docs, data and vendored trees excluded
local clone, 2026-10-23 at 935817c — branch, commit, commitDate, fileCount, hasTests, languages, license, licenseFile, shallow, testFileCount
shallow clone: counts describe the pinned tree, not the history