2026-10-15 · 22 min · mixture-of-experts · sparse-attention · hybrid-attention · long-context · kv-cache · agents
Why read this
Notabletop 60%Step 5 recounted from 26 shard headers and its Triton kernels: how block-of-8 Sparse GQA selects, what 1M tokens cost in cache and reads, and an explorer.
- Original analysis
- A new technique
- Concrete numbers to act on
LLM architectureNeeds datacenter GPUsCustom licencePractitioner model
How this was scored
- Is it new?
- 2 of 3: A real new idea, method or capability
- Can I trust it?
- 2 of 3: Measures key facts from files, code or configs
- Can I run it?
- 1 of 3: API-only, gated or restrictive licence
- Will I understand it?
- 2 of 3: Mechanism from first principles with figures
- Can I act on it?
- 2 of 3: A concrete recipe, numbers or comparison
- Will it last?
- 1 of 3: Relevant for months
- Does it affect many?
- 1 of 3: A specialist community
- Only here?
- 2 of 3: A teardown or measurement few others did
Score 60 of 100, ranked 334 of 577 rated articles. Each question is answered 0–3 by hand, and a 3 is rare. How articles are scored
StepFun put Step 5 Preview on Hugging Face as open weights, with the launch thread leading on four lines: a sparse MoE with 600B total and 27B active parameters per token, a 1M-token context, native text and vision input, and a focus on long-horizon agentic work. The FP8 repository was created on 2026-09-20; the BF16 one the same day, and an NVFP4 build appeared on 2026-10-14. The technical blog and an updated agent harness, Step Code, came with the thread.
The blog makes two architecture claims I wanted to check against the files. One is depth: "a narrow-but-deep design with 92 transformer blocks". The other is a new attention variant, Sparse GQA, which it says reduces "the cost of the indexer and top-k selection by 8x". Both are checkable without downloading weights. The config.json gives the shapes, the repository ships a standalone inference/ directory with the model code and Triton kernels, and every safetensors shard starts with a JSON header listing each tensor's dtype and shape. I range-read the headers of all 26 BF16 shards and read the kernels.
Every number below is labelled: measured (I computed it from a file), reported (StepFun's figure, not re-run), or reasoned (my arithmetic on the other two).
- architecture
- Step5ForConditionalGeneration
- license
- other
- safetensors
- 28 shards
- largest file
- 41.22 GB
- files
- 49
- downloads
- 144
- likes
- 59
repo last modified 2026-10-15
The shape: narrow and deep
From config.json (measured):
- 92 decoder layers, hidden size 4096, vocabulary 128,896, untied embedding and
lm_head. - 64 query heads in 4 KV groups, head dimension 192. The query projection is 4096 to 12,288, three times the residual width. Each layer also has a head-wise sigmoid gate (
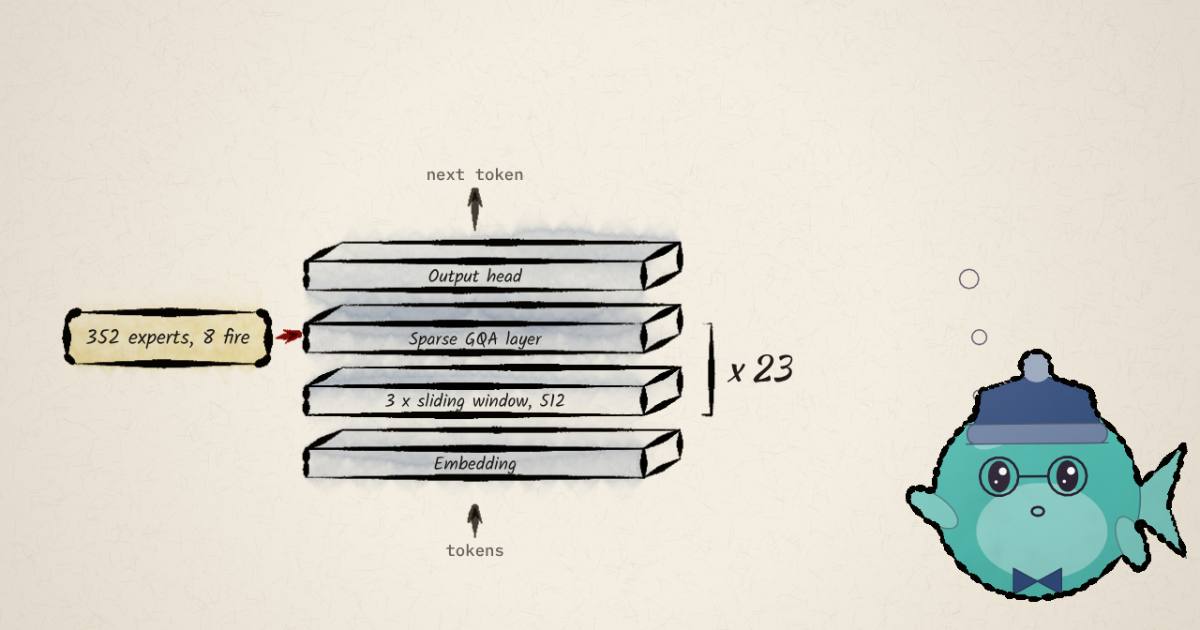
g_proj, 64 outputs) applied to each head's output beforeo_proj. - Two layer types in a fixed 3:1 pattern.
layer_typesreadssliding, sliding, sliding, full23 times: full attention at layers 3, 7, 11, through 91. That is 69 sliding-window layers with a 512-token window and 23 full-attention layers, and only the full ones get the sparse indexer (apply_to_layer_types: ["full_attention"]). - The FFN is a 352-expert MoE in layers 3 to 90: 8 routed experts per token plus one shared expert, each a SwiGLU of width 1536. Layers 0, 1, 2 and 91 use a dense SwiGLU of width 13,824 instead.
- Three multi-token-prediction layers (
num_nextn_predict_layers: 3), which the vLLM recipe uses as a three-token speculative draft (--spec-method mtp --spec-tokens 3).
"Narrow" is the hidden size. Kimi K3 is 93 layers deep at a hidden size of 7,168; Step 5 is one layer shallower at 4096. The blog's argument for depth is about prefill: information moves forward in both time and depth, so a chain of dependencies spread across a long tool-heavy prefill can "run out of layers". I can't test that claim. What I can say is what depth costs here: 92 sequential layers is 92 rounds of attention, routing and all-reduce per token, which is latency that width would have parallelised.
The blog is also candid that depth was hard to train. It reports keeping the residual stream in FP32 (fp32_residual_connection: true in the config, measured), storing the zero-centred RMSNorm scale in FP32 because BF16 is too coarse near the value that switches a channel off, and clipping "only 0.00004% of gradient values per layer" to stop gradient spikes that start in middle layers (all reported). The reference code backs the norm detail: its Step5RMSNorm computes x / rms(x) * (1 + w) in fp32, and the comment warns that reading the weights as a plain scale "multiplies every activation by roughly zero" (measured).
If MoE routing or grouped-query attention is new, the MoE explainer and the attention and KV-cache explainer cover the basics.
Counting the parameters
The 26 BF16 shards hold 2,449 tensors. Grouping them (measured):
| Group | Parameters |
|---|---|
| Routed experts, 88 layers x 352 x 3 x 1536 x 4096 | 584.65B |
| Attention (q, k, v, o, gate), 92 layers | 9.86B |
| Shared experts, 88 layers | 1.66B |
| Dense FFN, layers 0-2 and 91 | 0.68B |
Embedding + lm_head, untied | 1.06B |
| Sparse indexer, 23 layers | 0.44B |
| Routers and their biases | 0.13B |
| Main language model | 598.48B |
| MTP layers, 3 | 2.52B |
| Vision encoder + projector | 1.98B |
| Everything in the files | 602.97B |
"600B total" holds: 598.5B for the language model, 603.0B for the whole checkpoint. The routed experts are 97.7% of the main model (measured).
Active per token is everything except the routed experts, plus 8 of 352 routed experts in each of the 88 MoE layers. That is 13.82B + 88 x 8 x 18.87M = 13.82B + 13.29B = 27.11B (measured), or 26.58B without the embedding, which is a row lookup rather than a matmul. "27B active" holds.
Two things stand out. First, attention is 9.86B of the 26.58B a token multiplies through, about 37% (reasoned). Wide queries (12,288 dims) on 92 layers add up. Second, each MTP layer carries its own full 128,896 x 4096 output head, 528M parameters, so the three-layer draft is 2.52B, of which 1.58B is three copies of a vocabulary projection (measured).
On disk the FP8 checkpoint's total_size is 644,100,979,280 bytes, 599.9 GiB, and the NVFP4 one 394,164,831,232 bytes, 367.1 GiB (measured from the index files). One oddity: the BF16 index claims 1,208,684,168,984 bytes, while its own headers sum to 1,205,950,680,832, a 2.7 GB gap I could not attribute to any tensor (measured). It does not affect loading; the index's weight_map and the headers agree on all 2,449 names.
Sparse GQA, read from the kernels
Three of every four layers are cheap by construction. A sliding-window layer keeps a ring buffer of the last 512 tokens (DenseLayerCache in inference/model.py) and never looks further back, so its cost is constant in context length. The interesting part is the 23 full-attention layers, because at 1M tokens they are what you pay for.
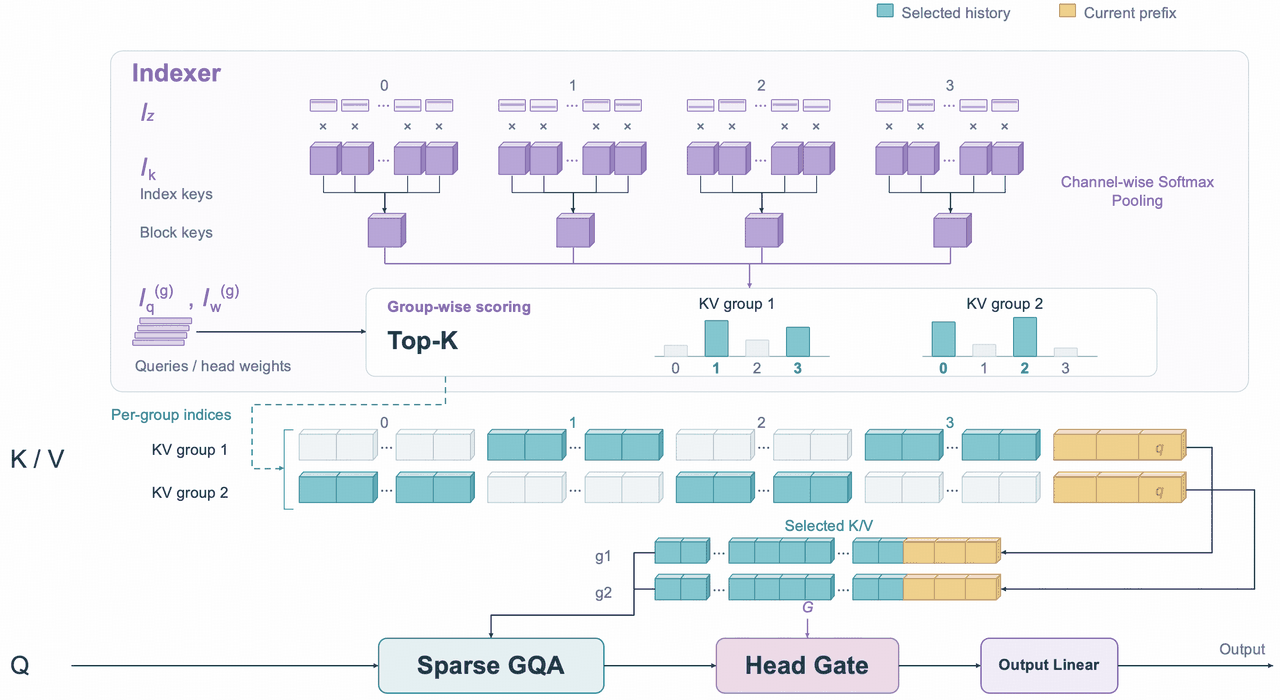
The mechanism has four steps. Each is in inference/kernel.py (measured from the code):
- Project a small index. Every token in a sparse layer gets an index key
kand a pooling logitz(each 256-dim, one head shared by all groups), and index queriesq(16 heads, 4 per KV group) with per-head weightsw. These come from four small projections,sparse_indexer_q/k/z/w, 18.9M parameters per layer. The index key gets RoPE on 32 of its 256 dims. - Compress every 8 tokens into one summary. When a region of 8 consecutive tokens is complete,
_csa_compress_regions_kernelpools its 8 index keys into one vector. The weight is a softmax over the 8 tokens taken separately for each of the 256 channels: . So it is a per-channel weighted mean, not an average of whole keys. The summary is stored in FP8 E4M3, 256 bytes per region per layer. An incomplete region is never summarised; its tokens wait in a pending buffer. - Score regions, per KV group. The score of region for a query is over the group's 4 index heads. Then each of the 4 KV groups keeps its own top 512 regions (
topk: 512), with ties broken by lower region id. The kernel comment notes ties are common: a score is exactly zero whenever all 4 head dots are negative, about 6.25% of the time. - Attend exactly. Each group's 8 query heads run ordinary softmax attention over the full-precision K/V of its 512 chosen regions, plus the region the query sits in, which is always appended rather than competing for a slot. That is 512 x 8 = 4,096 history tokens plus up to 8 local ones.
The design choice that gives the method its name is that selection is per KV group. DeepSeek's DSA, which the blog cites as the inspiration, runs one indexer and one selection shared by every head. With GQA, the blog says, sharing one indexer across groups "compromises GQA's suitability for parallelism and has a relatively noticeable impact on model quality" (reported). Per-group selection also fits tensor parallelism: in the reference TP=8 layout each pair of GPUs holds one KV group's cache, so each GPU can select and attend over its own group's blocks without consulting the others. MiniMax Sparse Attention made the same per-group choice; its blocks are 128 tokens wide and it keeps 16 of them.
The other choice is what gets compressed. Step 5 does not attend to compressed tokens. Only the index is compressed, 8 to 1, while the K/V it points at stays full precision and full length. The cost of that is memory: the KV cache still holds every token of every full layer. The win is the indexer: it now has one summary per 8 tokens to score and sort, which is the blog's "1/8".
Why 8, and why 4,096
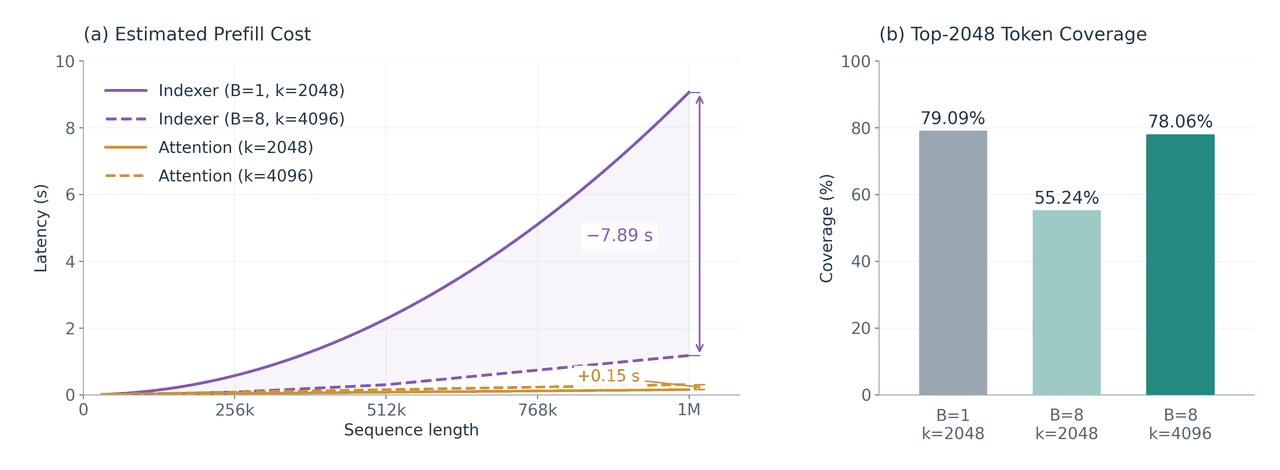
Coarser blocks lose precision: a block of 8 can only be taken whole. StepFun's fix is to double the budget. Their chart reports that blocks of 8 with a 2,048-token budget cover only 55.24% of the tokens a per-token indexer would have picked, while doubling the budget to 4,096 brings it to 78.06%, against 79.09% for the per-token reference (reported). At 1M tokens the estimated prefill saving on the indexer is 7.89 s against 0.15 s more attention (reported, estimated by StepFun rather than measured end to end).
The blog adds one implementation detail that the reference code does not reproduce: during prefill, adjacent queries select overlapping blocks, so the production kernel groups queries and takes the union of their selections to keep the GPU busy (reported). The standalone inference/ code is a parity reference. It refuses chunked prefill outright (NotImplementedError) and a comment sizes its RoPE tables for "the production 524288-token capacity" (measured), so it is not the path to a 1M-token run. vLLM and SGLang are.
What a million tokens costs
With the geometry measured, the cost at long context is arithmetic. Per token, one layer's K and V take 2 x 4 groups x 192 x 2 bytes = 3,072 bytes in BF16. All figures below are batch 1 (reasoned):
| At 1,048,576 tokens | Dense GQA on all 92 layers | Step 5 layout |
|---|---|---|
| KV cache held | 276.0 GiB | 69.8 GiB |
| KV bytes read per new token | 276.0 GiB | 1.09 GiB |
| Attention FLOPs per new token | 4.74 TFLOP | 31.07 GFLOP |
The cache shrinks about 4x, and only because 69 of the 92 layers are sliding windows: those 69 hold 0.10 GiB between them at any length. The 23 sparse layers still keep all 1M tokens, 69.0 GiB, plus 0.72 GiB of FP8 region summaries. Sparse GQA saves reads and arithmetic, not memory.
Reads drop by roughly 250x. A new token reads the sliding windows (0.10 GiB), every region summary in the 23 sparse layers (0.72 GiB), and the K/V of 4,104 selected tokens per group (0.27 GiB).
The FLOP line hides the finding I did not expect. Of the 31.07 GFLOP, the 69 sliding layers take 1.74 and exact attention over the selected tokens takes 4.64. The indexer takes 24.70 GFLOP, about 79%. Even compressed 8x, scoring 131,072 regions with 16 heads of 256 dims costs more than all the attention it gates, and about half as much as the 53.17 GFLOP of weight matmuls for the 26.58B active parameters. With the per-token alternative at a 2,048 budget, the indexer alone would be 197.57 GFLOP, nearly four times the weights. That is the problem blocks of 8 fix, and the reason the blog calls the indexer's overhead "non-negligible". SparDA attacks the same selection cost from another direction, and LongCat 2.0 builds a hierarchical indexer for the same reason.
Drag the context down and the picture inverts. Below 4,096 tokens the budget covers the whole history, so sparse attention is dense attention. The selection only starts to bite once the context is many times the budget.
For comparison, Ling-3.1-flash, a 560B MoE released the same week, stores a compressed MLA latent of 576 numbers on 9 of its 72 layers, 10,368 bytes per token, and puts the rest in fixed-size Kimi Delta Attention states (reasoned from that article's figures). Step 5 holds 71,392 bytes per token (measured geometry, reasoned bytes), about 7x more. StepFun says it chose GQA "for better long-context accuracy (validated in our experiment)" (reported). Whatever the quality case, it is paid for in HBM. A single 1M-token sequence fits beside the 599.9 GiB FP8 weights on an 8 x H200 node, the README's reference setup, but not many of them.
The position encoding supports the length as configured. max_position_embeddings is 1,048,576. The full-attention layers rotate only 64 of their 192 dimensions (partial_rotary_factors = 1/3) with base ; the sliding layers rotate all 192 with . A llama3 rope_scaling block is present, but with factor: 1.0 and original_max_position_embeddings: 1048576, and the reference implementation divides frequencies by that factor, so it changes nothing (measured from config and code). No context-extension trick is applied at inference; the positions are native. Whether the model was trained to use all of them is the blog's claim, not something I can check from the files. Where the RoPE explainer helps: with 64 rotary dims at , the slowest pair turns through well under one revolution in a million tokens (reasoned), so no positions alias.
15 October: day-0 in vLLM
A day after release, vLLM posted a six-post thread on serving Step 5 Preview, with a recipe and a vllm/vllm-openai:step-5-preview image. The model code sits in vLLM PR #61727, not yet on main (measured: its vllm/models/step5/ is absent from main today). The thread's charts cite PRs in Inferact/swf, a repository I cannot read, so the numbers below are reported, checked against the open PR's code where it says anything.
The kernels: 43% and 84%, which make 2.2%. On B300 with DEP8, MTP3, FP8 KV and a 60K-token input, the indexer-logits kernel takes 43% less time, the region top-k 84% less, and the whole prefill 2.2% less (reported). Amdahl's law turns that around: if the two kernels together took a share of prefill, the saving is . All from the logits kernel, that is a 5.1% share; all from top-k, 2.6% (reasoned). So at 60K tokens the indexer was between 2.6% and 5.1% of prefill time, and that is the ceiling on what any indexer kernel could have won there. It fits the FLOP count from the section above: each of the 23 sparse layers scores about regions per query on average with 16 heads of 256 dims, about FLOPs per layer, against for the weights. At = 60,000 that ratio is 1.3%; at 1,048,576 it is 23% (reasoned). The indexer is quadratic and the weights are linear, so the same kernels should matter roughly 17x more at 1M than at 60K, but vLLM measured only 60K.
The 4,096 chunk cap is in the PR's code (measured): prefill_indexer_chunk_size bounds the FP32 logits of one chunk at 128 MiB, so a chunk gets 128 MiB / (4 bytes x padded regions) query rows, floored to a power of two, between 256 and 4,096. A 60K prompt has 7,500 regions, padded to 7,680, which allows 4,369 rows and lands on the 4,096 cap; past 64K tokens the chunk halves with each doubling, down to 256 rows at 1M (reasoned from that function). The PR's warmup module explains the JIT point: startup dummy runs are short enough that every row selects its whole history, so summary packing, FP8 logits, top-k and page metadata would otherwise compile on the first long prefill, stalling every data-parallel rank. I could find the stages, not a count of seven.
MTP3 against baseline is a lossless-decoding check. Speculative decoding with three draft tokens should not change what the model says, only how fast, so equal scores are the expected result. AIME25 went 0.9500 to 0.9667, GPQA 0.9268 to 0.9242, OCRBench 0.896 to 0.895 (reported). AIME 2025 has 30 problems, and 0.9500 is 28.5 of them, so the score is an average over samples. Two samples per problem fit both figures exactly: 57 of 60 correct, then 58. GPQA Diamond's 198 questions fit the same way: 367 of 396, then 366. OCRBench's 1,000 questions give 896 then 895 (reasoned; the sample count is my inference, the thread does not state it). Every change is one answer. The standard error is about 0.028 on AIME, 0.013 on GPQA and 0.010 on OCRBench, so none of the three moves is distinguishable from noise, which is what "MTP3 is lossless" predicts (reasoned).
The P/D prototype. Prefill on DEP4 and decode on DEP8 accounts for the 12 GB300s, with NIXL moving the cache and a 384 GiB MooncakeStore holding it. 514,784 prefix-hit tokens at 91.24% implies about 564,200 input tokens in total and about 49,400 computed afresh (reasoned). If that counter spans both 1,000-request OCR runs, prompts average about 282 tokens, and the second pass over the same images is where most hits come from; the thread does not say what it spans. At FP8, a short prompt holds every token in all 92 layers, 141,312 bytes each, so the whole input is about 74 GiB of cache, a fifth of the store (reasoned). The two runs scored 90.4% and 89.4%, a 10-question gap with a standard error near 1.3 points: noise (reasoned). The thread calls this pre-release and pre-rebase, and the P/D PR is still open.
The vision side
The vision tower is a Perception Encoder (model_type: perception_encoder): 47 layers of width 1536, 14-pixel patches over a 728-pixel image, which makes a 52 x 52 grid of 2,704 patches (measured from config and the positional-embedding shape). Two stride-2 3x3 convolutions downsample that to 13 x 13, and a 6,144-to-4,096 projector maps each cell into the language model, so an image costs 169 tokens (image_token_len: 169, measured). The config also has patch_token_len: 81, a 9 x 9 grid, which I take to be the cost of an additional crop tile; I did not trace the tiling code, so treat that as unverified. The model card's spec table lists input as "Text, image" while its introduction says the model accepts "text, images, and video" (reported); the released config describes only images.
The claims against the charts
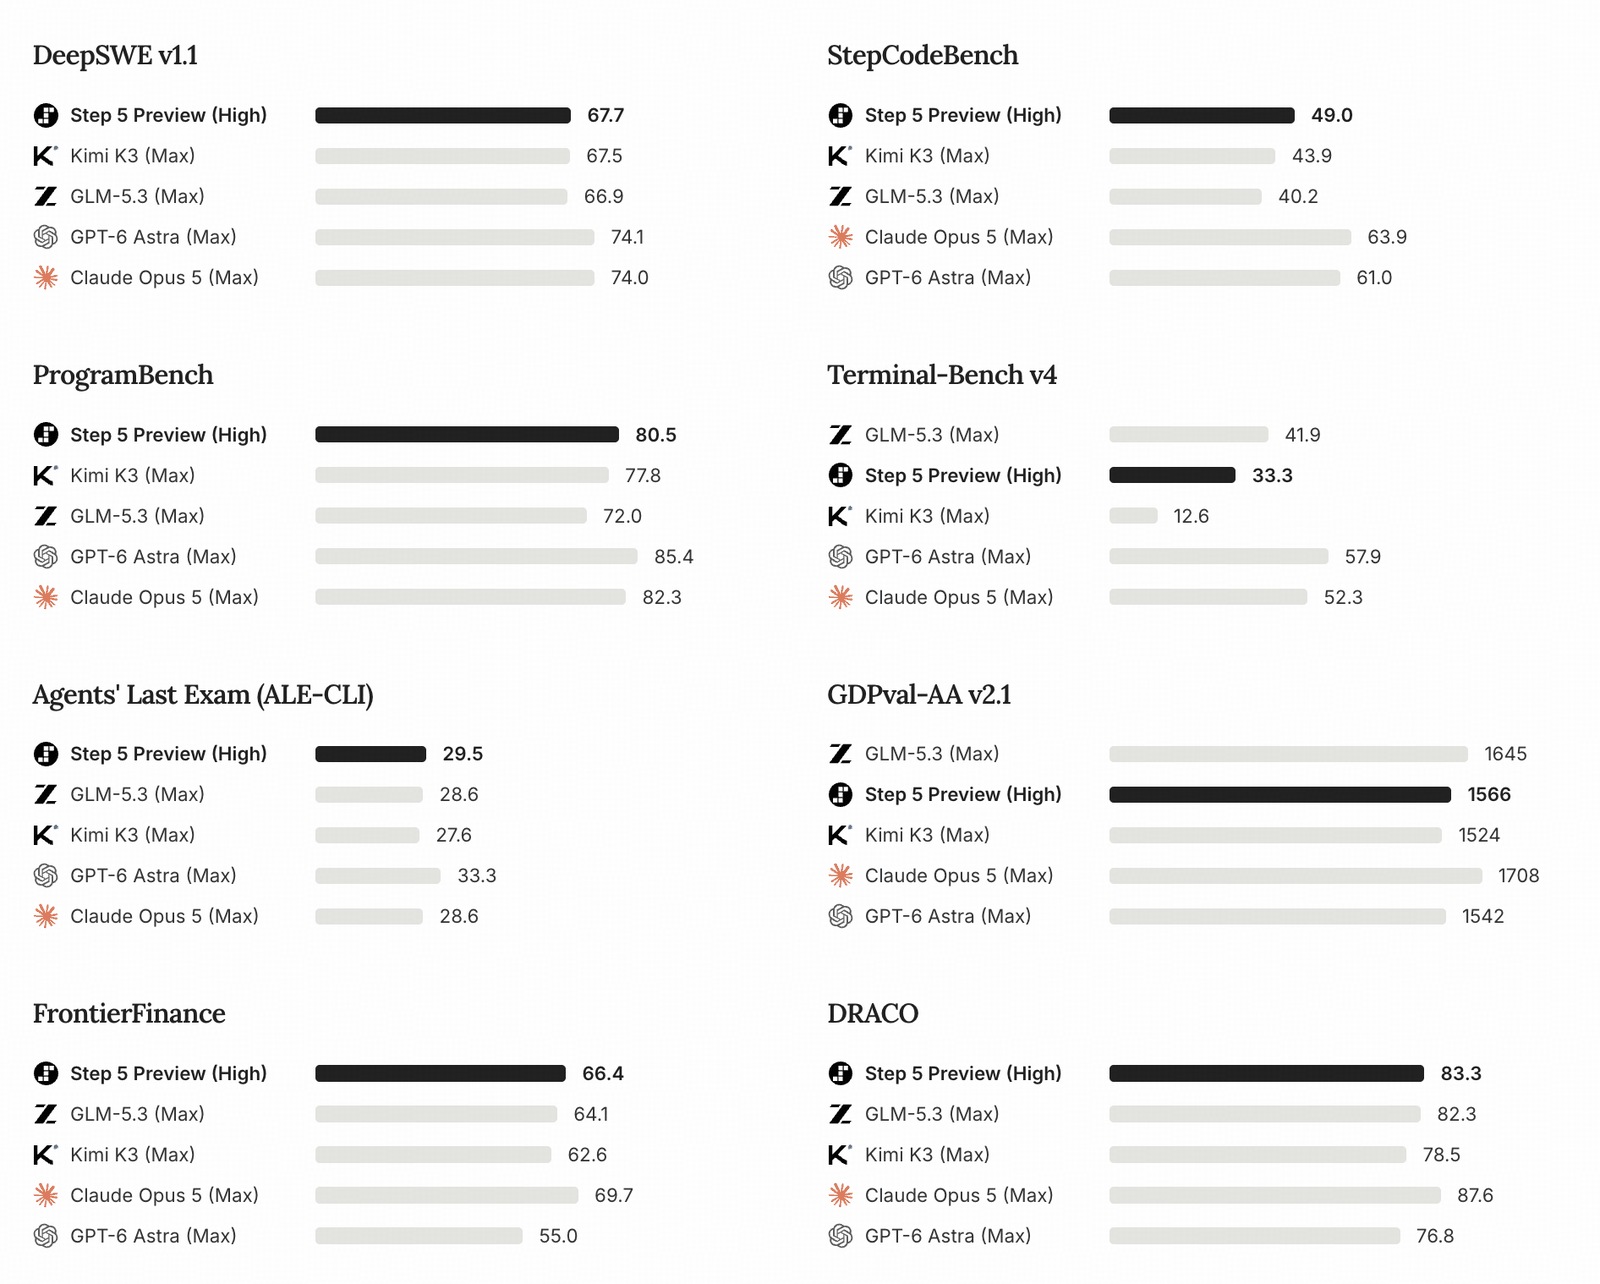
All of these are reported, not re-run, and the card's notes say the Step 5 scores use the High reasoning setting while every comparison model is labelled Max. Read row by row:
- Against the open models it is listed with, Step 5 leads on 6 of 8 charts. It loses Terminal-Bench v4 to GLM-5.3 (33.3 vs 41.9) and GDPval-AA v2.1 to GLM-5.3 (1566 vs 1645). Its leads are narrow on DeepSWE v1.1 (67.7 vs 67.5) and ALE-CLI (29.5 vs 28.6), wider on ProgramBench (80.5 vs 77.8) and StepCodeBench (49.0 vs 43.9).
- Against the closed models it mostly trails. It beats Claude Opus 5 on 1 of 8 (ALE-CLI) and GPT-6 Astra on 3 of 8 (GDPval-AA, FrontierFinance, DRACO). The gaps on coding are about 6 points on DeepSWE and 19 to 25 points on Terminal-Bench v4.
- The finance focus shows against GPT-6 Astra, not Claude. FrontierFinance is 66.4 against GPT-6 Astra's 55.0 and Claude Opus 5's 69.7.
- StepCodeBench is StepFun's own benchmark, so the row where Step 5's open-model lead is widest is also the one with the least outside scrutiny.
"Frontier intelligence, open weights", the thread's last line, is accurate for open weights and generous for frontier. The fairer summary is the best-performing open model on most of StepFun's chosen charts, at 27B active, which is a quarter of Kimi K3's 104B.
Step Code, briefly
Step Code is the terminal agent StepFun tunes alongside the model. The thread calls this release v0.1.4, its fourth since open-sourcing (reported); I could not find that version string in the clone, whose head commit is d0ec996 from 2026-10-15 with 1,529 tracked files (measured). It is MIT-licensed and, per its own LICENSE-STATUS.md, derived from Mario Zechner's MIT-licensed Pi agent (measured). The README lists /goal for handing off a long task, /cron for scheduled runs, subagents with isolated contexts, MCP and Agent Skills support, and says "most Claude Code plugins are directly compatible" (reported). The blog's training section is where the harness matters: it describes RL in which the policy learns to compact its own context when the budget runs out, rather than relying on 1M tokens (reported).
Licence
The weights, config, tokenizer and model code are under the StepFun Model License 1.0, the same text in the Hugging Face and GitHub repositories (measured by diff). It reads like Apache 2.0, a perpetual royalty-free grant with a patent clause, plus three conditions:
- Attribution at scale. A product with more than 100,000,000 monthly active users, or over US$20,000,000 in monthly revenue, must display "Powered by StepFun AI".
- A separate commercial licence is required to ship the model's capabilities as a feature of hardware devices you make or brand, or for commercial use while operating a model-as-a-service business with more than US$20,000,000 in revenue over twelve months.
- Distillation counts. "A model trained to a material extent on outputs of the Model is deemed to reproduce or contain a substantial part of the Model", so it is a Derivative Work under the same terms.
Internal use that exposes nothing to third parties is exempt from the commercial-licence clause. It is permissive for most teams and not an OSI licence, hence custom here.
What I take from it
- The size claims hold. 598.5B in the language model, 603.0B in the files, 27.11B active per token with the embedding and 26.58B without (measured).
- "Sparse GQA" is exact attention over a learned selection. Each of the 4 KV groups picks 512 blocks of 8 tokens, 4,096 tokens plus the current block, from FP8 summaries pooled per channel (measured from the kernels).
- The KV cache is still big. About 4x below an all-dense layout at 1M tokens, 69.8 GiB per sequence, and all of the saving comes from the sliding-window layers (reasoned).
- The indexer is the new bottleneck. At 1M tokens it is about 79% of attention-side FLOPs per decoded token even after the 8x compression; without it, it would be nearly four times the weight matmuls (reasoned).
- vLLM's indexer speedups matter little at 60K tokens and more at 1M. 43% and 84% faster kernels gave 2.2% faster prefill, so the indexer was 2.6 to 5.1% of it; its FLOPs grow quadratically and reach about 23% of the weight matmuls at 1M (reported, then reasoned).
- The benchmarks lead the open models it lists and trail the closed frontier, on charts where Step 5 runs at High and the others at Max (reported).
What I could not check, from the vLLM update: the Inferact/swf PRs behind its charts, the count of seven JIT warmups, and how many samples sit behind each eval score; I read PR #61727's code, not its benchmarks. From StepFun's side: the depth-for-multi-hop argument, the training-stability ablations, the coverage numbers in the top-k chart, and any score in the benchmark panel. All are StepFun's. The files back everything about the shape; the rest needs someone with an 8-GPU node and a long prompt.