2026-09-22 · 15 min · inference · serving · systems · vllm · mixture-of-experts · benchmarks · explainer
vLLM's post on PD serving for Qwen3.8-2.4T opens with two numbers: 5,000 total tokens per second per GPU in the high-throughput case and 180 generated tokens per second per user in the low-latency case, on a GB300 NVL72 cluster at 8K input / 1K output.
The post then says something most performance posts do not:
That is the right emphasis and it is why this piece spends more space on the arithmetic than on the headline. But the headline needs one correction first, because it is the kind that travels.
The two numbers are two machines
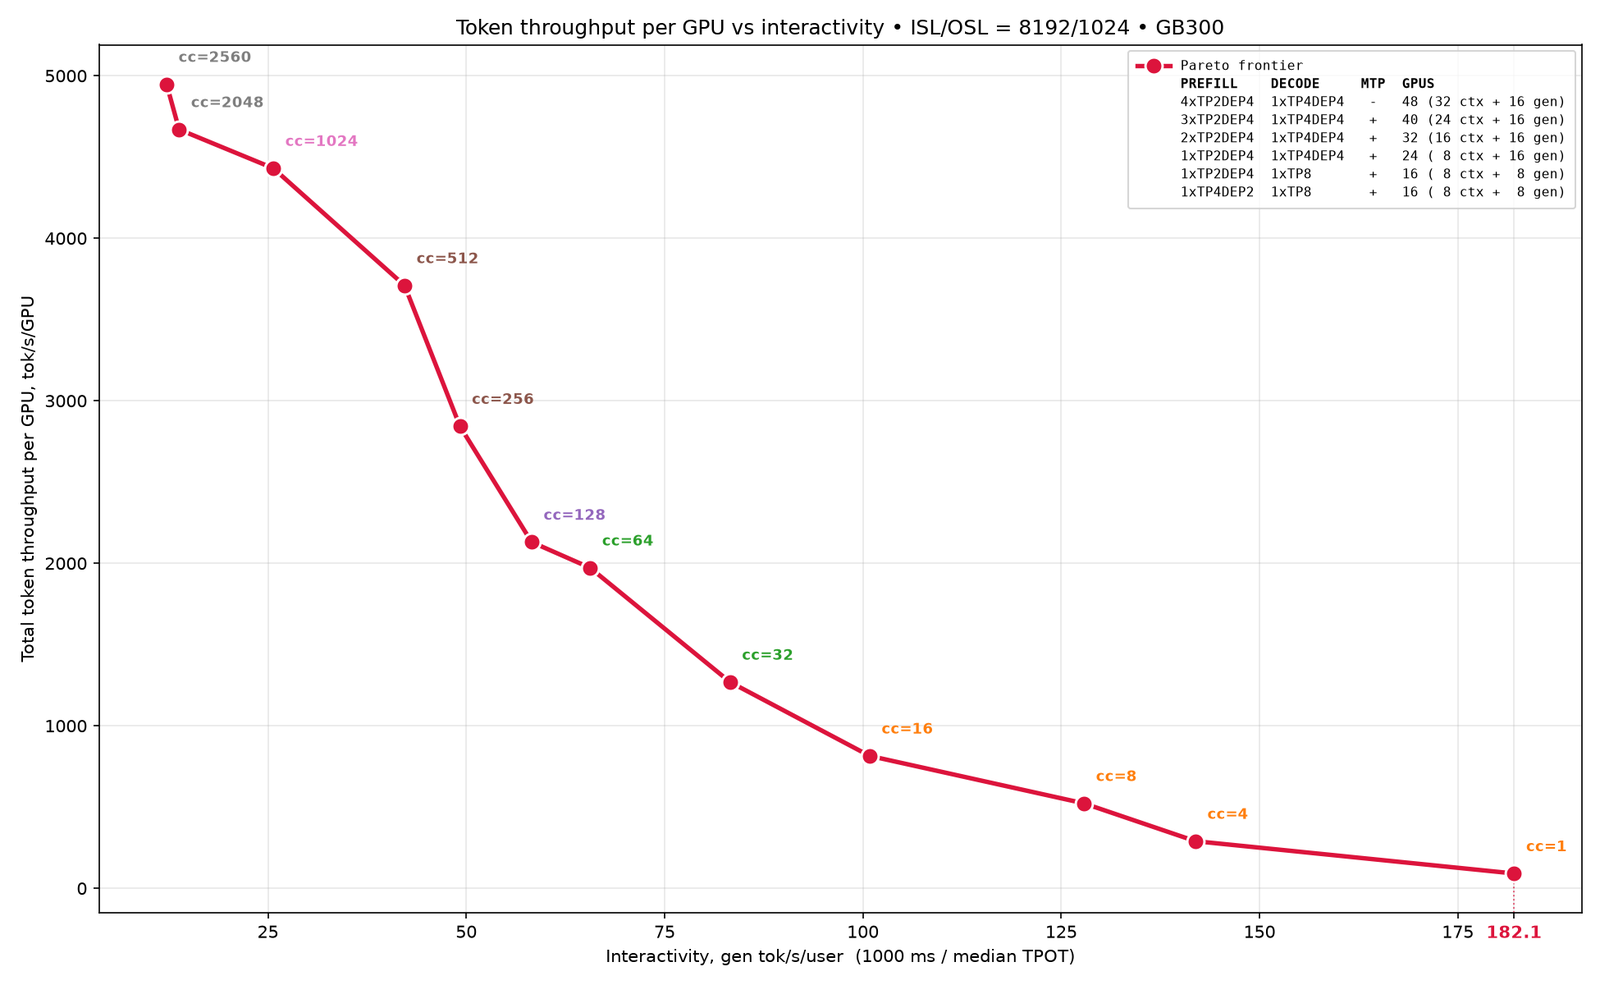
Read the legend against the curve and the two headline points resolve:
They differ in GPU count, in both topologies, and in whether speculative decoding is on at all. No configuration on this chart delivers both. That is not a criticism — a Pareto frontier is by definition the set of points where you cannot improve one axis without giving up the other, and drawing the whole of it is exactly what the post set out to do. It is a criticism of how the sentence will be quoted.
The second correction is in the units. "Total token throughput" counts input
tokens. At 8,192 in and 1,024 out, generated tokens are 11.1% of the total, so
5,000 total tok/s/GPU is about 556 generated tok/s/GPU — the ratio
(8192 + 1024) / 1024 is exactly 9, so this is the headline divided by nine. If you are sizing a
cluster against an output-token bill, that is the number you want, and it is a
ninth of the one in the headline.
One arithmetic check worth doing, because it exposes what the x axis is: 48 GPUs
× 556 generated tok/s/GPU over 2,560 concurrent users is 10.4 tok/s/user,
while the chart's axis reads about 13.5. The axis is defined as 1000 ms / median TPOT — the rate while a request is decoding — so the gap is the time requests
spend queued rather than generating. Interactivity as plotted is a
better-than-end-to-end figure, which is the honest way to plot it and worth
knowing when you compare against a number computed the naive way.
The method, which is the actual artifact
The post's structure is a recipe, and it generalises. Six steps.
1 · Price one request's KV cache
For a hybrid model this is two accountings, not one, and getting that wrong is how you end up with a concurrency estimate that is off by a factor.
Qwen3.8-2.4T is 92 layers: 69 gated DeltaNet and 23 full attention, with an MoE block in every layer. Full-attention state is per token: 4 KV heads × head dim 256 × 1 byte × 2 for K and V = 2 KiB per token per layer. GDN state is per request and fixed: a 4 MiB recurrent matrix plus 120 KiB of convolution history, per layer, whatever the context length.
2 · Notice that the block size falls out of the ratio
This is the step I had not seen written down before and it is the best thing in the post.
One GDN state is 2,108 full-attention tokens. A vLLM block has to be big enough to
hold either, so the block becomes align(2108, 16) = 2112 tokens — and now the
attention layers are paged at 2,112 tokens too. vLLM's usual block is 16.
132× coarser, because of layers that do not use blocks in the same sense
at all.
The consequences are immediate and both are costs:
- A 9,216-token request needs 4.36 blocks per attention layer and takes 5. That is 10,560 slots for 9,216 tokens, so 12.7% of the full-attention allocation is never written.
- 37.5% of a request's 759 MiB is GDN state, which a 200-token request pays in full. Short requests are disproportionately expensive on this model.
And one operational trap the post flags: "prefill and decode compute their block sizes independently, but KV cache transfer requires both to match." Two engines that disagree about the block size cannot hand a cache between them.
I recomputed the whole thing from the published geometry and it lands on 759 MiB exactly — 115 full-attention blocks plus 69 GDN blocks, 184 × 4.125 MiB. That is the number the post's concurrency column divides by, and it is checkable, which is the useful property.
3 · Work down the memory ladder
Every row here is measured at server startup rather than assumed, which is the discipline worth copying:
| GB300, per engine | GiB |
|---|---|
| Physical | 279 GB → 276.62 GiB after 2.28 GiB of driver overhead |
gpu_memory_utilization = 0.92 | × 0.92 = 254.5 |
| CUDA context (uncontrollable) | − 3.13 |
| NCCL buffers, allocator, non-PyTorch | − 2.90 |
| Before weights | 248.5 |
| Weights, TP8 | − 169.28 → 83.00 GiB of KV → 112 requests |
| Weights, TP4DP4 | − 108.71 → 133.74 GiB of KV → 180 requests |
That table is the whole argument for TP4DP4 on decode in one line. The weights are the same 1,333 GiB of model either way; what changes is how much of it each engine has to hold. Sharding wider frees KV, and KV is concurrency, and concurrency is throughput.
The post's own summary of it: "in every case we measured, the memory spent on everything that is neither weights nor KV cache comes to ~20 GiB, about 7% of the total memory available."
4 · Measure the CUDA-graph estimate, because it is charged to your cache
The sharpest finding in the post, and it is a vLLM bug report dressed as a methodology note.
vLLM cannot capture every CUDA graph before it knows how much memory they need, so
it estimates: measure the largest graph, assume every subsequent graph adds the same
delta, pre-claim N × delta. The published table shows that estimate missing
in both directions — 54% of the reservation never used in one run, and −24%
in another, meaning the graphs used more than was reserved and only the
gpu_memory_utilization headroom prevented an OOM.
The part that costs you: "memory space left for KV cache is driven by CUDA graph estimate, not by what graphs actually use in runtime." Over-reserving by 1.89 GiB is 2.5 requests of concurrency thrown away by a heuristic. It is a modest tax — 1 to 3 requests out of 112 or 180 — but it is a tax on the exact resource the whole exercise is trying to maximise, and the post says plainly that the mechanism "deserves further study and improvement."
5 · Benchmark prefill and decode as separate workloads
This is the step that makes the search tractable. Rather than sweeping PD configurations directly — prefill topology × decode topology × endpoint ratio × concurrency — measure each phase alone:
- Prefill alone: aggregated serving at ISL/OSL 8192/2, over nine topologies
(
TP4DP2+EP,TP2DP4+EP,TP4DP4+EP,TP2DP8+EP,DP16+EP,TP1PP6+EP,TP1PP8+EP,TP8+EP,TP16+EP). Result:TP4DP2+EPwins at low concurrency,TP2DP4+EPtakes over as it rises. - Decode alone: aggregated serving at ISL/OSL 1/1000, over four topologies plus MTP with 3 speculative tokens.
Two forced workloads that barely exist in production, chosen precisely because each isolates one phase. The winners then become the candidate set for the real sweep, which cuts the search space by roughly the product of the two topology lists.
6 · Watch where speculation stops paying
The decode sweep contains the most transferable result in the post, and it is not in the conclusion.
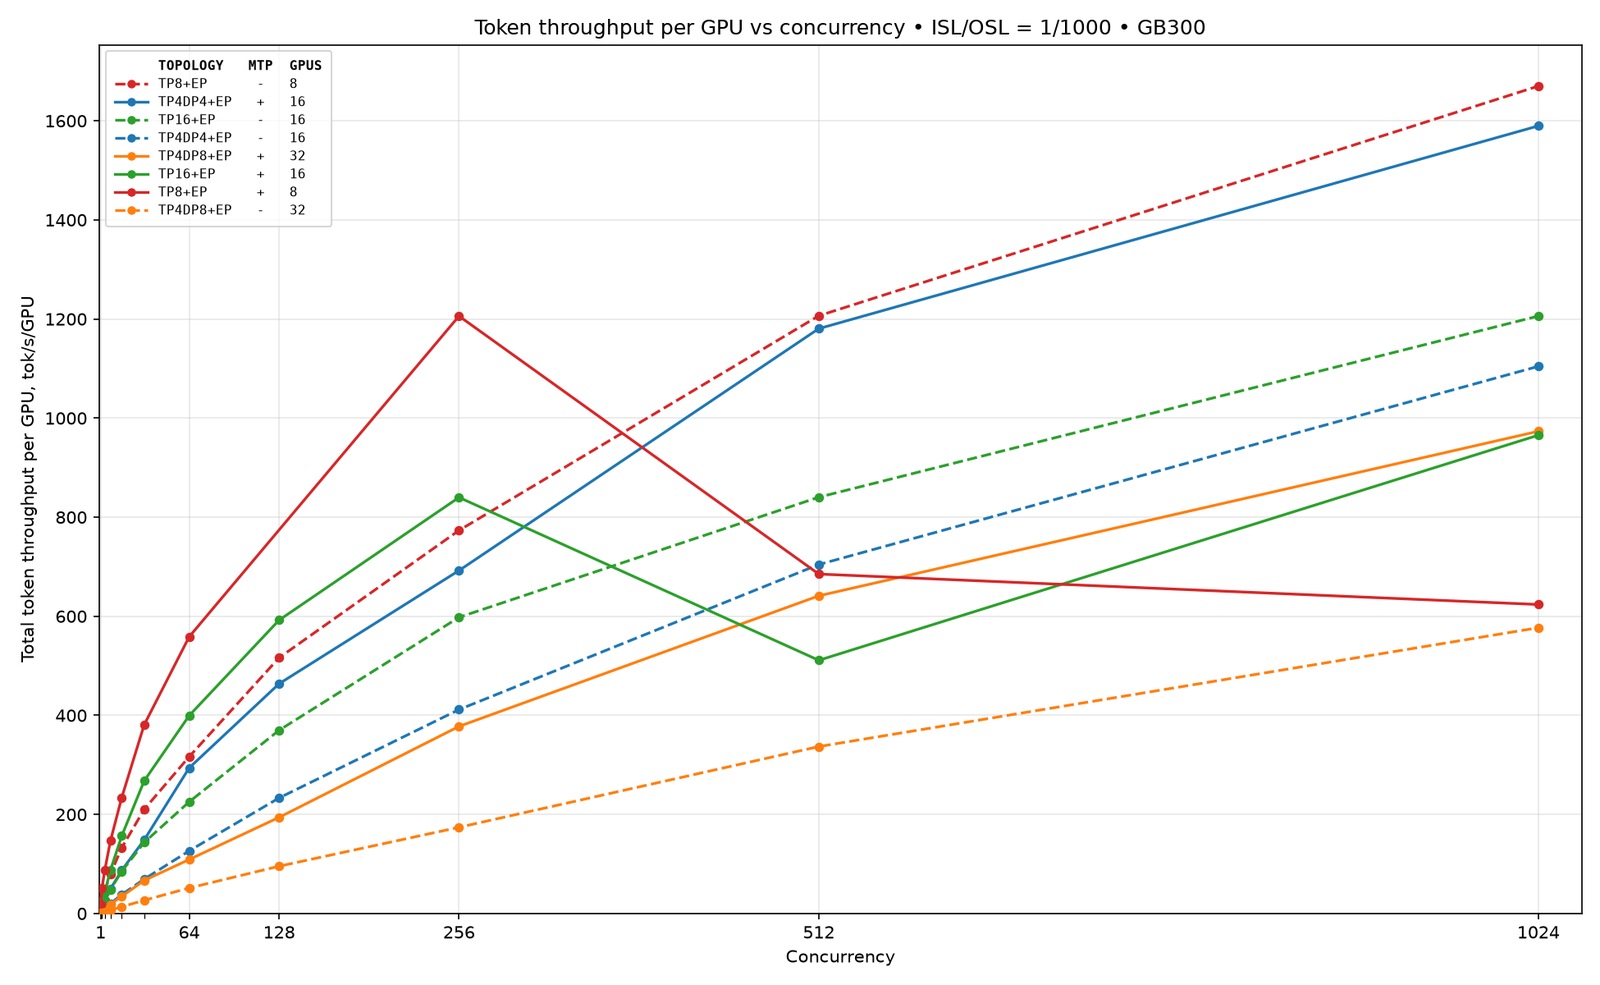
Same eight GPUs, same topology, MTP the only difference. Up to concurrency 256 MTP is worth 1.6 to 1.8×, and the post's summary is right that it "drastically improves performance." Two doublings later the same flag costs 62% of throughput.
The mechanism is stated in a parenthesis under the concurrency table: the reqs-per-engine column "deliberately ignores the extra KV slots MTP reserves for speculative tokens, so for MTP rows treat it as an upper bound." Speculative decoding buys per-user latency with memory — every in-flight request holds slots for tokens that may be rejected. While the cache is not the binding constraint, those slots are free. Once it is, they are concurrency, and concurrency is what throughput was made of.
This is the mirror image of cinference's 450
tok/s, where a ten-token draft window on a
max_concurrency 1 server is a pure 6× win. Same technique, one request
versus a thousand, opposite sign. Speculative decoding is not a throughput
optimization that also helps latency; it is a latency optimization that costs
memory, and whether that is free depends entirely on the number this post spends
five sections computing.
What the post does and does not establish
Accuracy: GSM8K, 95% for every PD configuration. That is a smoke test — it confirms a disaggregated deployment is not silently corrupting the KV handoff. It is not an equivalence check against aggregated serving, and GSM8K at 95% has no resolution left to give one.
Workload: one shape, 8,192 in / 1,024 out, which the post calls "long-ISL, decode-bound". Move to 1K in / 4K out and the prefill endpoints shrink, MTP's turnover moves, and the frontier is a different curve. The method survives; the recipes do not.
Reproducibility: the strongest part. vllm/vllm-openai:nightly-a9a17
(vllm-project/vllm at
v0.26.1rc1.dev1177+ga9a17e709), Dynamo 1.2.0.dev20260526, srt-slurm v1.0.98,
AIPerf v0.12.0, and the recipes published in srt-slurm-recipes. Every memory
number in the concurrency table is something the server prints at startup, which
means you can check the arithmetic on your own hardware without reproducing the
cluster.
What I would take away
- A frontier is a menu, not a machine. When two numbers come from one chart, find out how many GPUs each needed. Here it is 48 and 16.
- Ask what "total tokens" totals. At 8K/1K, seven eighths of the headline is
prompt. The conversion factor is
OSL / (ISL + OSL)and it should appear next to any throughput figure quoted in total tokens. - On a hybrid model, price the linear layers first. They set the block size, they take a fixed share of every request regardless of length, and on Qwen3.8-2.4T that share is 37.5%. The same architecture is why a 27B sibling holds 256K on a consumer card and why 4-bit KV only touches a quarter of its layers.
- Speculative decoding has a concurrency at which it reverses. Find yours before you ship it as a default. The turnover is not gradual: 1,205 to 685 in one doubling.
- Measure phases separately, then combine. Nine prefill topologies and four decode topologies is 36 combinations; two isolating workloads reduce it to a handful of candidates. This is the reusable idea and the post is right to lead with it.
Related reading: vLLM read from the source; what prefill and decode actually cost; SGLang's 4-bit KV cache on the same Qwen3.8 family; cinference at concurrency one; and continuous batching on one small box, which is this question at 1/1000th the scale.
What would change my mind
6 claims above, and what would falsify each
The 5,000 tok/s/GPU point and the 180 tok/s/user point are different deployments on different numbers of GPUs.
The legend of the post's Figure 4 lists six configurations along the frontier with their GPU counts. The leftmost, at cc=2560, is
4xTP2DEP4prefill with1xTP4DEP4decode on 48 GPUs and no MTP; the rightmost, at cc=1, is1xTP4DEP2with1xTP8on 16 GPUs with MTP. I read those off the rendered legend rather than from a table in the prose, so if the legend rows do not map to the points in the order I have assumed — left-to-right down the list — the pairing is wrong even though the general claim (the frontier spans several deployments) is not.One request costs 759 MiB, of which 37.5% is GDN state that does not depend on context length.
Recompute:
ceil(9216/2112) = 5blocks in each of 23 full-attention layers, one block in each of 69 GDN layers, 184 blocks of 4.125 MiB. I get 474.375 + 284.625 = 759.000 MiB, matching the post exactly, which is why I trust the reading of its inputs. If vLLM allocates GDN state outside the block pool on some path, or packs more than one request's state per block, the split changes. Start a server and read the reported KV cache size against the concurrency it admits.'Total token throughput' counts prompt tokens, so 5,000 tok/s/GPU is about 556 generated tok/s/GPU.
At ISL/OSL 8192/1024 the output share is
1024/9216 = 11.1%. The cross-check is that 48 GPUs × 556 over 2,560 users gives 10.4 tok/s/user, within reach of the chart's ~13.5 once you account for the axis being1000/median TPOTrather than an end-to-end average. If "total" in vLLM's harness means generated tokens only, both my conversion and that cross-check are wrong, and the naive division would have to land near 182 at the other end instead, which it does not.MTP reverses above concurrency ~400 on TP8+EP, costing 62% of throughput at 1,024.
Read off Figure 2: the MTP-on TP8 series peaks near 1,205 at cc=256 and lands near 625 at cc=1,024, against ~1,665 without. My values are read off a rendered chart to the nearest 5 tok/s/GPU, so the digits are soft. The shape is not — two of the three MTP series turn over and the no-MTP series do not, and the post gives the mechanism. If a rerun at a larger
--kv-cachebudget removes the turnover, the cause is the reserved speculative slots and my framing holds; if it persists with plenty of cache free, the cause is something else and I have the mechanism wrong.The CUDA-graph reservation costs 1 to 3 requests of concurrency.
The post's table gives "Never Used" per run, from 0.32 GiB to 1.89 GiB; divided by 759 MiB that is 0.43 to 2.55 requests. This assumes the freed memory would all go to KV, which it would, since KV takes what is left. It also ignores the two runs where the estimate was under, which cost nothing and risk an OOM instead. If the allocator rounds the KV pool to a block multiple large enough to swallow 1.89 GiB — 4.125 MiB blocks, so it does not — the effect would vanish.
The GDN state forces a 2,112-token block, 132x vLLM's usual 16.
4216 KiB / 2 KiB = 2108, aligned to 16 gives 2,112, and2112 / 16 = 132. This follows from vLLM requiring one block to hold either state, which the post states. If a later vLLM version sizes hybrid blocks per layer type — there is no reason in principle it cannot — the rounding waste and the block-size mismatch between prefill and decode both disappear, and this section becomes a description of one release rather than of hybrid serving.
Read from the vLLM post of 21 September 2026 and the four figures published with it. The per-request block arithmetic, the memory ladder and the total-versus- generated conversion are recomputed here from the post's stated inputs; the chart values are read off rendered figures. I have no GB300 and ran nothing.