2026-06-28 · 9 min · inference · kv-cache
Why read this
Solidtop 85%Prefill vs decode from arithmetic intensity, with widgets computed from real model shapes and a rule for telling which phase is slowing you down.
- Evergreen reference
- Something most practitioners use
- Concrete numbers to act on
Inference & servingNothing to runIntro guide
How this was scored
- Is it new?
- 0 of 3: Repackaging or news of a known thing
- Can I trust it?
- 1 of 3: Spot-checks a few numbers
- Can I run it?
- 0 of 3: Closed, nothing to run
- Will I understand it?
- 2 of 3: Mechanism from first principles with figures
- Can I act on it?
- 2 of 3: A concrete recipe, numbers or comparison
- Will it last?
- 3 of 3: Evergreen fundamentals
- Does it affect many?
- 3 of 3: Something most practitioners touch
- Only here?
- 1 of 3: Some original analysis
Score 50 of 100, ranked 340 of 445 rated articles. Each question is answered 0–3 by hand, and a 3 is rare. How articles are scored
When a model feels slow in production, the first question I ask is which phase is
slow. Because a single generate() call isn't one workload — it's two, with opposite
bottlenecks running on the same GPU:
- prefill processes the prompt and is compute-bound,
- decode generates tokens one at a time and is memory-bound.
Almost every inference optimization you'll read about targets one of these two phases. So before reaching for a fix, you have to know which one is hurting. Here's the whole pipeline, and where the time actually goes.
Prefill runs the whole prompt through every layer in parallel — a big matrix-matrix multiply that saturates the GPU’s math units. Its latency is Time To First Token (TTFT), and it leaves behind the KV cache.
From text to vectors
Before either phase, the text becomes numbers. A tokenizer — usually byte-pair encoding
(BPE) — splits the string into integer IDs from a vocabulary of roughly 50,000 entries.
Each ID indexes a row of the embedding table, a learned [vocab_size, hidden_dim]
matrix, so for hidden_dim = 4096 every token becomes a 4096-dimensional vector.
Position is injected here. Modern models use rotary position embeddings (RoPE), which encode position by rotating each query/key vector by an angle proportional to its index, rather than adding a separate positional vector. It's cheap and it's what lets the same weights generalize across lengths.
Inside a layer
The embedded sequence flows through a stack of transformer layers — 32 for a 7B, 80+ for the big ones. Each layer is two operations:
- Self-attention projects every token into a query
Q, keyK, and valueV. Each token's query is scored against every token's key; scale, softmax, and the scores become weights that mix the values. This is the only place information moves between positions. - Feed-forward network (FFN) — a two-layer MLP applied to each token independently. Attention routes information across positions; the FFN transforms it in place.
After the last layer, the final position's hidden state is projected back to vocabulary size, softmaxed, and sampled — that's one output token. How that projection-and-sample gets driven is exactly what differs between the two phases.
Prefill: compute-bound
Prefill processes the entire prompt at once. Q, K, V are computed for every prompt
token in parallel, and attention is a big matrix-matrix multiply. That's dense
arithmetic, and it saturates the GPU's math units — utilization runs near 100%. The
metric that captures this phase is Time To First Token (TTFT): how long before the
first output appears.
Prefill also populates the KV cache — the K and V tensors for every layer get
written to GPU memory so they never have to be recomputed. That cache is what makes the
next phase cheap, and also what makes it expensive.
Decode: memory-bound
Once the first token exists, generation switches to one token per step. For each new
token the model computes Q, K, V for that token only; the keys and values for
everything before it are already cached. So the attention is one query vector against a
cached key matrix — a matrix-vector multiply, almost no arithmetic.
And yet decode is the slow part per token, because the GPU still has to stream every weight matrix and the entire KV cache out of memory to do that tiny computation. The bottleneck flips from arithmetic to memory bandwidth. The metric here is Inter-Token Latency (ITL) — the gap between consecutive tokens, which is what makes a stream feel fast or sluggish. GPU utilization during decode can sit at 30% on a fully loaded server, because the math units are starved waiting on memory.
| prefill | decode | |
|---|---|---|
| Work | whole prompt, parallel | one token at a time |
| Attention shape | matrix × matrix | matrix × vector |
| Bottleneck | compute (arithmetic) | memory bandwidth |
| Metric | TTFT | ITL |
| GPU util | ~95% | ~30% |
| Optimize by | more FLOPs, better kernels | smaller cache, faster memory, batching |
That table asserts the flip; one ratio proves it. Arithmetic intensity is how many FLOPs a piece of work performs per byte it pulls out of memory, and every GPU has a matching ratio of its own — its ridge point, peak FLOP/s divided by peak bandwidth. Work above the ridge keeps the math units fed. Work below it leaves them idle while the memory bus runs flat out. Here is where each phase lands for a 7B model in fp16:
A decode step reads all 13.5 GB of weights to do 14 GFLOP of arithmetic — about one FLOP per byte, against an A100's ridge of 153. The math units get one part in a hundred and fifty of what they could do, which is the "~30% utilization" row of the table seen from the other side. Prefill on a 2k prompt does the same weight read but 2,048 tokens' worth of work with it, and lands three orders of magnitude further right.
Two things fall out of that picture that the table can't show. Batching moves decode along the axis rather than across it — 32 requests share one weight read, so intensity rises to about 10 and never reaches the ridge, which is exactly why continuous batching multiplies throughput and leaves per-token latency alone. And a short enough prefill isn't compute-bound either: 128 tokens is not enough work to amortize one pass over the weights, so it sits left of the ridge with decode.
The KV cache runs the economics
The cache is the single most important object in LLM serving. Prefill writes one entry per prompt token in a single pass; then each decode step appends exactly one entry and reuses everything already there, recomputing nothing. Watch it accumulate — bright is written this step, faded is reused:
Prefill writes N entries in one pass; each decode step adds exactly one and recomputes nothing. The cache — and the memory it costs — grows linearly with the sequence, which is why long contexts crowd out batch size.
That reuse is the whole point. Without the cache, generating a 1000-token response would re-attend over the whole growing sequence every step — quadratic work. With it, each step does constant new work — linear. Toggle it and watch the per-step cost, then drag the context length to see what the cache costs in memory:
With the cache, each step appends one token’s K/V and does O(1) new attention work — generation is linear in length. That’s the ~5× (and more, for long outputs) speedup over recomputing.
The cache grows linearly with context and per layer, so long contexts get expensive fast — and every gigabyte spent on cache is a gigabyte not spent on batch size. Cache directly trades against concurrency, which is why the field quantizes it (INT8/INT4), windows it, shares it (GQA), and pages it (PagedAttention).
The trade is brutal and unavoidable: the cache grows linearly with sequence length, per layer. For a 13B model it's roughly 1 MB per token, so a 4K context is ~4 GB of VRAM spent on cache alone — before a single weight. And that memory competes directly with batch size: every gigabyte on cache is a gigabyte not serving another request. Long contexts are expensive not because of compute, but because they evict concurrency.
The standard mitigations all attack the cache from different angles:
- Quantize it to INT8 or INT4 (it's just tensors).
- Sliding-window attention — drop tokens outside a fixed window.
- Grouped-query attention (GQA) — share
K/Vacross attention heads so there are fewer cached tensors. (This is exactly the change iLLaDA and most modern models make.) - PagedAttention — the trick behind vLLM: page the cache in fixed-size blocks like an OS pages virtual memory, killing fragmentation and packing in more concurrent requests.
Redesigning attention around the cache
The deeper move is to make the cache structurally smaller from the start, by changing attention itself. DeepSeek's V4 series does this with a hybrid of two compressed mechanisms: Compressed Sparse Attention (compress KV ~4× with softmax-gated pooling, then attend sparsely) and Heavily Compressed Attention (consolidate KV across 128 tokens into one entry, attend densely over those). At a 1M-token context, V4-Pro needs about 27% of the single-token inference FLOPs and 10% of the KV cache of its predecessor — in absolute terms, ~9.62 GiB of cache per sequence in bf16 versus an estimated ~83.9 GiB for the older design, and fp4/fp8 halves it again. (I went deeper on V4's drafter in the DSpark write-up.) The cache has become the constraint the architecture is being designed around.
Quantization
Training needs FP32/BF16 for gradient stability. Inference doesn't. Dropping bit-width saves memory linearly, and quality barely moves. Pick a size and precision:
The savings are linear in bit-width, and inference quality barely moves: INT8 typically costs nothing and roughly halves latency, while INT4 lands within 1–2 points of full precision using per-channel scaling (GPTQ, AWQ). That’s why quantization is usually the highest-leverage single change for a deployment — and why a 7B model at INT4 (3.5 GB) fits where its FP16 form (14 GB) wouldn’t.
INT4 is the reason a 7B model runs on a 4–6 GB laptop GPU at all. Methods like GPTQ and AWQ use per-channel scaling to keep the lossy compression within 1–2 points of full precision on standard benchmarks. And going FP16 → INT8 often roughly halves latency with negligible quality loss — which makes quantization the highest-leverage single change for most deployments.
The serving layer
On top of the prefill/decode loop sits the infrastructure that makes a GPU economical:
- Continuous batching interleaves tokens from many requests on the same GPU step. This is the big one: decode leaves most of the arithmetic idle, so you fill that idle capacity with other requests' tokens. It's why one GPU serves dozens of users at once.
- Speculative decoding drafts several tokens with a cheap model and verifies them in one pass of the big model — turning sequential decode steps into one parallel verification when acceptance is high. (Two whole articles' worth: DSpark and multi-token prediction.)
- PagedAttention for the cache memory, as above.
Frameworks like vLLM, TensorRT-LLM, and TGI combine all of this. The throughput they get comes mostly from the fact that decode is memory-bound, so there's spare arithmetic lying around for batching to soak up.
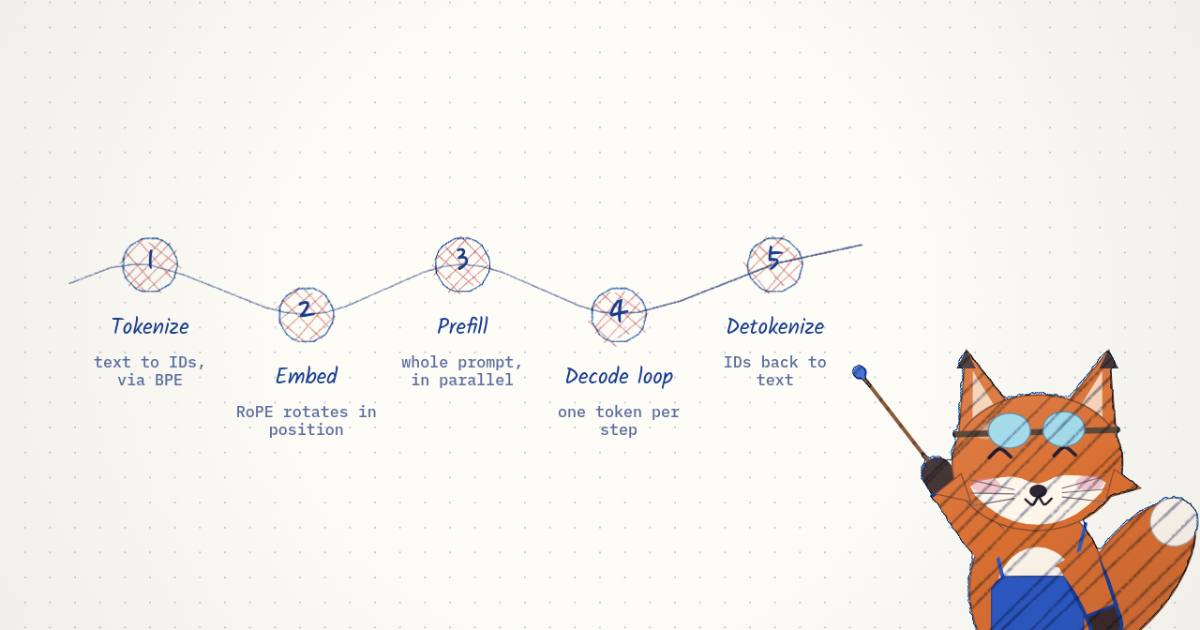
The full path
- Tokenize — text → integer IDs via BPE.
- Embed — IDs → vectors; RoPE rotates in position.
- Prefill — all prompt tokens through every layer in parallel; compute-bound; KV cache populated; first token emitted (TTFT).
- Decode loop — one token per step: project
Q, attend over cachedK/V, run FFN, sample, append to cache; memory-bound (ITL). - Detokenize — IDs → text, streamed out.
How to actually use this
The whole point of splitting it this way is diagnosis. Which phase owns the clock is not a property of the model — it's a property of the request shape, and it swings hard:
128-token prompt, 512-token answer
2k-token prompt, 512-token answer
8k-token prompt, 128-token answer
Only the long-prompt row has a TTFT a reader would notice, and it is the one row where prompt caching or chunked prefill pays.
The other two are decode almost end to end. More FLOPs does nothing there; a smaller cache, faster memory or bigger batches is the whole menu.
A chat turn is decode almost end to end; a long-document extraction is nearly half prefill. Same weights, same GPU, opposite fixes. So when something is slow:
- Slow to start → you're prefill-bound. Long prompts dominate TTFT; optimize the prompt path (caching, chunked prefill, more compute).
- Slow to stream → you're decode-bound. Long outputs dominate ITL; the fix is not more compute — it's a smaller cache, faster memory, or better batching.
- Context length is never free. It bloats the KV cache and directly cuts how many requests fit on the GPU, so it shows up as reduced throughput long before it shows up as an out-of-memory error.
That last instinct is the one I'd internalize: during decode the arithmetic units are mostly idle, so when a decode-bound server is slow, throwing a bigger compute budget at it does nothing. The bottleneck is the memory bus. Optimize the thing that's actually full.