2026-10-06 · 18 min · kernels · gpu · systems · inference-optimization · attention · open-source · explainer
Everyone who optimizes models knows this loop. A paper lands with a new attention variant. To make it fast you write a fused kernel. You spend a week on indexing, shared-memory staging and pipeline depth, you finally get it correct and fast, and then someone asks for it on an AMD card, or a customer wants it on a domestic NPU, and you start over.
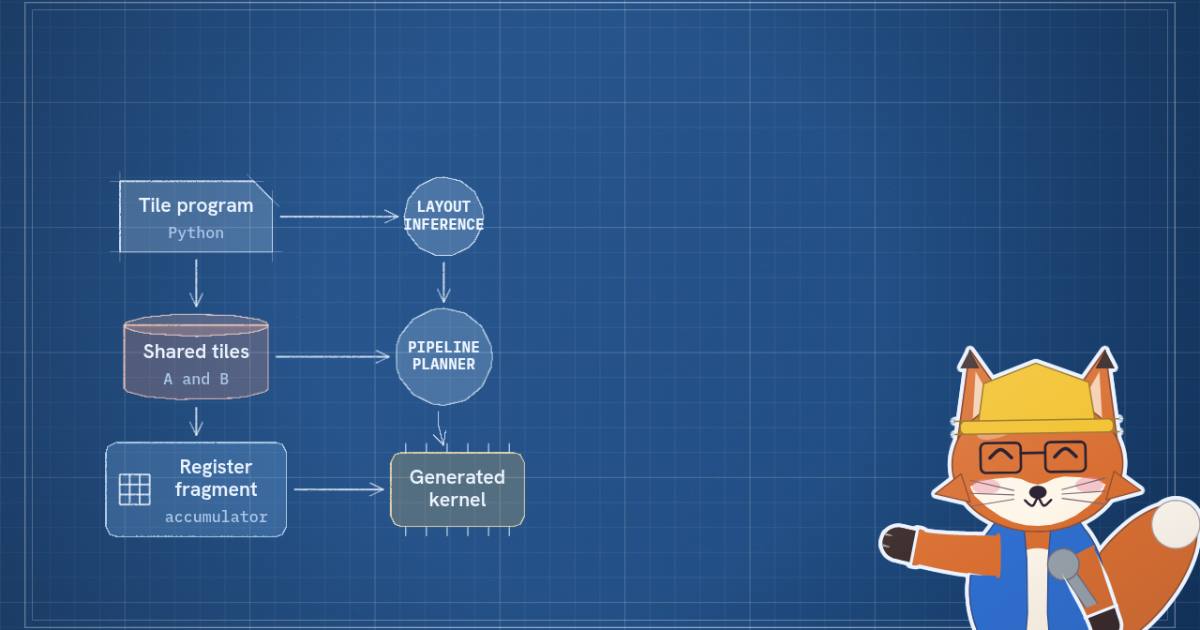
TileLang is an attempt to make that work reusable. It is a small language embedded in Python, built on TVM, in which you describe a kernel at the granularity of tiles — this tile of A goes to shared memory, that accumulator lives in registers, this loop is pipelined three deep — and the compiler handles the rest: layout, thread binding, vectorization, swizzling, synchronization, and the instruction selection that turns your T.gemm into WGMMA or MFMA or an Ascend Cube instruction.
I cloned the repo (commit 0e687c1, version 0.1.15, 1,973 tracked files — measured), read the examples and the two compiler passes that do the interesting work, and checked the paper's claims against the code. I have no GPU here, so nothing below is a kernel I ran; every performance number is the publisher's and is labelled as such.
- license
- MIT
- branch
- main
- tests
- 537 files
- source
- 19.6 MB
- commit date
- 2026-10-05
by size of tracked source at this commit, file counts in brackets; docs, data and vendored trees excluded
local clone, 2026-10-06 at 0e687c1 — branch, commit, commitDate, fileCount, hasTests, languages, license, licenseFile, shallow, testFileCount
shallow clone: counts describe the pinned tree, not the history
Why a fused attention kernel is hard to write by hand
Start from the hardware, because that is where the difficulty comes from.
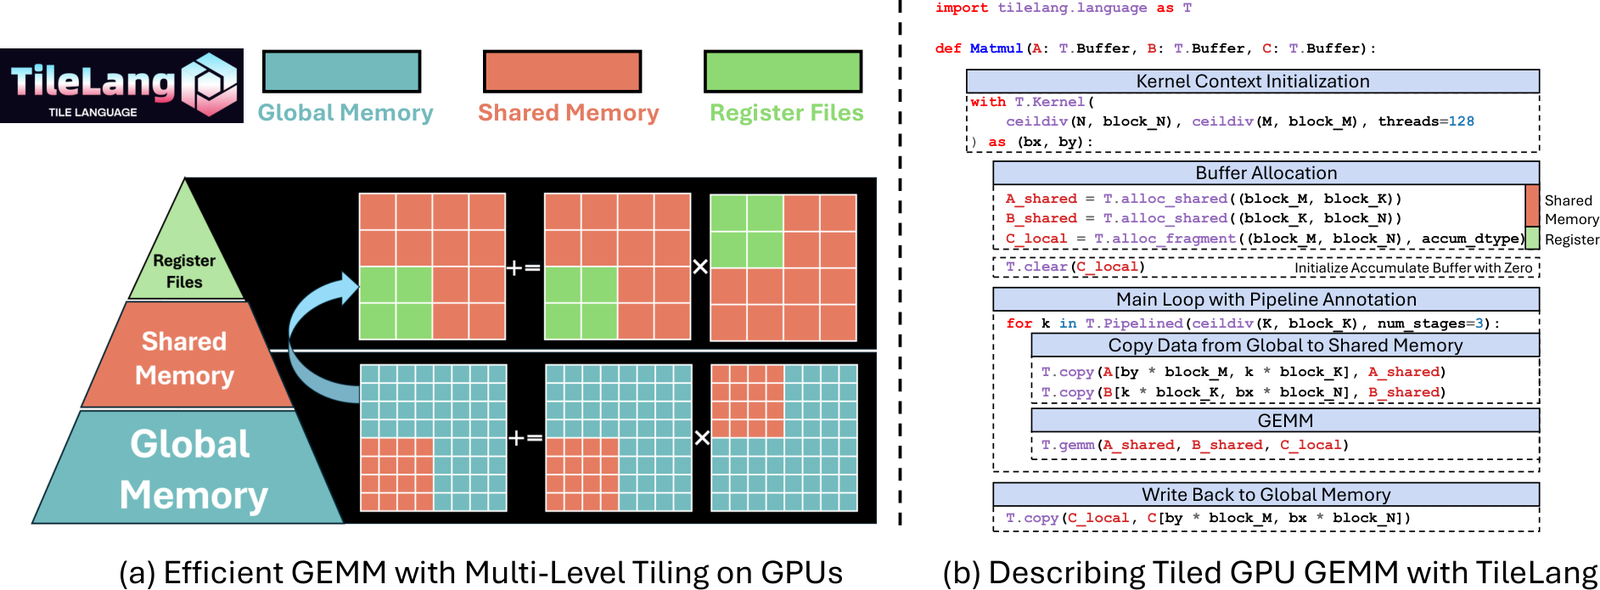
A GPU gives you three places to put a number, and they differ by orders of magnitude in both size and latency: global memory (HBM, tens of gigabytes, hundreds of cycles away), shared memory (SRAM on the SM, a couple of hundred kilobytes at most, tens of cycles), and registers (fast, tiny, privately owned by one thread). A fast kernel is mostly a plan for moving tiles between those three levels so the tensor cores never wait. The paper's Figure 3 draws exactly that pyramid next to the TileLang program that expresses it:
Writing that by hand in CUDA means doing five separate jobs at once:
- Staging. Copy a tile of A and a tile of B from global into shared memory, with enough buffers in flight that the copy for iteration
k+1is already running while iterationkcomputes. On Ampere that iscp.asyncwithcommitandwaitgroups; on Hopper it is the TMA unit andmbarrierarrive/wait. - Warp specialization. On Hopper the fast kernels split the thread block into producer warps that only issue TMA loads and consumer warps that only issue
wgmma.mma_async. Now you own a hand-written producer-consumer protocol inside a kernel. - Swizzling. Shared memory has 32 banks. A naive row-major tile makes 32 threads hit the same bank and serializes the access, so you XOR the column index with a function of the row to scatter it. Get the swizzle wrong and the kernel is correct and three times too slow.
- Fragment layouts. A tensor-core instruction does not read a matrix; it reads a very specific distribution of elements across the 32 lanes of a warp. Every operand you produce has to land in registers in exactly the layout the instruction expects.
- Vectorization and thread binding. Which thread copies which bytes, and in loads of what width, so the accesses coalesce.
None of that is your algorithm. All of it has to be redone when the block size changes, the dtype changes, or the vendor changes.
The tile program
Here is the GEMM from examples/gemm/example_gemm.py, verbatim. The whole kernel is 22 lines (measured, lines 5-26 of that file):
@tilelang.jit
def matmul(A, B, block_M, block_N, block_K, dtype=T.float16, accum_dtype=T.float32):
    M, N, K = T.const("M, N, K")

    A: T.Tensor((M, K), dtype)
    B: T.Tensor((K, N), dtype)
    C = T.empty((M, N), dtype)

    with T.Kernel(T.ceildiv(N, block_N), T.ceildiv(M, block_M), threads=128) as (bx, by):
        A_shared = T.alloc_shared((block_M, block_K), dtype)
        B_shared = T.alloc_shared((block_K, block_N), dtype)
        C_local = T.alloc_fragment((block_M, block_N), accum_dtype)

        T.clear(C_local)
        for k in T.Pipelined(T.ceildiv(K, block_K), num_stages=3):
            T.copy(A[by * block_M, k * block_K], A_shared)
            T.copy(B[k * block_K, bx * block_N], B_shared)
            T.gemm(A_shared, B_shared, C_local)

        T.copy(C_local, C[by * block_M, bx * block_N])

    return C
Five constructs carry the whole model.
T.Kernel(gridX, gridY, threads=…) opens the execution context and hands back the block indices. T.alloc_shared puts a buffer in shared memory; T.alloc_fragment puts one in the register file. Both are declared at block level — C_local is a 128x128 FP32 accumulator owned by the thread block, not by a thread, and how it is split across the 128 threads is the compiler's problem, not yours. T.copy moves a region between levels. T.gemm is a tile-level matrix multiply that the backend lowers to CUTLASS/CuTe, hand-written HIP, or an NPU Cube instruction. T.Pipelined(n, num_stages=3) says: overlap the copies with the compute, three deep.
That is the whole trick. The dataflow is explicit and the schedule is annotation.
What a tile costs, exactly
The compiler infers a great deal, but it cannot shrink your tile. num_stages multiplies the shared-memory footprint directly, because the pipeline pass versions each staged buffer. The arithmetic is simple enough to do in your head and important enough that getting it wrong is a compile error on one GPU and a silent occupancy collapse on another:
where is bytes per element (2 for FP16). For the example's defaults — block_M=128, block_N=128, block_K=32, num_stages=3 — that is 16 KB per stage and 48 KB in total (reasoned). The accumulator is separate and lives in registers: 128 x 128 x 4 bytes = 64 KB per block, which across 128 threads is 128 32-bit registers per thread, exactly half the 255 a CUDA thread may hold (reasoned, against the limit NVIDIA's compute-capability table reports).
The ceiling depends on the chip. NVIDIA's tuning guides give the per-thread-block maximum as 227 KB on H100 (of 228 KB per SM), 163 KB on A100 (of 164 KB), and 99 KB on Ada and so on an RTX 4090 (of 100 KB) — CUDA reserves 1 KB per block in each case. AMD's CDNA3 compute unit has 64 KB of LDS. All reported.
A_shared = T.alloc_shared((128, 32), T.float16)   # 8 KB
B_shared = T.alloc_shared((32, 128), T.float16)   # 8 KB
C_local  = T.alloc_fragment((128, 128), T.float32) # 64 KB of registers
for k in T.Pipelined(T.ceildiv(K, 32), num_stages=3): # x 3 staged copies- Per stage
- 16 KB
- x 3 stages
- 48 KB
- Accumulator
- 64 KB
- Registers/thread
- 128
Dashed line: the per-thread-block shared-memory maximum each vendor documents. Bar: 16 KB per stage x 3 stages = 48 KB. The accumulator is separate — it lives in registers, and 64 KB across 128 threads is 128 32-bit registers per thread of the 255 a CUDA thread may hold.
The FlashAttention example makes the squeeze concrete. examples/flash_attention/example_mha_fwd_bshd.py runs by default with block_M=128, block_N=128, dim=128 and four shared buffers — Q, K, V and the output staging tile — at 32 KB each: 128 KB of shared memory before you count a single fragment (reasoned, from the declarations in that file). That fits H100 and A100 and does not fit a 4090 or an MI300X, which is why the autotune config list in the same file sweeps block_M=64, block_N=64 instead. The tile size is a portability decision, and it is the one decision TileLang deliberately leaves with you.
Layout inference: why T.gemm wins the argument
The interesting half of the compiler is the pass that decides, for every buffer, how its elements are distributed over threads.
The abstraction is a Layout: an algebraic map from logical indices to memory locations, built from TVM IterVars so that layouts compose and the arithmetic analyzer can bound them. A Fragment is a layout whose output is a pair — which thread holds the element, and where in that thread's private registers it sits. C_local in the GEMM above has no meaning until a Fragment is attached to it.
Inferring those layouts is not a local decision, because operators share buffers and they do not care equally. T.gemm cares enormously: the tensor-core instruction dictates the fragment layout of its accumulator and the swizzle of its shared inputs. An elementwise T.Parallel loop over the same buffer cares not at all. So the pass runs in priority order, and the code says so plainly — src/op/operator.h defines three levels, kFree, kCommon, kStrict, and layout_inference.cc runs strict first, then a breadth-first pass at common, then relaxes to free and re-runs, then propagates layouts across aliased buffers (measured, from the source). Strict operators pin what they need; everything downstream has to agree.
The paper's Figure 8 shows the result on the simplest possible program — a T.copy into shared memory — as it goes from block-level intent to vectorized, thread-bound, swizzled access:
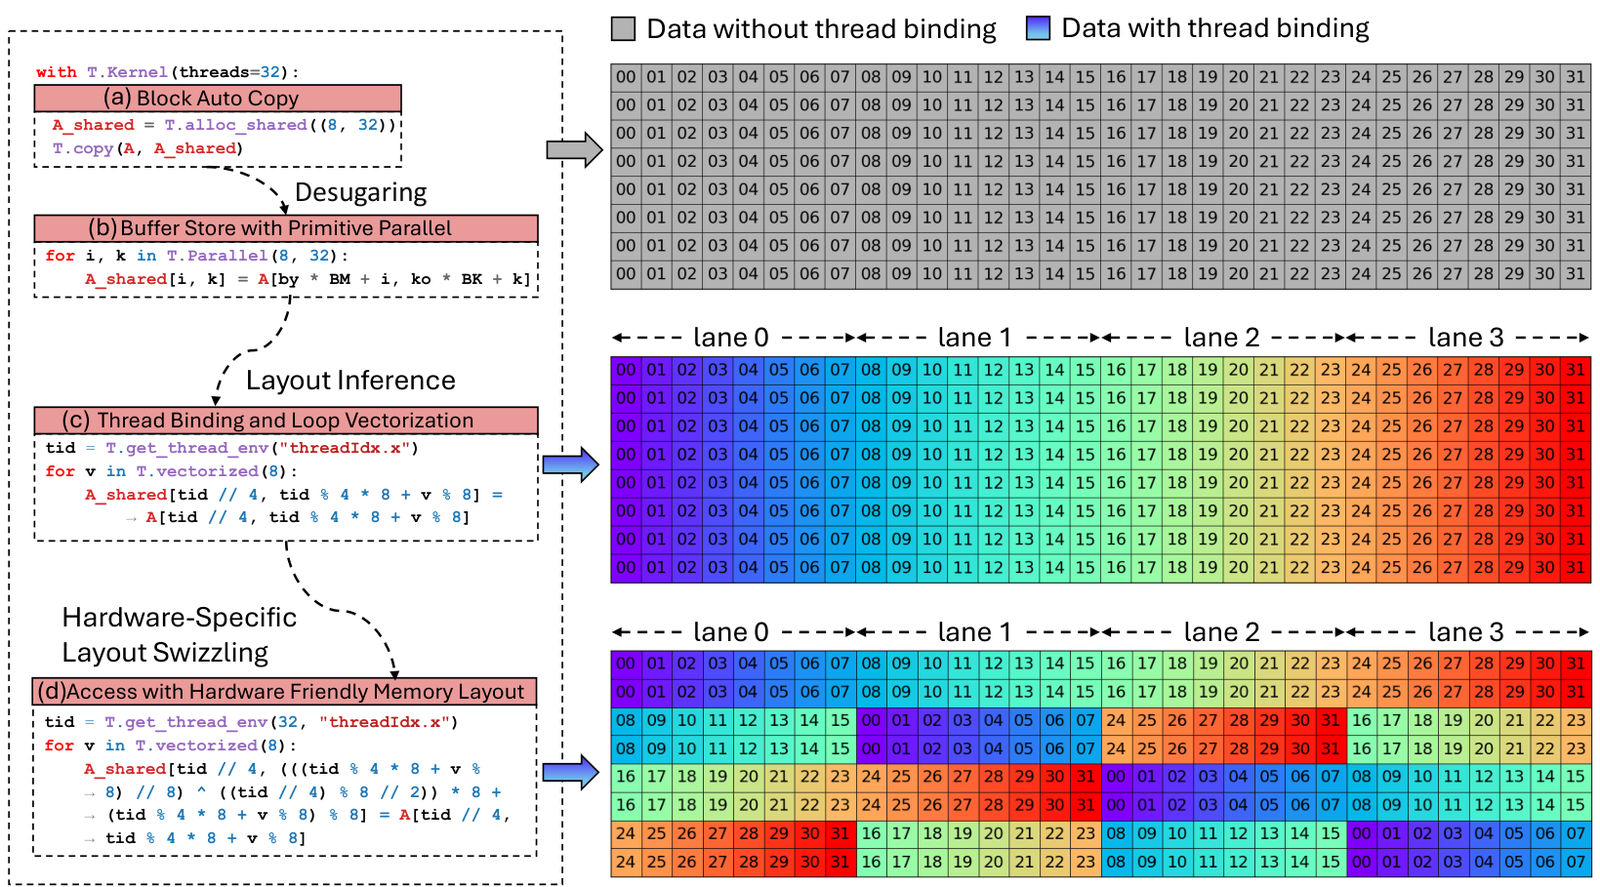
This is the part that is genuinely hard to reproduce by hand, and it is also the part Triton does not let you reach into. Triton gives you block-level primitives and generates the layouts itself; TileLang exposes the layout objects, lets T.annotate_layout override the default, and still infers everything you did not specify. The paper's framing is that this is the point of the project: keep Triton's simplicity, give the expert a door.
Software pipelining, and an honest look at what it skips
num_stages=3 is one integer. Turning it into a schedule is src/transform/pipeline_planning.cc and src/transform/inject_pipeline.cc — 1,374 and 4,051 lines respectively (measured).
The planner reads the loop body as a list of statements, works out which ones are copies and which consume them, and assigns each one an order (position within an iteration) and a stage (how many iterations ahead it runs). Copies go to stage 0; compute goes to the higher stage. Then there is a neat rewrite worth knowing about: if every copy ends up after every compute in the order, the pass rotates the copies to the front of the order and decrements the stage of everything else, which buys the same overlap one buffer cheaper (measured, from the copy_stage_at_end block). The paper's Figure 11 is the same idea in pictures:

Buffer versioning follows from the schedule rather than from the annotation. ComputeBufferVersions in inject_pipeline.cc starts from use - def + 1 as an upper bound and then decrements it when no writer-reader pair actually overlaps in both order and stage with conflicting regions (measured). In other words, asking for three stages does not blindly triple every buffer.
Now the part the README does not advertise. The same planner contains an explicit early-out: on ROCm targets other than gfx950, a loop annotated with num_stages has the annotation stripped and runs as a plain sequential loop. The comment is unusually candid — gfx942, which is MI300X, has async-copy hardware but the software pipeline for it "has not been validated yet", and RDNA has no async copy at all (measured, pipeline_planning.cc). So on the AMD part most people have, the pipelining primitive is currently a no-op. That is a real and specific limit, and it is exactly the kind of thing you only find by reading the pass.
FlashAttention, in tiles
The attention kernel is where the abstraction earns its keep, because the inner loop is not one matrix multiply but two with an online softmax between them. This is the body of example_mha_fwd_bshd.py, lightly trimmed:
for k in T.Pipelined(loop_range, num_stages=num_stages):
    T.copy(K[bz, k * block_N : (k + 1) * block_N, by, :], K_shared)
    T.gemm(Q_shared, K_shared, acc_s, transpose_B=True, policy=T.GemmWarpPolicy.FullRow)

    T.copy(scores_max, scores_max_prev)
    T.fill(scores_max, -T.infinity(accum_dtype))
    T.reduce_max(acc_s, scores_max, dim=1, clear=False)
    for i in T.Parallel(block_M):
        scores_scale[i] = T.exp2(scores_max_prev[i] * scale - scores_max[i] * scale)
    for i, j in T.Parallel(block_M, block_N):
        acc_s[i, j] = T.exp2(acc_s[i, j] * scale - scores_max[i] * scale)
    T.reduce_sum(acc_s, scores_sum, dim=1)
    for i in T.Parallel(block_M):
        logsum[i] = logsum[i] * scores_scale[i] + scores_sum[i]

    for i, j in T.Parallel(block_M, dim):
        acc_o[i, j] *= scores_scale[i]
    T.copy(V[bz, k * block_N : (k + 1) * block_N, by, :], V_shared)
    T.gemm(acc_s_cast, V_shared, acc_o, policy=T.GemmWarpPolicy.FullRow)
Read it as the algorithm and nothing else: score the query block against this key block, track the running row maximum, rescale the accumulator by the ratio between the old and new maxima, accumulate the exponentials, multiply by V. The scale constant folds log2(e) into the softmax so the kernel can use exp2, which maps to a single hardware instruction. There is no cp.async, no mbarrier, no swizzle, no fragment layout, no producer-consumer split in this listing — and on Hopper the generated code has all of them. The one knob that changes the pipeline is num_stages, and v0.1.15 added an opt-in role-based scheduler (TL_ENABLE_AUTO_WARP_SPECIALIZATION: "role_based") that assigns TMA loads, MMA, TMA stores and worker ops to separate warp groups automatically (reported, release notes).
Compare with FlashAttention-3, where that same asynchrony is hand-built in CUTLASS templates. The trade is the usual one: the template library is faster at the shapes it was tuned for and harder to move.
The numbers, and whose they are
All of the following are reported by the paper (arXiv 2504.17577v2, April 2025) on H100 with CUDA 12.4, A100, and MI300X with ROCm 6.1.0. I did not re-run anything.
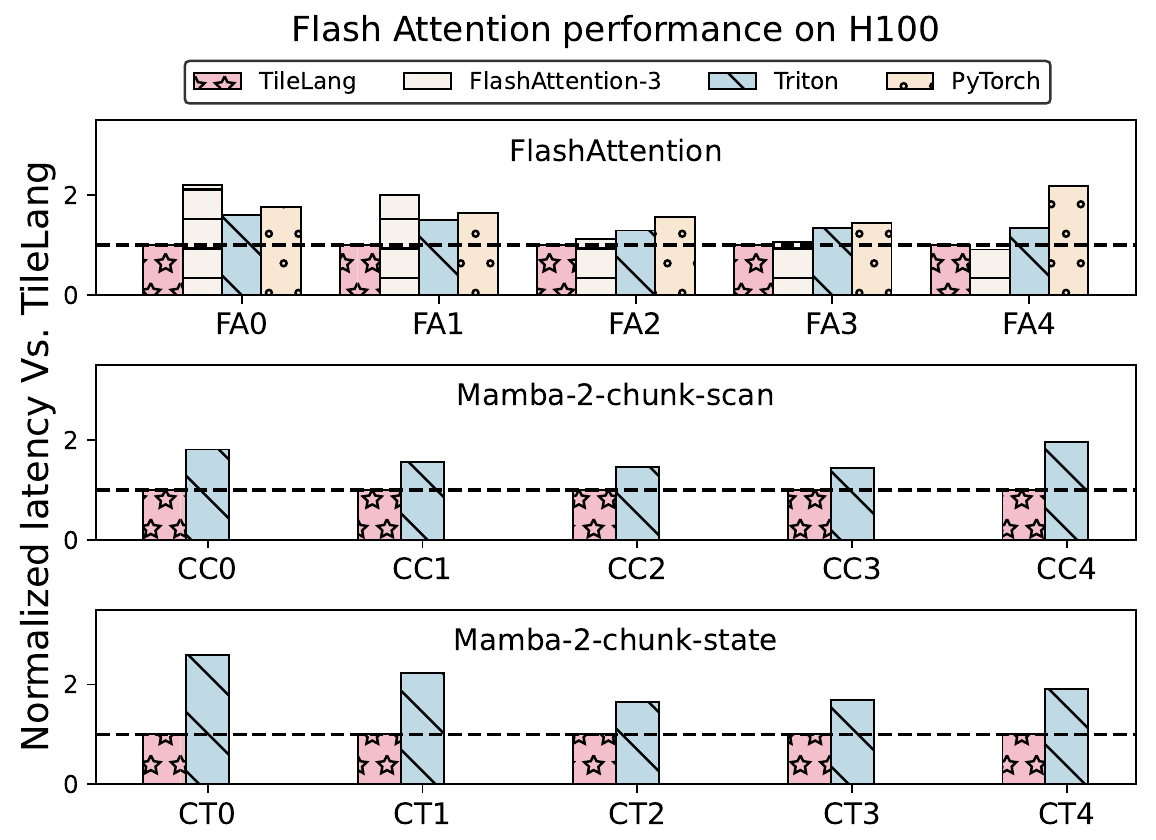
On multi-head attention the paper reports speedups of 1.36x over FlashAttention-3, 1.41x over Triton and 1.70x over PyTorch, with the honest caveat attached: FlashAttention-3's fixed tile sizes hurt it at short sequences, and at 8k the two are close. On the Mamba-2 chunk-scan and chunk-state kernels it reports 1.77x and 2.10x over Triton.
On plain FP16 GEMM, TileLang lands on top of the vendor libraries rather than beating them: 1.10x, 0.97x, 1.00x and 1.04x versus cuBLAS/rocBLAS on RTX 4090, A100, H100 and MI300X, and 1.08x, 1.03x, 1.13x, 1.25x versus Triton on the same four. Matching cuBLAS from a 22-line Python kernel is the claim, not beating it.
The headline is multi-head latent attention, plotted against lines of code:
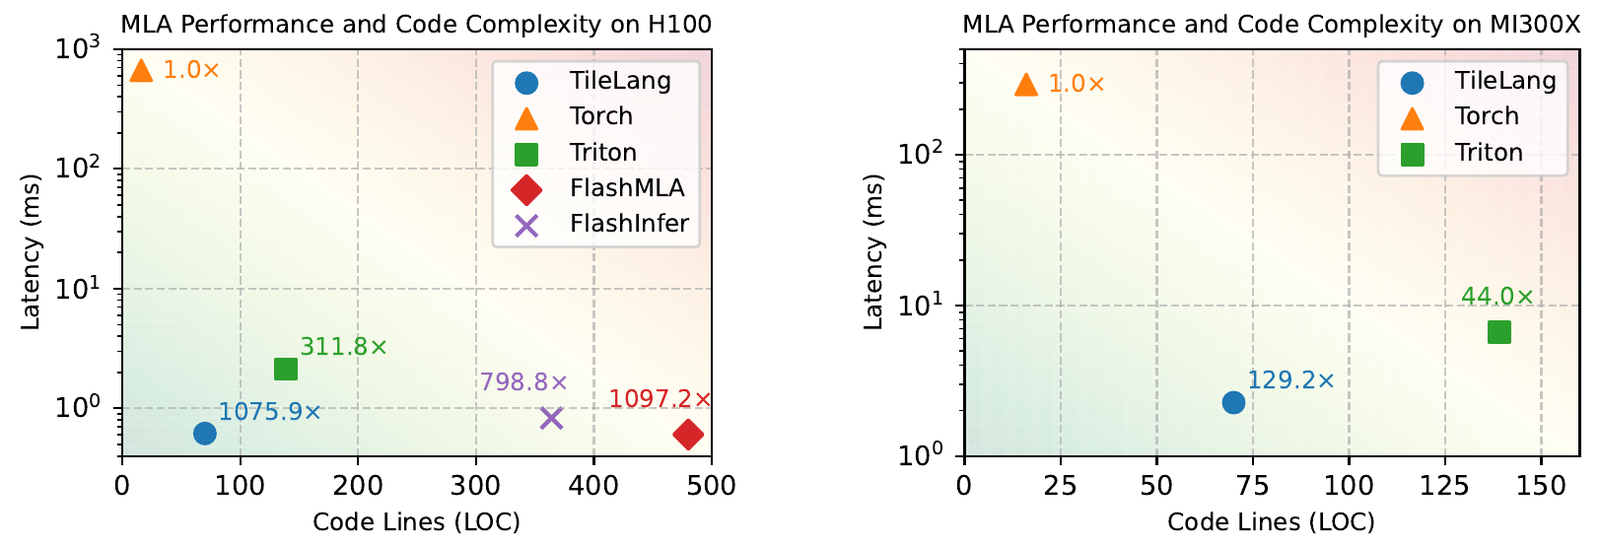
1075.9x over Torch on H100 in about 70 lines of Python, reaching 98% of hand-written FlashMLA (480 lines); on MI300X, 129.2x over Torch and 95% of AITER. Torch at 1.0x is an unfused reference, so the four-digit number is a statement about fusion, not about TileLang versus a serious baseline — the comparisons that matter are the 98% and the 95%. For dequantized GEMM the paper reports a maximum 7.65x over cuBLAS FP16 (at INT2 weights with INT8 activations), 1.04x average over Marlin at INT4 weights with FP16 activations, and 1.62x over BitsandBytes at NF4.
Two caveats on all of it. The paper is from April 2025 and the repo is now at v0.1.15, so neither the TileLang numbers nor the baselines are current. And the shapes are listed in the appendix (batch 1, 32 heads, head dim 128, sequence 512 to 4096 for attention) — narrow enough that "state of the art" means "on these shapes".
Triton, CuTe, and where this sits
Against Triton, the paper's argument is specific rather than rhetorical: Triton hides thread behaviour, memory layout and address-space annotations behind generated strategies, which is fine until you want a quantized GEMM that needs inline PTX for vectorized dtype conversion and a custom shared-memory layout. Triton exposes num_stages but not the pipeline itself. TileLang exposes both, plus T.annotate_layout and T.ptx.
Against CuTe the relationship is stranger, because TileLang both uses it and routes around it. The default T.gemm lowers through CUTLASS/CuTe templates, which is how new hardware instructions get supported quickly. The cost is measured in the paper with NVCC 12.8's trace tool: template expansion is roughly 90% of compile time for the CUDA that TileLang generates (reported). So the project also supports implementing instructions in TileLang itself, which avoids the layout opacity and the compile time but means reimplementing an instruction set per target. Both paths ship; the template path is the default. CuTe DSL is meanwhile also a TileLang backend (target="cutedsl", experimental).
Multi-backend, and the Ascend 950 release
The thing the X post was reacting to is v0.1.15, released 30 September 2026, whose headline is a native Huawei Ascend 950 backend: a target ascend with its own dialect, native code generation, automatic Cube/Vector scheduling, pipelining and multi-buffering, and — the line that matters for anyone who has written Ascend C — automatic synchronization. The backend README's division of labour is blunt about it: under "Synchronization" the column for what you write says "None (Just write operations in order!)", while the compiler infers Cube/Vector dependencies and inserts paired set/wait flags (reported).
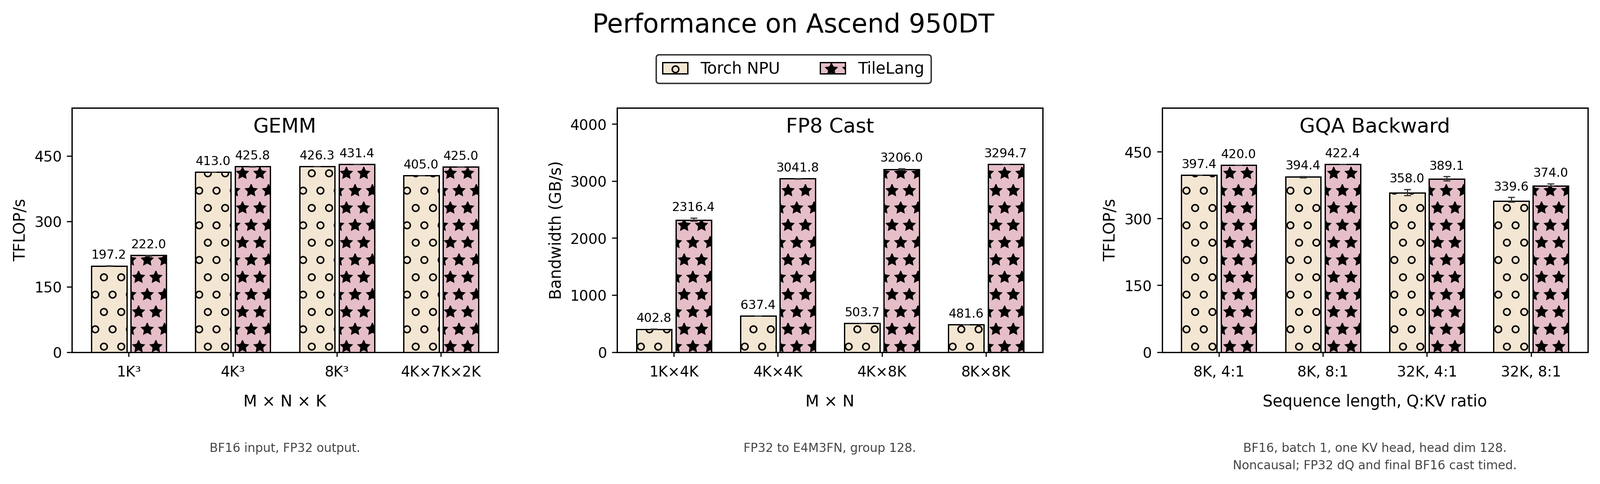
The pattern there is worth naming. On compute-bound GEMM the two are close (425.8 against 413.0 TFLOP/s at 4K cubed; 431.4 against 426.3 at 8K cubed), and on GQA backward too (420.0 against 397.4 TFLOP/s). The gap opens on the memory-bound FP8 cast, where TileLang reports 3041.8 GB/s against Torch NPU's 637.4 at 4K x 4K — a fused, well-pipelined copy against a library op that is not (reported, the README's own chart).
The same release adds the role-based warp specialization above, unified T.gemm_blockscaled semantics across backends, and Python compile-time comprehensions in the frontend. The backend table now runs CUDA (primary), ROCm, Ascend 950 and Metal (supported), LLVM CPU, CuTe DSL and WebGPU (experimental), plus five ecosystem adapters maintained in separate repos. That breadth is the project's real bet, and it is the same bet DeepSeek made when it ported its own kernels in DeepGEMM-Ascend — except TileLang is trying to make the port a backend rather than a rewrite.
What it costs
A few things to know before you adopt it.
The licence is MIT with an unusual addendum: the file states that from 1 December 2024 to 14 March 2025 the project was subject to additional collaboration terms with Microsoft. GitHub's licence detector therefore reports it as "Other" rather than MIT (measured, via the GitHub API today). It is almost certainly fine; it is also not a plain MIT badge, and if your legal review greps for one, it will not find it.
The project moves fast and the surface is wide: 8,434 stars, 853 forks and 438 open issues today (measured, GitHub API, 6 October 2026, up from the 7,900 stars and 370 open issues quoted in the post that prompted this). A monthly release cadence that removes legacy APIs — v0.1.13's notes say so explicitly — is a maintenance cost you inherit.
The automation has holes, and they are documented in the source rather than the README: no pipelining on MI300X, T.gemm still leaning on CUTLASS for its default path, and no cost model yet, which the paper lists as future work. There is nothing here that chooses your tile sizes for you; that is what the autotuner brute-forces.
And the thing I like most about it is not in the benchmarks. A language server shipped in August with inlay hints for buffer shapes, dtypes, scopes and inferred layouts. When the compiler is making the decisions, being able to see the decision it made — in the editor, on the line where you allocated the buffer — is the difference between a tool you can debug and a black box you can only benchmark. Related reading on the same theme: CUDA kernels in Rust and the linear attention state roundup, which uses TileLang kernels as its reference points.