2026-10-06 · 22 min · inference · serving · vllm · kv-cache · quantization · mixture-of-experts · long-context · systems
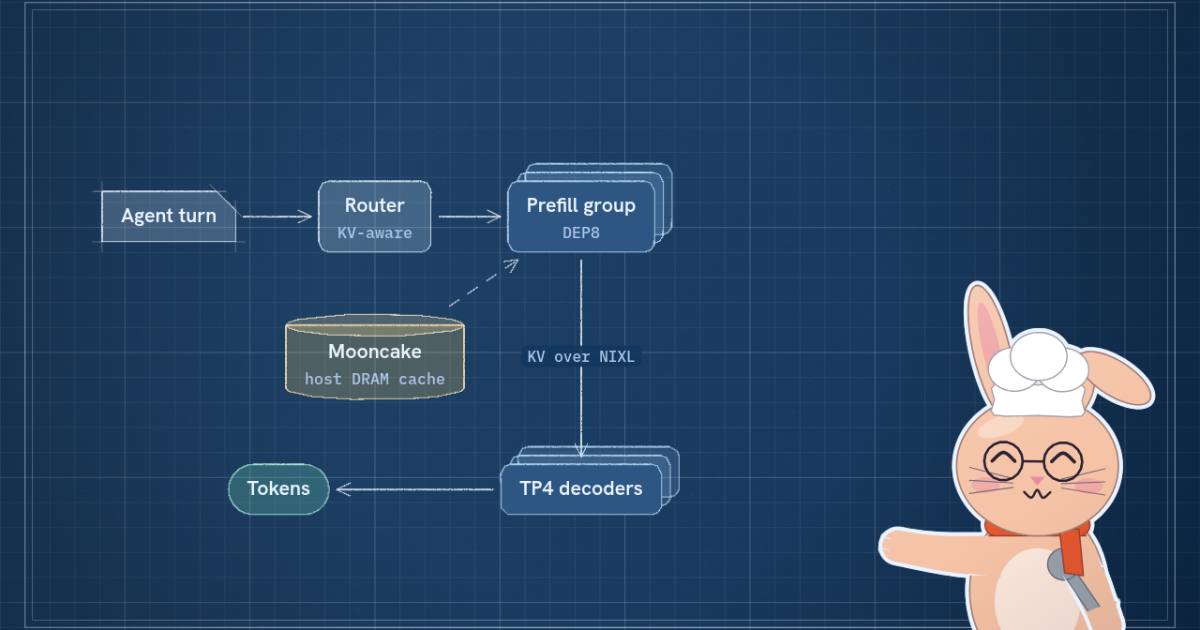
Prime Intellect launched Prime Inference on 2 October with a long technical post about one deployment: GLM-5.3 on GB200 NVL72, run by vLLM under NVIDIA Dynamo, with Mooncake as a host-memory cache tier and FlashInfer kernels. The launch thread compresses it to six claims. I read the post, then held its numbers against the model's own config.json and the vLLM pull requests it leans on.
The sentence that organises the whole post is this one:
Every optimisation in the post is a cache fix: where the cache lives, how many copies exist, how many bytes a row takes, and how many pieces it is cut into when it moves. I take them in the order a request meets them.
Labels: reported is Prime Intellect's figure, not re-run. Measured is something I read out of a file myself. Reasoned is my arithmetic on the other two. I did not run the stack.
The workload
A typical agent turn adds about 6K tokens to a 140K-token prompt (reported). Almost every request is a long prefix the system has seen before plus a short new tail, with cold long prompts mixed in. The benchmark is SemiAnalysis's AgentX, which replays multi-turn agent sessions, plus injected cold arrivals.
Two metrics, defined in the chart's footer:
- E2E tok/s per user is completion tokens divided by the whole request time, queueing and first token included. That is stricter than the usual
1 / TPOT, which only counts time spent decoding. - Output tok/s per GPU is completed output tokens divided by measurement time, divided by every serving GPU, prefill and decode alike.
The target was 100 E2E tok/s per user, and the tuning question was how many concurrent sessions survive at that speed.
Prefill and decode on different GPUs
A decode step for a batch of running sessions is short and memory-bound. A prefill of a 140K-token prompt is long and compute-bound. Put both on the same GPUs and the decode stream stalls whenever a prefill chunk runs. Chunked prefill makes the stalls shorter but more frequent; it does not remove them.
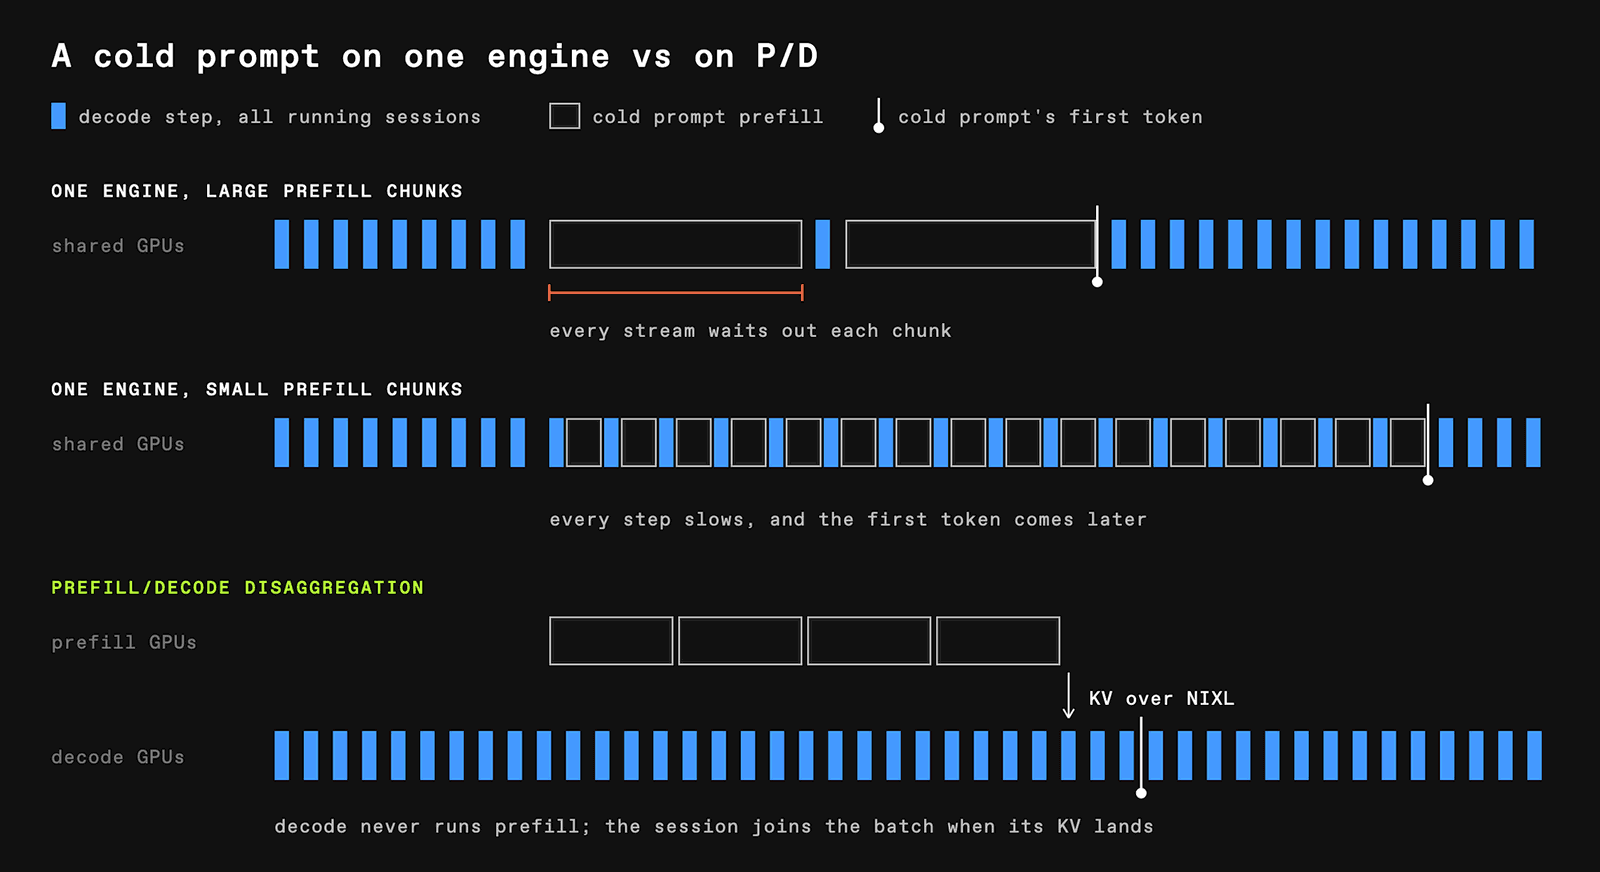
So prefill and decode get separate GPU groups. Dynamo routes and orchestrates; vLLM runs the model in each group; when a prefill finishes, the decoder pulls the computed KV through NIXL and adds the request to its batch. The post reports that this cut p90 inter-token latency by nearly 40% in their tests (reported). The vLLM and SGLang pieces cover the general mechanism; vLLM's Qwen3.8 recipe is the closest sibling of this post.
Disaggregation adds a knob, the P/D ratio: how many decode engines each prefill group feeds. Too few decoders and prefill idles; too many and new sessions queue for prefill.
The headline, read carefully
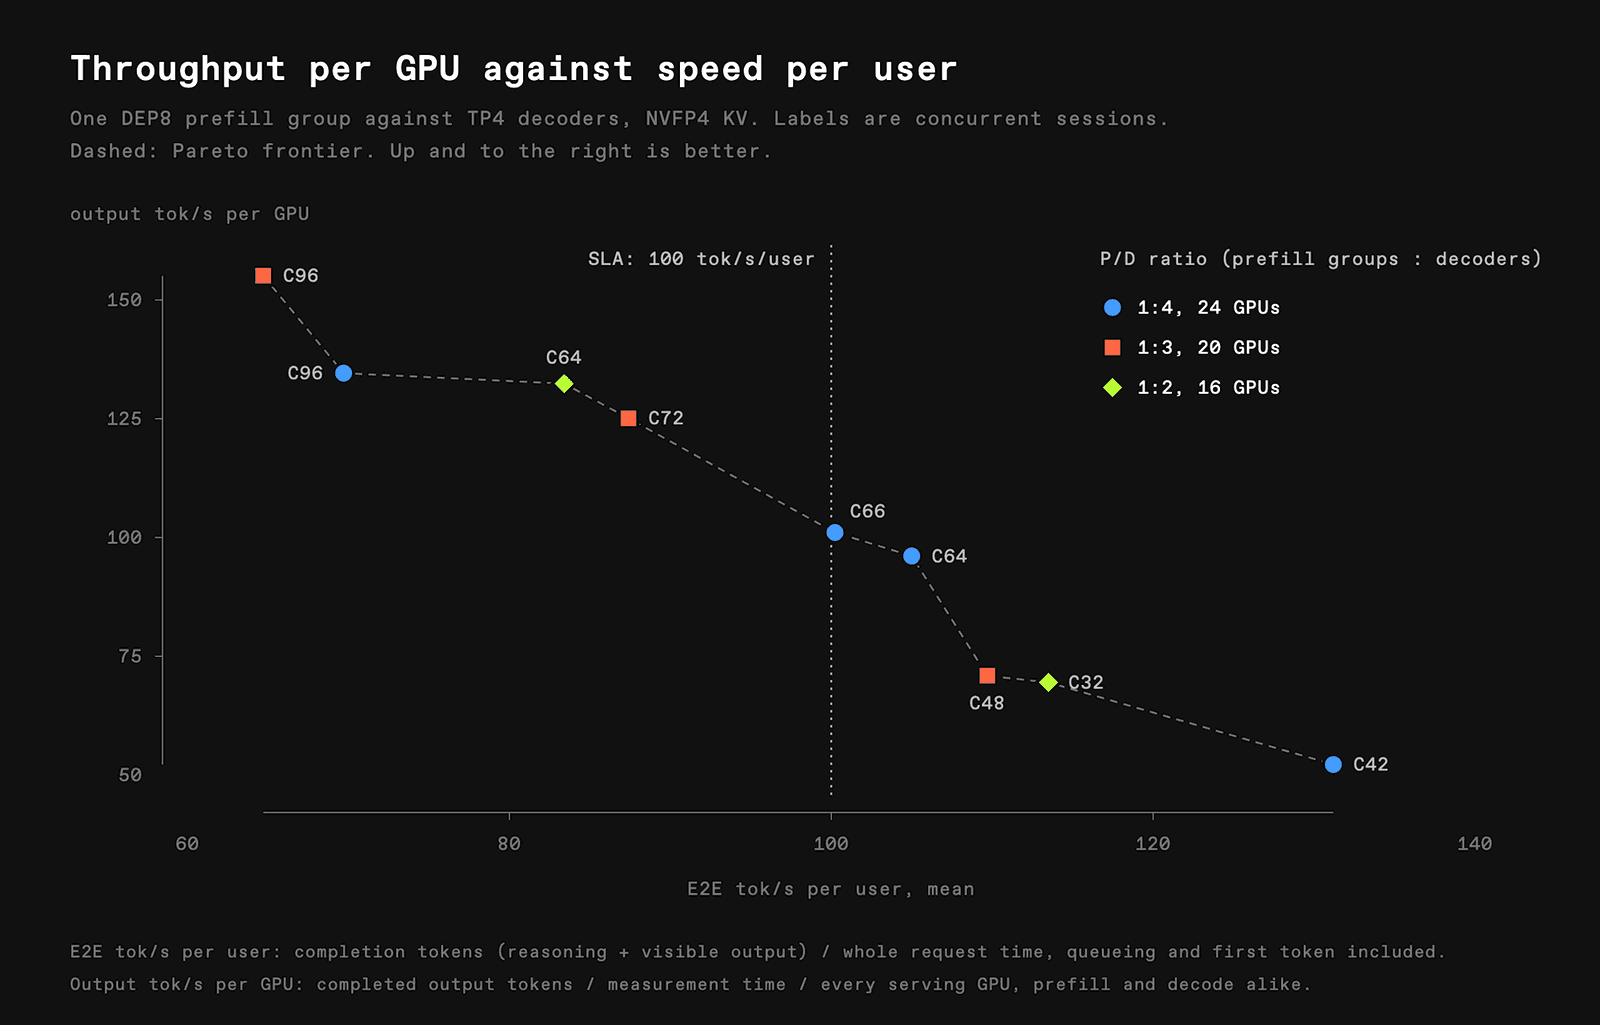
"At the 100 tok/s/user bar, a 1:4 P/D ratio serves the most: 66 sessions per prefill group at 101 tok/s/user and 100 output tok/s per GPU" (reported).
The GPU counts in the legend decode cleanly. One DEP8 prefill group is 8 GPUs, and each TP4 decoder is 4, so 1:4 is 8 + 16 = 24, 1:3 is 8 + 12 = 20, and 1:2 is 8 + 8 = 16 (reasoned). The legend agrees on all three.
Then the two halves of the headline stop agreeing with each other. If 66 sessions each received 101 tokens a second, the deployment would emit 6,666 tokens a second. The per-GPU figure says it emits 100 × 24 = 2,400 (reasoned). The ratio is 0.36.
Both can be true, because the denominators differ. Per-user speed is averaged over the time each request is in flight. Concurrency counts sessions, and an agent session spends part of its life between requests while its tools run. 2,400 ÷ 101 is about 24 requests in flight on average, roughly a third of the 66 sessions (reasoned). The post never says whether AgentX replays inter-turn gaps, so I cannot confirm this; it is the only explanation I can find that fits both numbers. Either way, "66 sessions at 101 tok/s" is not 66 parallel streams, and anyone sizing a deployment should use the 2,400.
For scale: TP4 decode's mean inter-token latency at 64 sessions is 6.08 ms (reported, separate run), about 164 tok/s while decoding (reasoned). The E2E 101 also pays for queueing, retrieval and the first token, which is what the prefill work goes after.
Prefill topology: why DEP8 holds five times the cache
GLM-5.3 uses DeepSeek-style multi-head latent attention. Instead of caching a key and a value per head, each token caches one 512-value latent plus one 64-value rotary key, and all 64 attention heads up-project from that same latent (measured from config.json: kv_lora_rank: 512, qk_rope_head_dim: 64, num_attention_heads: 64). The cache row has no head axis.
Now shard attention with tensor parallelism. TP splits the work by heads: rank 0 gets heads 0-7, rank 1 gets 8-15, and so on. With an ordinary multi-head cache, each rank stores only its own heads' K and V, and the cache shards for free. With MLA, every head needs the whole latent, so every rank stores the whole latent for every request. TP8 keeps eight copies of each request's cache. The post's decode chart lists exactly this as "KV copies per request": TP4 4, TP8 8, DEP8 1.
The alternative is to make attention data-parallel. In DEP8, eight ranks each run full attention for different requests, and only the MoE layers are sharded: 256 routed experts split across the eight ranks, with an all-to-all at every MoE layer to send tokens to their experts (see the mixture-of-experts doc). Each request's cache now lives on one rank. In TEP8, attention is tensor-parallel and experts are expert-parallel.
The ideal capacity ratio is therefore 8x. DEP pays in weight memory: every rank holds all the attention weights, not an eighth. From the config the MLA projections are about 165M parameters per layer, 13B over 78 layers, so roughly 13 GB at FP8 per DEP rank against 1.6 GB under TP8 (reasoned). After that the post reports roughly five times more usable prefix-cache capacity for DEP8 over TEP8 (reported). Without the per-GPU memory budget I cannot close the gap from 8 to 5, but the direction and size are what MLA predicts.
DEP's cost is synchronisation, and the post measures it:
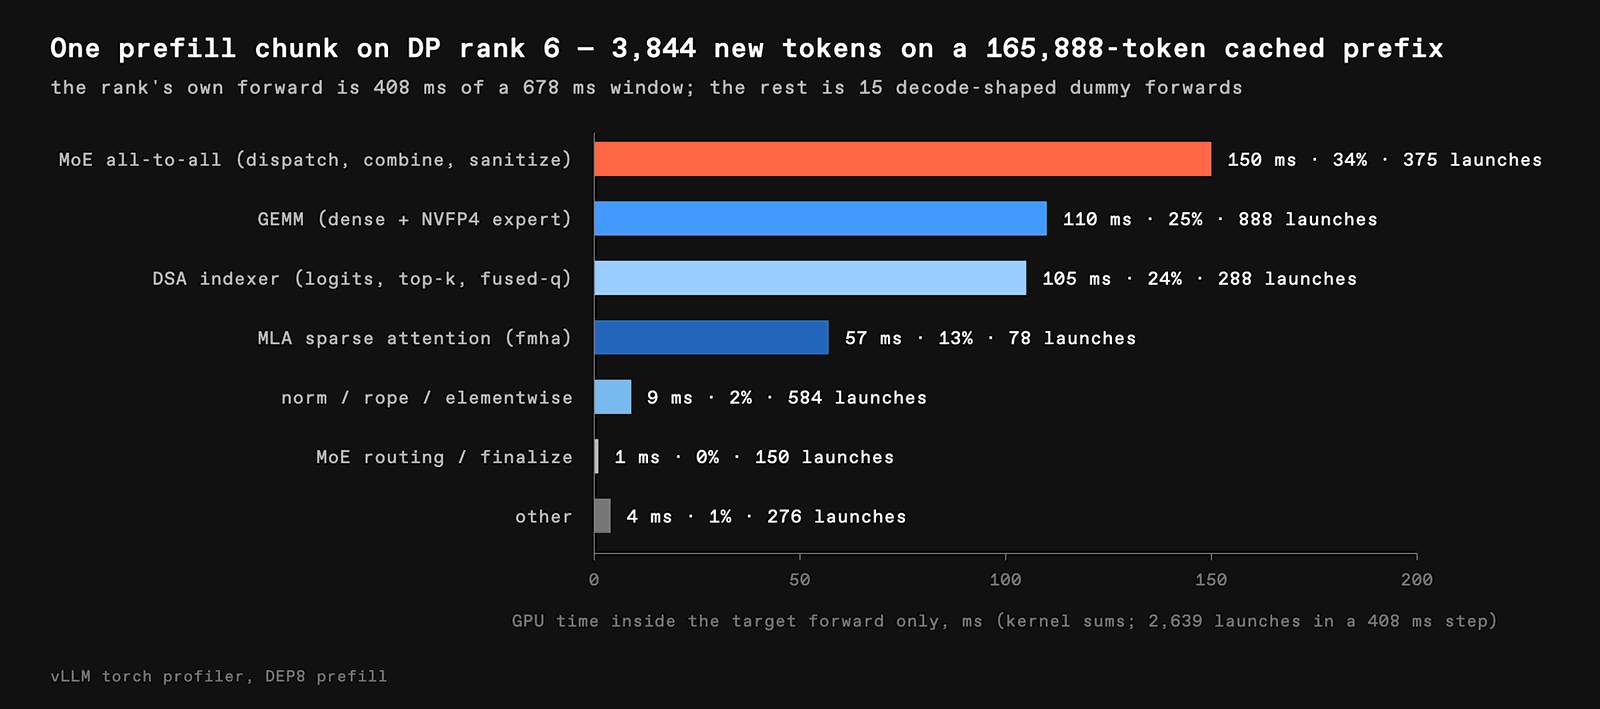
Every DP rank joins the same all-to-all at every MoE layer, so an idle rank still runs forwards to keep its peers moving. The profiled rank's own work is 408 ms of a 678 ms window, 60%; the other 270 ms is 15 dummy forwards (reasoned from the figure; the text says "roughly 245 ms"). Widening EP makes it worse: one DEP16 took 17.9% longer than two DEP8 groups (reported).
The scheduler bubble
Cache capacity gets the prefix to the GPU. It does not get the request into a batch.
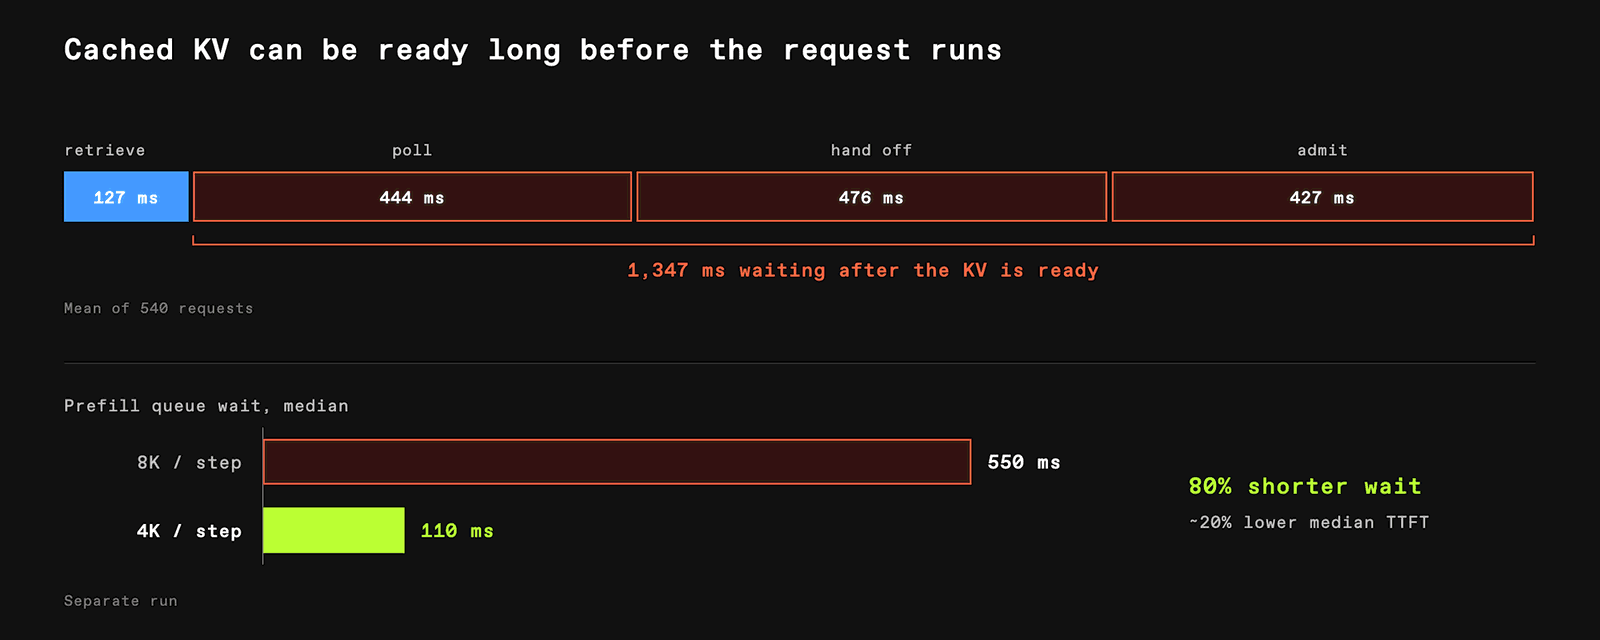
Fetching the cached KV takes 127 ms; the request then waits 1,347 ms to be polled, handed off and admitted (reported, mean of 540 requests). Workers only check for completed loads between forward passes, and a long prefill step is a long time between checks. A ready request that just misses a scheduling decision waits a whole step.
The fix is to make the steps shorter. Halving the prefill budget from 8K to 4K tokens per GPU per step cut median queue wait from 550 ms to 110 ms and median time to first token by roughly 20% (reported). Long cold prompts now pay for more, smaller steps; the post says the trade only works because most turns reuse a prefix. It is a setting tuned to this workload, not a default.
Decode: TP4, and the copies it keeps
Decode has the same MLA problem in a different form.
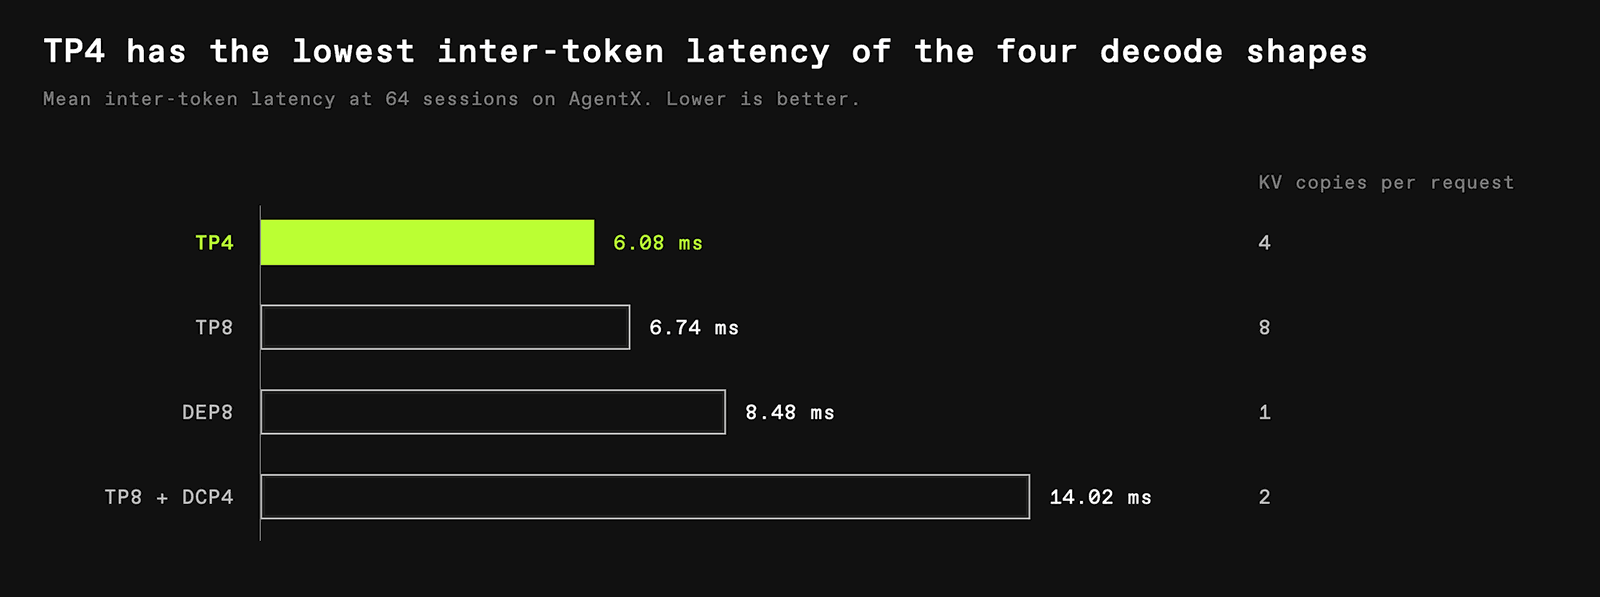
TP4 gives the lowest inter-token latency, 6.08 ms against 8.48 ms for DEP8 (reported), because DEP's pre-MoE synchronisation sits on the critical path of every decode step. But TP4 stores four copies of every latent.
Decode context parallelism (DCP), which splits the cached sequence across ranks, lost badly at 14.02 ms. GLM-5.3's attention is sparse: an indexer picks the top tokens and each query attends to at most 2,048 cached positions (measured: index_topk: 2048). There is little attention work to split, and the gather-merge-combine traffic costs more than it saves. (The GLM-5.3-Flash piece covers the same sparse-MLA family on the smaller model.)
So they kept TP4 and made each copy smaller.
Four bits per latent value: where 352 comes from
The post states the format: the 512-value latent stored in NVFP4, "four bits per value, with an FP8 scale for each group of 16 values," the 64-value rope part left in FP8, and each row going from 576 to 352 bytes. It does not show the sum, so here it is.
| FP8 row | NVFP4 row | |
|---|---|---|
| Latent, 512 values | 512 × 1 B = 512 B | 512 × 4 bit = 256 B |
| Block scales | none | 512 ÷ 16 = 32 scales × 1 B = 32 B |
| Rope part, 64 values | 64 × 1 B = 64 B | 64 × 1 B = 64 B |
| Row | 576 B | 352 B |
The reconstruction lands on both stated numbers exactly (reasoned), and it implies the FP8 baseline has no per-row scale: the leanest possible FP8 row, not a padded one. SGLang's NVFP4 KV cache uses the same 4-bit-plus-scale-per-16 format, and its "56.25% of FP8" is this table's 288 ÷ 512 for the latent alone.
Per row that is 576 ÷ 352 = 1.64x. The post's capacity figure is smaller: 1.09 million to 1.63 million cached tokens per decoder, 1.50x, "with the indexer and other state unchanged" (reported). If the untouched state is bytes per token per layer, then gives bytes (reasoned). GLM-5.3 keeps sparse-indexer keys on 21 of its 78 layers (measured: indexer_types lists 21 full and 57 shared), and 128 FP8 values plus a scale on 21 layers would account for about a third of that if stored the way DeepSeek's indexer is. I cannot attribute the rest. "~50% more" is the honest summary, and it is what the post says.
What does that buy? A 146K-token session is 146,000 × 78 × 576 = 6.6 GB of FP8 latent, or 4.0 GB in NVFP4 (reasoned, latent only). The reported capacities hold 7 such sessions per decoder in FP8 and 11 in NVFP4. The headline configuration runs 66 sessions over 4 decoders, about 16.5 each (reasoned), so even compressed, not every history fits in HBM at once. Prefix caching, sticky routing and Mooncake's host-DRAM tier carry the rest, and each extra resident session is a 146K-token prefix that does not come back over the wire.
A kernel that reads four bits directly
Storing NVFP4 is easy. Attending over it without giving the savings back is the work.
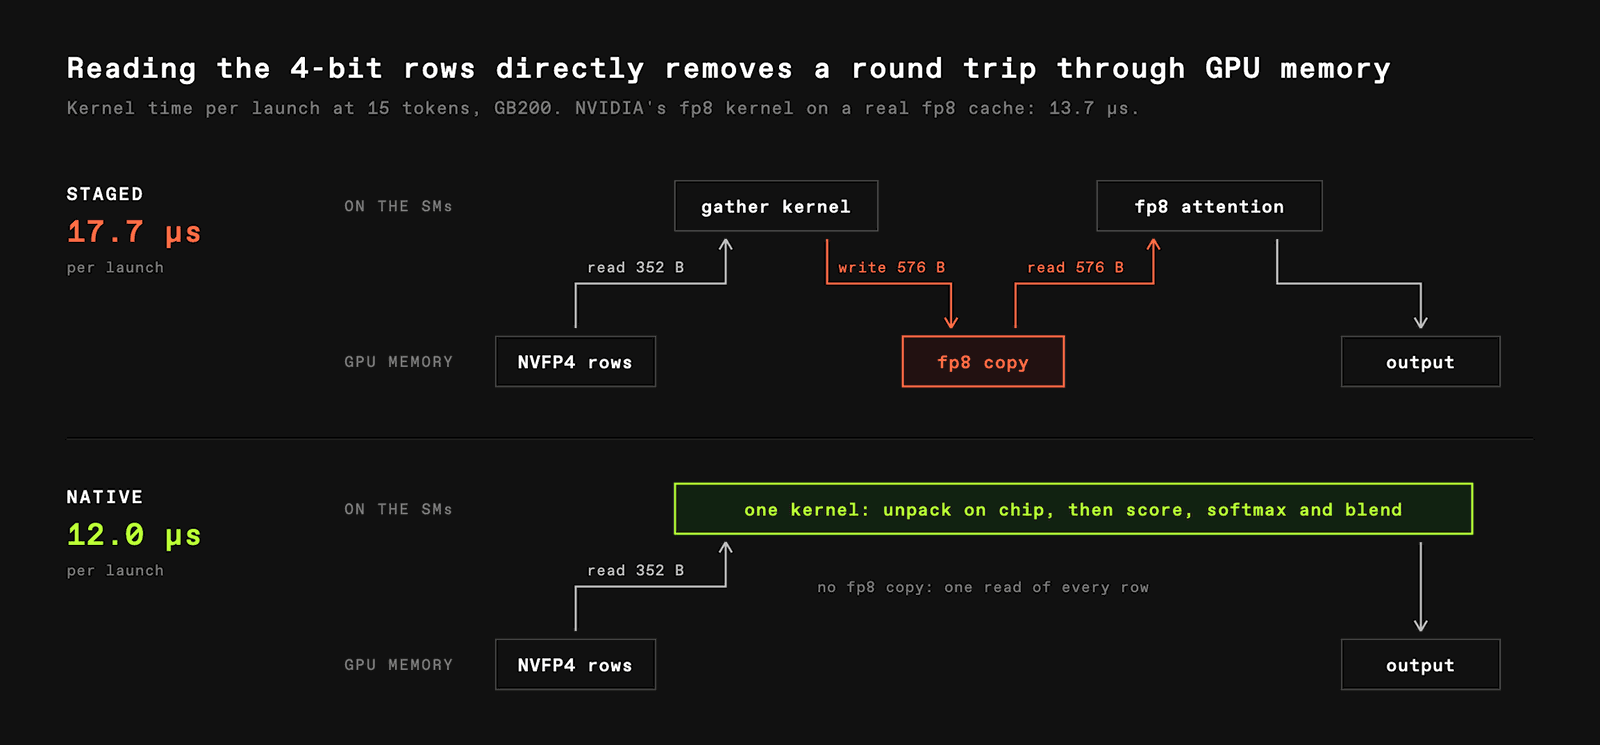
The first version unpacked the selected rows into a temporary FP8 buffer and called the existing FP8 attention kernel. That kept the capacity win but added a write and a read of a 576-byte row on every layer. Per selected row, the staged path moves 352 + 576 + 576 = 1,504 bytes through HBM against 352 for a native read, 4.3x as much (reasoned from the figure).
The native kernel loads the rows the indexer selected and unpacks them on-chip, computing in FP16 with FP32 accumulation. A cluster of three to eight SMs shares each query token's rows and merges partial results through distributed shared memory in one launch; within each SM, warp groups unpack, score and accumulate through a three-slot buffer. That is FlashAttention-3's warp specialisation with a dequantisation stage in front. One tuning is worth stealing for any sparse kernel: short contexts leave -1 entries in the 2,048-position list, the first version read row zero for each of them, and zero-filling them took a 35-token launch from about 41 μs to 20.6 μs (reported).
The final numbers at 15 query tokens per launch: native NVFP4 12.0 μs, staged NVFP4 17.7 μs, FP8 attention 13.7 μs (reported). The post adds the caveat itself: "These are results for that workload, not a speed advantage over FP8 at every batch size." It also says attention is about 8% of a decode step at 32 sessions, so shaving 12.0 against 13.7 μs moves the whole step by roughly 1% (reasoned). The kernel exists to make the capacity win free, not to make decode faster, and the post says as much.
The thread says the kernel is being contributed to FlashInfer as an experimental operation. As of 6 October I could not find a matching pull request in flashinfer-ai/flashinfer (searched for NVFP4 sparse-MLA decode, GLM-5.3 and 352-byte rows; there is a lot of adjacent NVFP4 MLA work, none of it obviously this). The post says "are contributing", which is consistent with that.
Accuracy
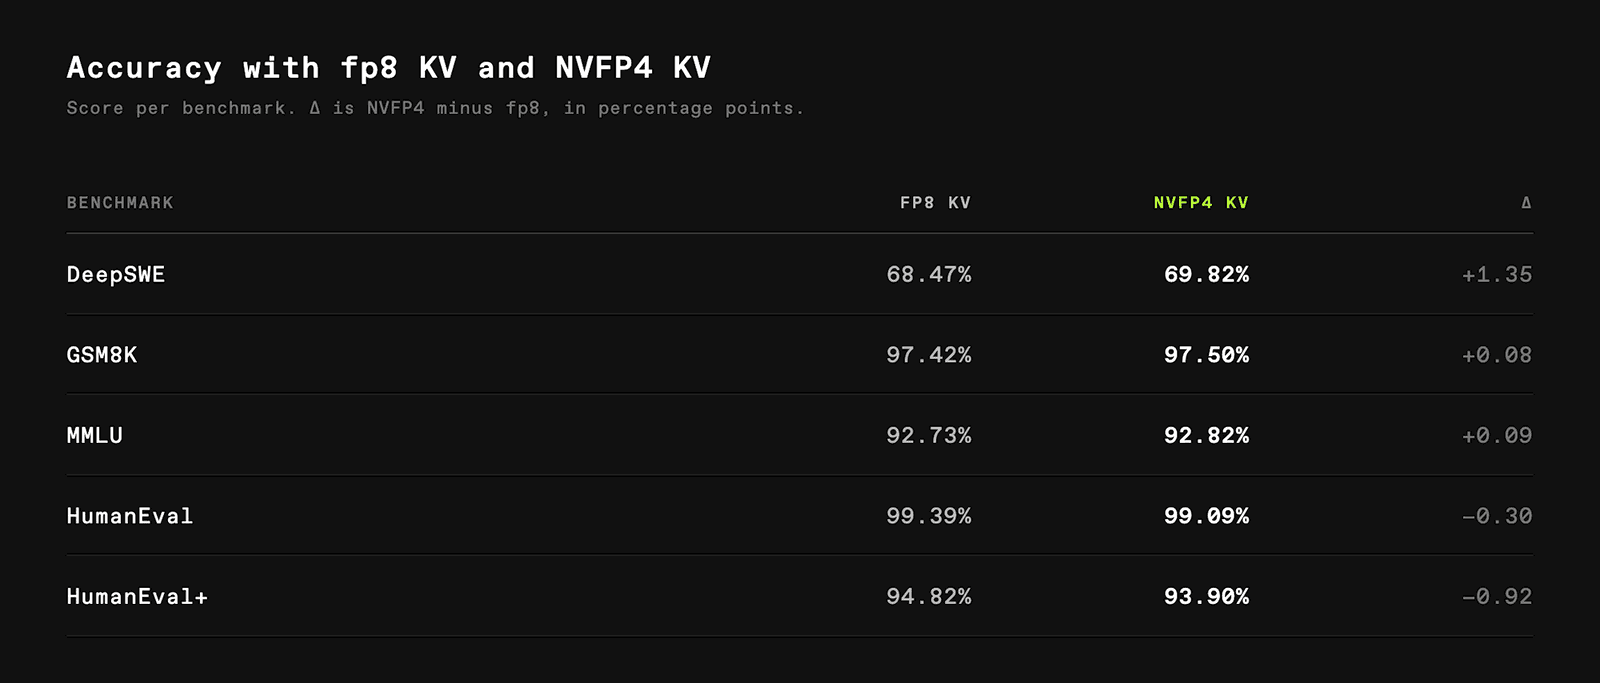
The post calls the suite "rigorous" with emphasis on long context. Of the five benchmarks shown, only DeepSWE is plausibly long-context, and with no sample sizes or error bars, neither +1.35 nor -0.92 can be told from noise. The table supports "no visible regression on these five". It is not evidence that 4-bit KV is harmless at 140K tokens of agent history, which is where this deployment runs.
Moving the cache: 32K copies for one request
Every new session's KV crosses from a prefill rank to a decode rank. Prime uses vLLM's NIXL connector over multi-node NVLink, and in an early comparison NVLink added roughly 292 ms to time to first token relative to InfiniBand (reported). The faster wire was slower.
The cause was fragmentation. One 200K-token request arriving at one TP4 rank triggered 32K device-to-device copies (reported). In NVFP4 that request's latent is 200,000 × 78 × 352 = 5.5 GB (reasoned). NVIDIA specifies NVLink on GB200 at 1.8 TB/s per GPU, both directions together, so the bytes themselves need well under 10 ms of wire time (reasoned from NVIDIA's spec). When the transfer takes an order of magnitude longer, the time is going to per-copy overhead, not bandwidth.
The layout explains the count. vLLM describes every KV allocation with the axes L (layer), B (block), H (heads), N (tokens in a block) and C (channels), and since its KV-cache layout refactor (merged 22 August) the physical order is a choice: LBHNC, BLHNC and four others, selectable with VLLM_KV_CACHE_LAYOUT (measured from the PR description).
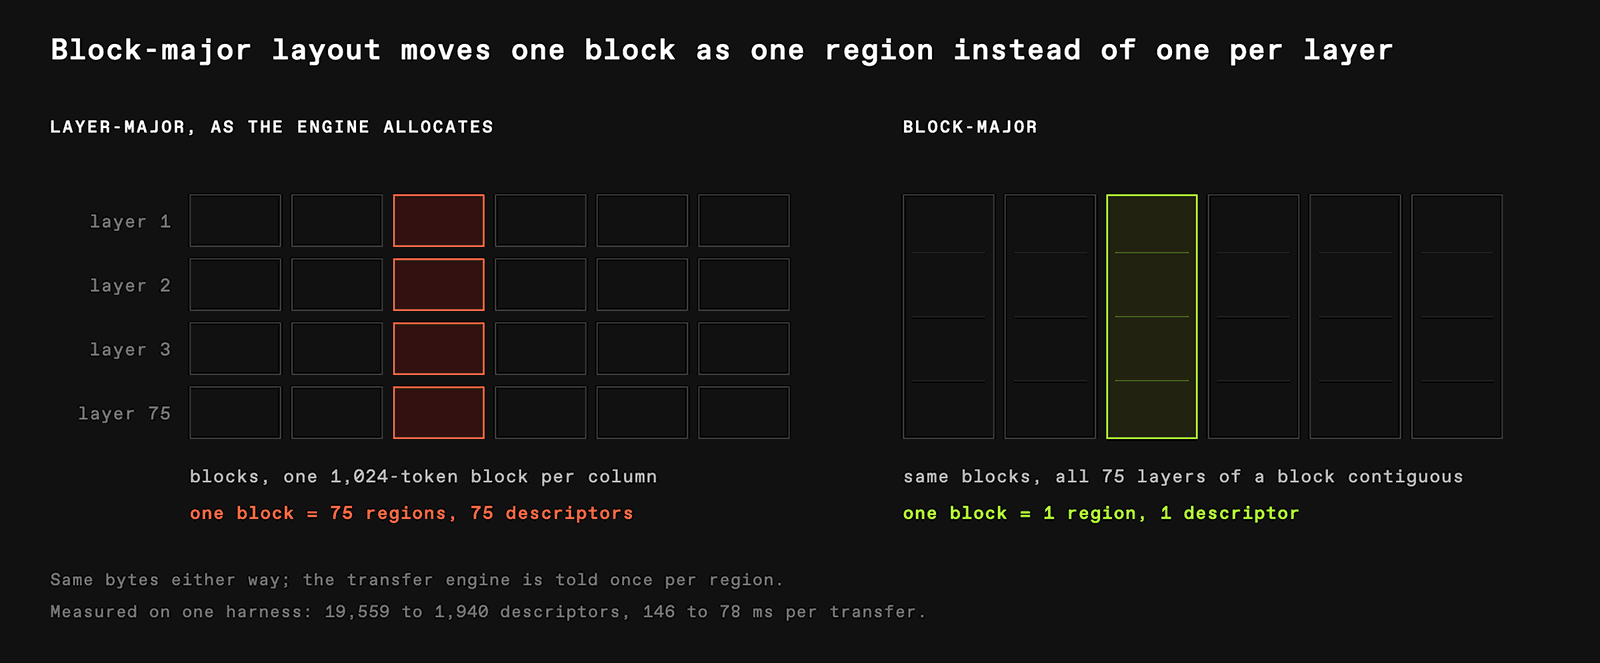
In layer-major LBHNC, each layer has its own cache tensor. A logical block, say tokens 0-1023 of one request, is one small region per layer, and NIXL gets one descriptor per region. In block-major BLHNC, all layers of a block are adjacent in memory, so a block is one region and one descriptor.
The widget is the idealised model. With 1,024-token blocks a 200K request is 196 blocks × 78 layers = 15,288 copies of 360 KB each; block-major with 64-token blocks is 3,125 copies of 1.8 MB each (reasoned). The post's 32K is about twice the idealised layer-major count.
The post's controlled comparison is cleaner. On TP8, layer-major with 1,024-token blocks against block-major with 64-token blocks, 16x smaller: descriptors fell from 19,559 to roughly 1,940, about 10x, and mean transfer time from 146 ms to 78 ms, a 47% cut (reported; the thread rounds this to "by half"). The idealised model predicts a smaller drop: 78 regions per block collapsing to 1, against 16x more blocks, is 78 ÷ 16 = 4.9x fewer descriptors (reasoned). If block-major issued one descriptor per block, 1,940 descriptors at 64 tokens is about 124K tokens, and 19,559 descriptors over 121 blocks of 1,024 is about 160 regions per block, roughly two per layer (reasoned, under that one assumption). That would also explain the 32K. Something in the layer-major path, a second cache tensor per layer or a split along heads, doubles the count; the post does not say which.
The useful point survives the bookkeeping. Before, bigger blocks meant fewer copies and smaller blocks meant less waste in partly filled blocks. Block-major let them have finer blocks and fewer copies at once.
Tool calls
Not a cache fix, but the part an agent user notices first. Dynamo was silently dropping calls to undeclared tools, and GLM's tool-call format had no structural-tag support, so schemas were not enforced during generation. Prime contributed a structural-tag builder that hands xgrammar the masking rules, and fixed a parser that turned the literal string < into < inside code. The claim is a "near zero error rate" (reported), with no number and no published test suite.
The ledger
| Claim | Status |
|---|---|
| 576 → 352 bytes per MLA row | Holds. 256 + 32 + 64, exactly (reasoned) |
| ~50% more cached tokens | Holds as stated. 1.09M → 1.63M is 1.50x; the row alone is 1.64x, and the post says why they differ (reported) |
| DEP8 ~5x the prefix cache of TEP8 | Consistent with MLA. TP keeps one latent copy per rank; ideal 8x, less replicated attention weights (reasoned) |
| 1:4 serves 66 sessions at 101 tok/s/user, 100 tok/s/GPU | Reported; internally consistent only if about a third of sessions have a request in flight (6,666 vs 2,400 tok/s, reasoned) |
| Halving the prefill budget cut queue wait 550 → 110 ms, TTFT ~20% | Reported, on a separate run |
| Native kernel 12.0 μs vs 13.7 μs FP8 | Reported, at 15 tokens per launch only; worth ~1% of a decode step (reasoned) |
| BLHNC: ~10x fewer descriptors, mean transfer halved | Reported: 19,559 → ~1,940 and 146 → 78 ms (47%). The idealised model predicts 4.9x; the extra factor is unexplained |
| NVFP4 KV accuracy | Five benchmarks, no error bars; no visible regression |
| ~600B tokens a day | Thread figure. The post says "nearly a trillion tokens every day just internally" before public release. Both may be true for different periods; neither is checkable |
| Among the fastest GLM-5.3 endpoints on OpenRouter, 100% uptime | Unverified; a live leaderboard and a launch-to-date uptime, not a measurement anyone can reproduce |
| Kernel contributed to FlashInfer | Not found as of 6 October; the post says "are contributing" |
What I would take from it
The transferable lesson is about MLA. A latent cache with no head axis is cheap in memory and a trap for tensor parallelism: every TP rank keeps all of it. Prime uses each topology where it is cheap: data-parallel prefill for capacity, TP4 decode for latency with the copies shrunk to four bits. For any DeepSeek-family model, that split is the starting point.
The second lesson is that the cache's enemies are mostly not bytes. They are scheduler steps that are too long (1,347 ms of waiting after a 127 ms fetch), copies that are too small (32K for one request), and kernels that write the cache out to read it back. NVFP4 gets the attention; the layout and scheduler fixes cost no accuracy at all.
What I would ask for is the memory ladder. Every capacity claim here is a ratio of usable HBM, and the post never shows how much a decoder has left for KV after weights and buffers. With that one table, the 8x-to-5x gap and the missing 100 bytes per row would both close.
Related on this site: Z.ai's own account of building GLM's inference stack, the Kimi K3 TPU megakernel for the opposite end of the latency trade, and KVzip for compressing the cache by dropping tokens rather than bits.