2026-09-18 · 28 min · agents · inference · systems · kernels · reproducibility · glm
Z.ai's write-up carries a title that does not undersell itself: “Toward Recursive Self-Improvement: How GLM Built Its Own Inference Infrastructure.” The claim in the brief for this piece is the plain-English version of that title:
We're sharing how GLM-5.3 helped build and optimize the inference infrastructure serving GLM-5.3-Flash. The system went from its first successful run to production readiness in less than two weeks, with end-to-end throughput tripling relative to the initial baseline. The key was dense feedback: local correctness tests, execution traces, microbenchmarks, and end-to-end measurements that enabled targeted hypothesis testing rather than reliance on aggregate performance metrics alone.
This site already covers the model at the center of this: GLM-5.3 shipped as a month of post-training on a fixed base, and GLM-5.3-Flash is the 320B/18B-active hybrid-attention model this infrastructure actually serves — that piece already flagged the 3x claim in one paragraph and called it “the least checkable number in the release, carrying the most strategically loaded claim.” This post is Z.ai's own follow-up, three weeks later, publishing the detail that was missing. So the question is narrow and answerable: does the detail close the gap?
| Post | Toward Recursive Self-Improvement: How GLM Built Its Own Inference Infrastructure · Z.ai · 2026-09-17 |
| Subject | The serving stack for GLM-5.3-Flash, built on ≥100,000 unnamed Chinese-made accelerators |
| Headline claim | First successful run → production in 13 days, end-to-end throughput ×3.22 over that run's own baseline |
| Who did the work | An “Infra Agent” powered by GLM-5.3, plus named inference-optimization engineers |
| Method claimed | “Dense feedback”: correctness tests, execution traces, microbenchmarks, end-to-end metrics, kept local/cheap/objective |
| Checkable artifacts | fla-org/flash-linear-attention PR #1180, merged 2026-08-27 as 465b4bc · plus DeepEP at tag v1.2.1, named in the post, which makes Case 2 checkable too |
| Verified here by | Cloning flash-linear-attention, DeepEP, and reading zai-org/GLM-5.3-Flash's config.json |
| Not published | Any absolute throughput number, any numeric comparison to an existing engine, any benchmark script, any raw log |
Thirteen days, and a 3x against itself
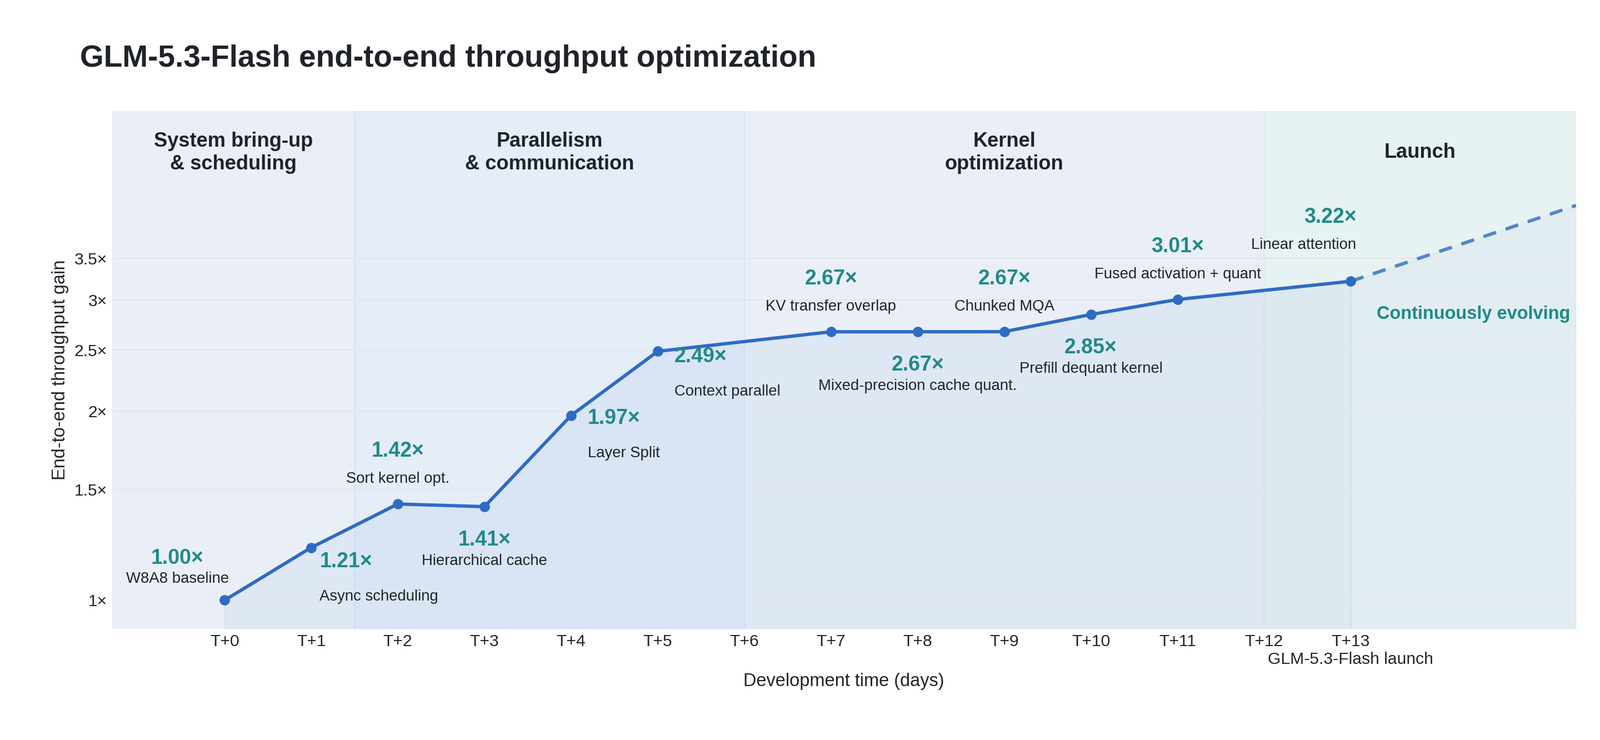
The post's single quantitative figure is a chart, and it is more informative than the prose around it. Figure 1 plots the end-to-end throughput multiplier from T+0 to T+13, with a named optimization at every point:
The same twelve points, re-plotted so the day-over-day change is impossible to miss:
Read left to right and it looks like a clean climb. Step through it and two things the smooth line hides become visible: T+2 to T+3 is a small regression (1.42× to 1.41×, one named optimization after another), and T+7 through T+9 is flat at 2.67× across three separately named kernel changes — KV transfer overlap, mixed-precision cache quantization, and chunked MQA all land on the same measured multiplier. Neither is necessarily a problem — a fix can be necessary for correctness or a later step without moving throughput on its own, which is exactly the distinction the post draws between “performance optimizations” and “bug fixes that did not immediately improve throughput.” But the chart doesn’t say which is which, and two of the thirteen days (T+6, T+12) have no point plotted at all.
Every one of those twelve numbers is printed on Z.ai's own chart, so this is a transcription, not an estimate. Two things fall out of stepping through it that the smooth published line doesn't say out loud. First, T+2 to T+3 is a small decrease — 1.42× to 1.41×, “Sort kernel opt.” to “Hierarchical cache” — inside a chart whose entire visual argument is an unbroken climb. Second, T+7 through T+9 is completely flat at 2.67× across three separately named kernel changes: KV transfer overlap, mixed-precision cache quantization, and chunked MQA. The post itself gives the honest reading available for both: it distinguishes “performance optimizations that directly increased throughput” from “bug fixes that did not immediately improve throughput but were essential to launching the system correctly and reliably.” That is a real distinction and it may explain both anomalies completely — a correctness fix has to ship even when it doesn't move the needle. But the chart doesn't label which points are which, so from the outside a reader cannot tell a stalled optimization from a necessary correctness fix that happened to land during a stall.
The number Z.ai leads with — “end-to-end serving performance… roughly 3×”, “tripling end-to-end throughput relative to the initial baseline” — is the final point on this exact chart, 3.22× at T+13, rounded down to a cleaner headline. That arithmetic is fine. What the chart cannot do, because nothing in the post does, is tell you what 1.00× or 3.22× correspond to in tokens per second, in milliseconds of time-to-first-token, or on what specific accelerator. The baseline is described only as “its first successful run,” and a first working run on hardware nobody had deployed at this scale before — the post says so directly, “no one had previously deployed a cluster of Chinese-made accelerators at this scale” — is close to the weakest possible denominator a throughput multiplier can have. First runs are slow by construction: no autotuning, no parallelism tuning, whatever kernel happened to compile. Tripling a number like that is a much smaller claim than tripling a number that was already competitive.
Nowhere in the post is GLM-5.3-Flash's serving throughput set against vLLM or SGLang running the same model on NVIDIA GPUs — both of which GLM-5.3-Flash already lists as supported day-one serving paths — or against any other inference engine, with a number attached, on any hardware. There is exactly one comparative claim in the whole post, and it is easy to read past because it is the sentence immediately after the “roughly 3×”: “Both hardware utilization efficiency and per-token cost reached levels comparable to mainstream NVIDIA GPUs.” That is a parity claim against NVIDIA silicon, and it arrives with no number, no named GPU, no named engine, no unit, and no measurement method — a stronger assertion than the 3× and less checkable than it. So the honest reading is not that the post declines to compare itself to the incumbent; it is that the post compares itself to the incumbent and declines to show the comparison.
The closest thing to an external signal is usage, not efficiency: GLM-5.3-Flash ran under the anonymous name Ox-Alpha on OpenCode and OpenRouter and, per the post, “became the most-used model on both platforms” within a week, “processing more than 62 trillion tokens in six days.” I checked OpenRouter's live rankings while writing this and could not confirm or refute that claim either way — rankings there are a rolling weekly window, the launch week in question rolled off three weeks before I looked, and nothing in the post links to an archived snapshot. What I can do is check it against the post's own other number. 62 trillion tokens over six days is 1.20 × 10⁸ tokens per second sustained; at 2 FLOPs per active parameter per token and GLM-5.3-Flash's 18B active, that is about 4.3 × 10¹⁸ FLOP/s, or roughly 43 TFLOP/s per accelerator across “more than 100,000” of them. That is a few percent of what an H100-class chip does at peak — an entirely ordinary figure for decode-dominated serving, where memory bandwidth, not FLOPs, is the wall. The two headline numbers are therefore mutually consistent rather than mutually implausible — which is worth stating, because a token count that implied 400 TFLOP/s per chip would have falsified the accelerator count on arithmetic alone, and this one doesn't. Real usage at that volume, if accurate, says the system held up under production load. It says nothing about whether ×3.22 against a slow first run is efficient serving or merely less inefficient serving — and an unquantified parity claim against NVIDIA, sitting where a measured comparison should be, is on the site's own terms the actual finding here rather than a gap to read past.
How much did the Infra Agent actually do
“Helped build the infrastructure” is doing a lot of work in one sentence, so the post's most valuable contribution is that it names three specific things the agent did, each with enough detail to check. It names a merged PR for one of them, a version tag for another, and a hardcoded tiling factor for the third — and all three of those, it turns out, are enough. I cloned fla-org/flash-linear-attention and deepseek-ai/DeepEP and read GLM-5.3-Flash's released config.json; what follows is what those say.
Case 1 — a numerical-precision bug in a Context Parallelism kernel, and the one thing the post actually links. The post's account: kernel-level validation, comparing partitioned against unpartitioned execution paths for numerical agreement, surfaced a discrepancy in the KDA (Kimi Delta Attention) kernel's Context Parallelism path. The mechanism, per the post: “In the original implementation, tl.dot defaulted to TF32 computation for better performance, even when its inputs were FP32. This lower computational precision caused errors to accumulate during transformation merging and state updates, becoming more pronounced with long contexts.” The stated fix: explicitly set input_precision="tf32x3", combining three TF32 tensor-core passes for a higher-precision result. The post links the result: “merged upstream into Flash Linear Attention. See PR #1180 for details.”
That link is checkable, so I checked it — by cloning the repository rather than reading the PR page. It lands as a single squashed merge commit, 465b4bc, authored 2026-08-27 17:49 +0800, titled [CP] use tf32x3 affine chain in kcp (#1180) — the day after GLM-5.3-Flash's August 26 launch, which by the timeline above is T+1, right at the start of the “system bring-up” phase. git show --numstat gives its exact size: six files, +140 / −13 lines, of which 42 added lines are the kernel change and 59 are new tests. The core of it, in fla/ops/cp/chunk_delta_h.py:
# fla/ops/cp/chunk_delta_h.py — pre_process_fwd_kernel_merged, before
b_m = tl.dot(b_m_i.to(tl.float32), b_m.to(tl.float32))

# after
b_m = tl.dot(b_m_i.to(tl.float32), b_m.to(tl.float32), input_precision=AFFINE_CHAIN_PRECISION)
The blog's pseudocode — two lines, M = tl.dot(M_chunk, M) for the shard merge and S_next = tl.dot(M, S) + H for the state update, with the fix applied “for both operations” — is a simplification of this, and the simplification holds up: that really is the affine-chain merge the CP path uses to combine per-shard states. One correction to the arithmetic, though, since I counted: the diff touches six tl.dot call sites, not two, spread across three kernels — one each in pre_process_fwd_kernel_merged and pre_process_bwd_kernel_merged, and four inside merge_fwd_bwd_kernel (the STATE_V_FIRST and non-STATE_V_FIRST branches of both the local-merge and the all-gathered-merge paths). The post's two-line pseudocode is a fair picture of the idea and an undercount of the surface. Checking the announcement against the source here doesn't turn up an error — it turns up a real fix, correctly described, tested, and dated exactly where the post's own timeline says it should be.
It also turns up one thing the post's summary leaves out. The fix is opt-in, not a change to the kernel's default behavior, and you can see that in the launch site rather than the kernel body. Every one of the four dispatch points in fla/ops/cp/chunk_delta_h.py passes the same three-way ternary:
# fla/ops/cp/chunk_delta_h.py — chunk_gated_delta_rule_fwd_h_pre_process
use_tf32x3_affine_chain = context.use_tf32x3_affine_chain
...
    AFFINE_CHAIN_PRECISION=(
        "tf32x3" if use_tf32x3_affine_chain and IS_TF32_SUPPORTED
        else ("ieee" if not IS_TF32_SUPPORTED else None)
    ),
# fla/ops/cp/context.py — the only way to turn it on for distributed CP
def build_cp_context(
cu_seqlens: torch.Tensor,
group: ProcessGroup,
conv1d_kernel_size: int | None = None,
cu_seqlens_cpu: torch.Tensor | None = None,
use_tf32x3_affine_chain: bool = False, # <- default
) -> FLACPContext:Read the ternary from the bottom up. On hardware without TF32, precision is forced to "ieee" — not tf32x3. On hardware with TF32 and the flag off, AFFINE_CHAIN_PRECISION is None, which is Triton's “use the default,” and Triton's default for an FP32 tl.dot is plain TF32 — the exact behavior the bug report identifies as insufficiently precise for long context. tf32x3 happens in exactly one cell of that truth table, and reaching it requires a caller to pass use_tf32x3_affine_chain=True into build_cp_context. The environment variable the repo documents for this, FLA_INTRACARD_TF32X3 (ENVs.md, default 0), does not help here either: it is read once, at import, in fla/ops/common/backends/intracard.py, and it only feeds the intra-card CP backend —
# fla/ops/common/backends/intracard.py:31
USE_TF32X3_AFFINE_CHAIN = os.environ.get('FLA_INTRACARD_TF32X3', '0') == '1'
— so the multi-GPU CP path Z.ai were actually debugging has no env-var switch at all, only the Python keyword argument. None of this contradicts what Z.ai wrote; “the fix was to explicitly set input_precision="tf32x3"” is true of the code path the PR adds. It's just a fix you have to turn on, in code, per call site, and whether GLM-5.3-Flash's own production serving stack passes that flag is not visible from the PR.
The part that is reproducible is the regression coverage. The PR adds exactly three tests, all of which need real GPUs and all of which are ordinary pytest functions you can run today:
# tests/context_parallel/test_cp_kda.py — one of three added by PR #1180
def test_cp2_sequence_cut_tf32x3():
    """CP2: sequences cut across rank boundary, tf32x3 affine chain in CP."""
    if torch.cuda.device_count() < 2:
        pytest.skip("At least 2 GPUs required")

    run_cp_test_with_spawn(
        world_size=2, test_name="CP2_SequenceCut_TF32X3",
        T=10240, H=12, D=128, lengths=[3000, 4000, 3240],
        dtype=torch.bfloat16, use_tf32x3_affine_chain=True, **GATE_KWARGS,
    )
Two GPUs, a 10,240-token sequence split three ways, bf16, the flag on. That is the whole reproduction: pytest tests/context_parallel/test_cp_kda.py -k tf32x3. It is also the only executable thing the post itself leads a reader to — everything else on this page I had to go and find.
Case 2 — a Python GIL bottleneck blocking KV-transfer overlap, found by a timeline read rather than a guess. Engineers set an acceptance test: under the same workload, Prefill + KV Transfer shouldn't run more than 5% slower than Prefill alone. The agent found gaps “exceeded 20% in some scenarios,” then read the execution timeline and noticed that KV Transfer submission on the Python side never overlapped with DeepEP's dispatch/combine calls. Tracing the call chain to the Python/C++ boundary, in DeepEP v1.2.1, intranode_dispatch and intranode_combine never released the Python GIL while they ran, so the Mooncake Transfer thread in the same process couldn't acquire it to submit its own work — a real concurrency bug, not a performance tuning question. The tell that made the diagnosis credible: internode_dispatch in the same codebase already released the GIL, with a comment explaining why, giving the agent a working contrast case inside the same file. The fix released the GIL during the relevant C++ intervals; the measured gap fell under 1% afterward, re-checked against the same acceptance test.
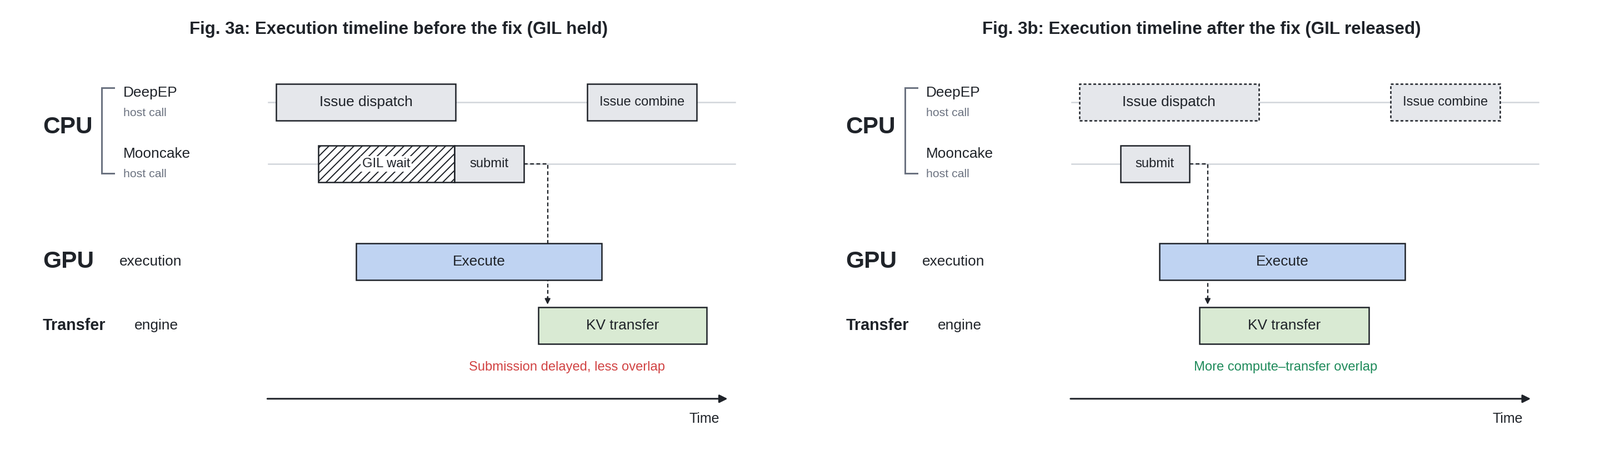
The post links no PR for this one, so the obvious move is to file it under “internally consistent, not independently checked” and move on. That would be a mistake, because Z.ai name the exact version — DeepEP v1.2.1 — and that is a real git tag, which makes the claim checkable line by line even without a PR. It is deepseek-ai/DeepEP at commit 9af0e0d, and in that tree csrc/deep_ep.cpp is 1,382 lines and contains exactly one gil_scoped_release. Here is where it is:
// csrc/deep_ep.cpp @ v1.2.1, line 654 — Buffer::internode_dispatch
// ...
#ifndef DISABLE_NVSHMEM
    // In dispatch, CPU will busy-wait until GPU receive tensor size metadata from other ranks, which can be quite long.
    // If users of DeepEP need to execute other Python code on other threads, such as KV transfer, their code will get stuck due to GIL
    // unless we release GIL here.
    pybind11::gil_scoped_release release;   // line 666 — the ONLY one in the file
That is the contrast case, verbatim, and the comment names the exact victim: “other Python code on other threads, such as KV transfer.” Somebody at DeepSeek hit this on the inter-node path and wrote down why. Now the intra-node twin, 348 lines earlier in the same file, doing the same CPU wait with no such line anywhere in it:
// csrc/deep_ep.cpp @ v1.2.1 — Buffer::intranode_dispatch begins at line 306.
// No gil_scoped_release anywhere in its body. At line 451:
            auto start_time = std::chrono::high_resolution_clock::now();
            while (true) {
                num_recv_tokens = static_cast<int>(*moe_recv_counter);
                bool ready = (num_recv_tokens >= 0);
                for (int i = 0; i < num_local_experts and ready; ++i)
                    ready &= moe_recv_expert_counter[i] >= 0;
                if (ready)
                    break;
                if (std::chrono::duration_cast<std::chrono::seconds>(
                        std::chrono::high_resolution_clock::now() - start_time).count() > NUM_CPU_TIMEOUT_SECS)
                    throw std::runtime_error("DeepEP error: CPU recv timeout");
            }
An unbounded spin on a pinned host counter the GPU writes, holding the interpreter lock the whole time, and its only exit other than success is NUM_CPU_TIMEOUT_SECS — which csrc/kernels/configs.cuh:13 defines as 100 in a normal build. The Python binding does nothing to save you either; pybind11 holds the GIL across a .def unless you ask it not to, and none of these ask:
// csrc/deep_ep.cpp @ v1.2.1, lines 1372-1375 — no py::call_guard<py::gil_scoped_release>()
        .def("intranode_dispatch", &deep_ep::Buffer::intranode_dispatch)
        .def("intranode_combine",  &deep_ep::Buffer::intranode_combine)
        .def("internode_dispatch", &deep_ep::Buffer::internode_dispatch)
        .def("internode_combine",  &deep_ep::Buffer::internode_combine)
So every element of Z.ai's account checks out against the named version: the two intra-node calls hold the GIL, dispatch waits on the CPU for a GPU-written token count while holding it, and the inter-node sibling already released it with a comment explaining why. The agent's “tell” was not a lucky guess; it was a three-line comment sitting 348 lines away in the file it was already reading.
One thing the post does not say, and it is the kind of detail this site exists to add: the fix was never upstreamed. I cloned DeepEP at a56d615, dated 2026-09-16 — the day before Z.ai published — and grepped the entire repository. There is still exactly one gil_scoped_release in it. The EPv2 refactor moved the code to csrc/legacy/buffer.hpp, where the comment now sits at line 896 and the release at line 898, still inside internode_dispatch, and intranode_dispatch and intranode_combine still hold the lock. Unlike Case 1, whose fix went upstream the day after launch, this one stayed a local patch. The pre/post numbers (20%+, then under 1%, against a stated 5% acceptance threshold) remain Z.ai's alone — but the bug they describe is now something a reader can see for themselves in two git commands.
Case 3 — a decode kernel that got slower on purpose, then 1.71× faster. The most quantitatively specific of the three. Z.ai describe a “skeleton library” distilled from SGLang, Flash Linear Attention, and DeepGEMM kernels, which the agent draws on and adds back to. The KDA Decode kernel's own version history:
| version | change | speedup vs. v0 |
|---|---|---|
| v0 | gate + activation fusion | 1.00× (baseline) |
| v1 | ReplaySSM support added | 0.90× — got slower |
| v2 | agent's “division optimization” | 1.00× — recovered |
| v3 | register-resident tiles + warp-level reduction | 1.71× |
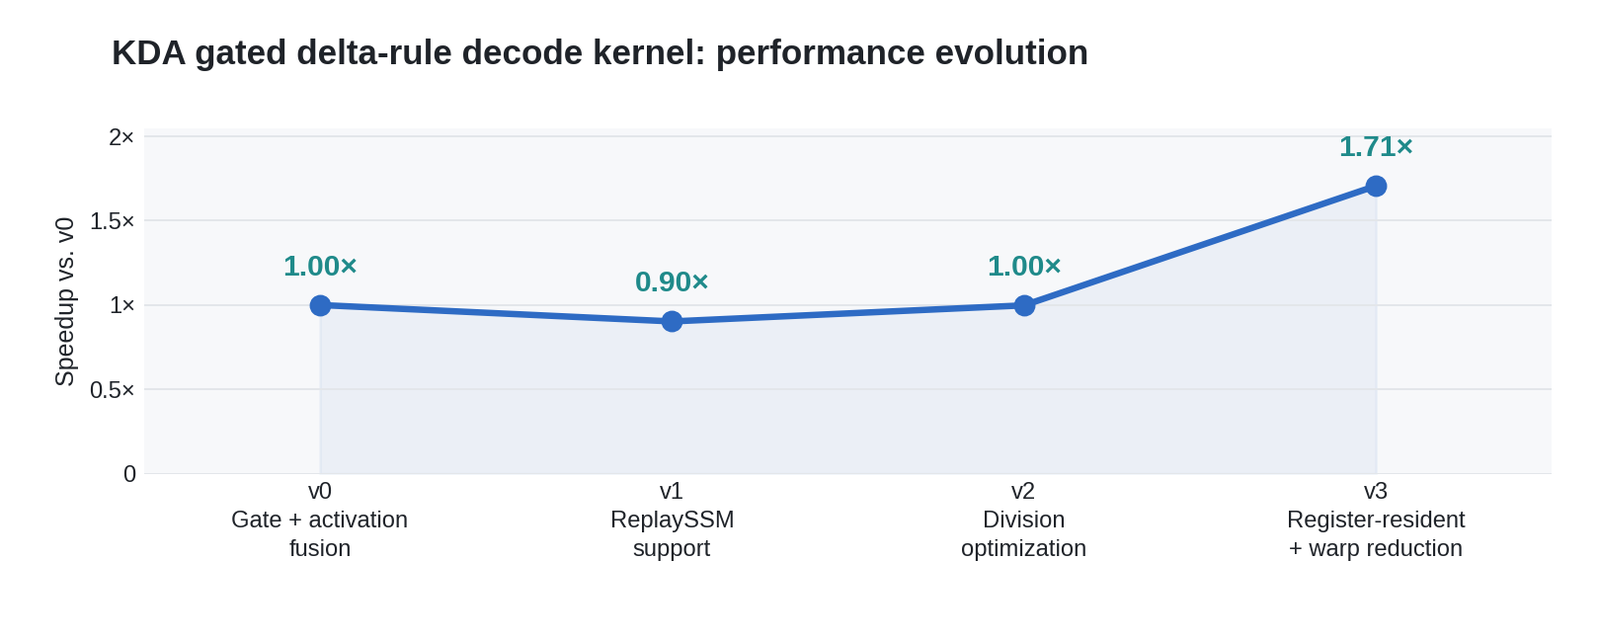
That v0→v1 regression is Z.ai's own reported number, not something I found by digging — ReplaySSM trades compute for memory, and the post states plainly that adding it “caused the first increase in kernel execution time.” The arithmetic across the chain is internally consistent: the post says the division optimization “reduced v1's execution time by 9.6%,” and working through the ratios, a 9.6% time reduction from a 0.90× speedup lands within rounding of the chart's own 1.00× for v2 — the numbers agree with each other, which is worth saying plainly since it's the kind of check that sometimes doesn't hold. (One wording note while we're being exact: the prose says “a 1.71× speedup over v2,” while the chart plots speedup over v0. Those coincide only because v2 recovered to precisely 1.00×. They are the same number here, but they would not be if v2 had landed anywhere else.)
The v3 change is the one worth chasing, because the post drops a very specific number into it and then walks away: the original kernel “tiled along the V dimension, causing the same FP32 normalization and gating computations to be repeated four times.” Not three, not eight. Four. Z.ai's kernel isn't public — but both halves of that arithmetic are, in two different places, and they multiply out exactly.
Half one is the released model. GLM-5.3-Flash's own config.json on Hugging Face pins the KDA geometry, at text_config.linear_attn_config:
"linear_attn_config": {
  "num_heads": 64,
  "gate_lower_bound": -5.0,
  "head_dim": 128,
  "short_conv_kernel_size": 4
}
Half two is the upstream decode kernel Z.ai say they distilled their “skeleton library” from. In fla/ops/kda/fused_recurrent.py, the V-tile width is not autotuned or heuristic — it is a hardcoded constant, and the grid is one program per V-tile per head:
# fla/ops/kda/fused_recurrent.py — fused_recurrent_kda_fwd
BK = triton.next_power_of_2(K)
BV = 32
...
grid = (triton.cdiv(V, BV) * N * HV, )
fused_recurrent_kda_fwd_kernel[grid](
    ..., BK=BK, BV=BV, num_warps=4, num_stages=2,
)
128 ÷ 32 = 4. The post's “four times” is head_dim / BV, and it falls out of a config file and a constant that were published separately, by two different organizations, neither of them explaining the other. That is the strongest independent confirmation anything in this post gets.
And the redundancy itself is visible in the kernel body. Each of those four programs walks the same token loop, and the first thing it does per token is recompute quantities that depend only on the K dimension — identical in all four:
# fla/ops/kda/fused_recurrent.py — inside the per-token loop, for every V-tile
for i_t in tl.range(0, T, num_stages=num_stages):
    b_q = tl.load(p_q, mask=mask_k, other=0, eviction_policy='evict_last').to(tl.float32)
    b_k = tl.load(p_k, mask=mask_k, other=0, eviction_policy='evict_last').to(tl.float32)
    ...
    if USE_QK_L2NORM_IN_KERNEL:
        b_q = b_q / tl.sqrt(tl.sum(b_q * b_q) + 1e-6)   # FP32 normalization
        b_k = b_k / tl.sqrt(tl.sum(b_k * b_k) + 1e-6)   # ...recomputed per V-tile
    ...
    if USE_LOWER_BOUND:
        b_gk = lower_bound * tl.sigmoid((exp(b_A) if HAS_A else b_A) * b_g)   # the gate
The FP32 L2 normalization of b_q and b_k, and the gate b_gk, carry no i_v anywhere in them. Four programs, four identical results, three of them thrown away. Scale that across GLM-5.3-Flash's actual shape — 34 KDA layers, 64 heads, 4 V-tiles — and one decode token launches 8,704 of these programs, of which 6,528 are recomputing a normalization and a gate that some sibling program has already computed. Merging the four tiles into one thread block with register-resident intermediates and a single warp-level reduction is exactly the fix that shape calls for, and Z.ai's own “by sacrificing some parallelism” is the honest cost: the same merge cuts the grid by 4×. That is a tradeoff statement, not a free lunch, and the 1.71× is the empirical answer to which side wins at decode-time batch sizes where the GPU is nowhere near occupancy-limited anyway.
Dense feedback: the argument worth taking seriously
Strip out the throughput claim and the post's real argument is a methodology one, and it's a good one. Figure 2 draws the contrast directly:
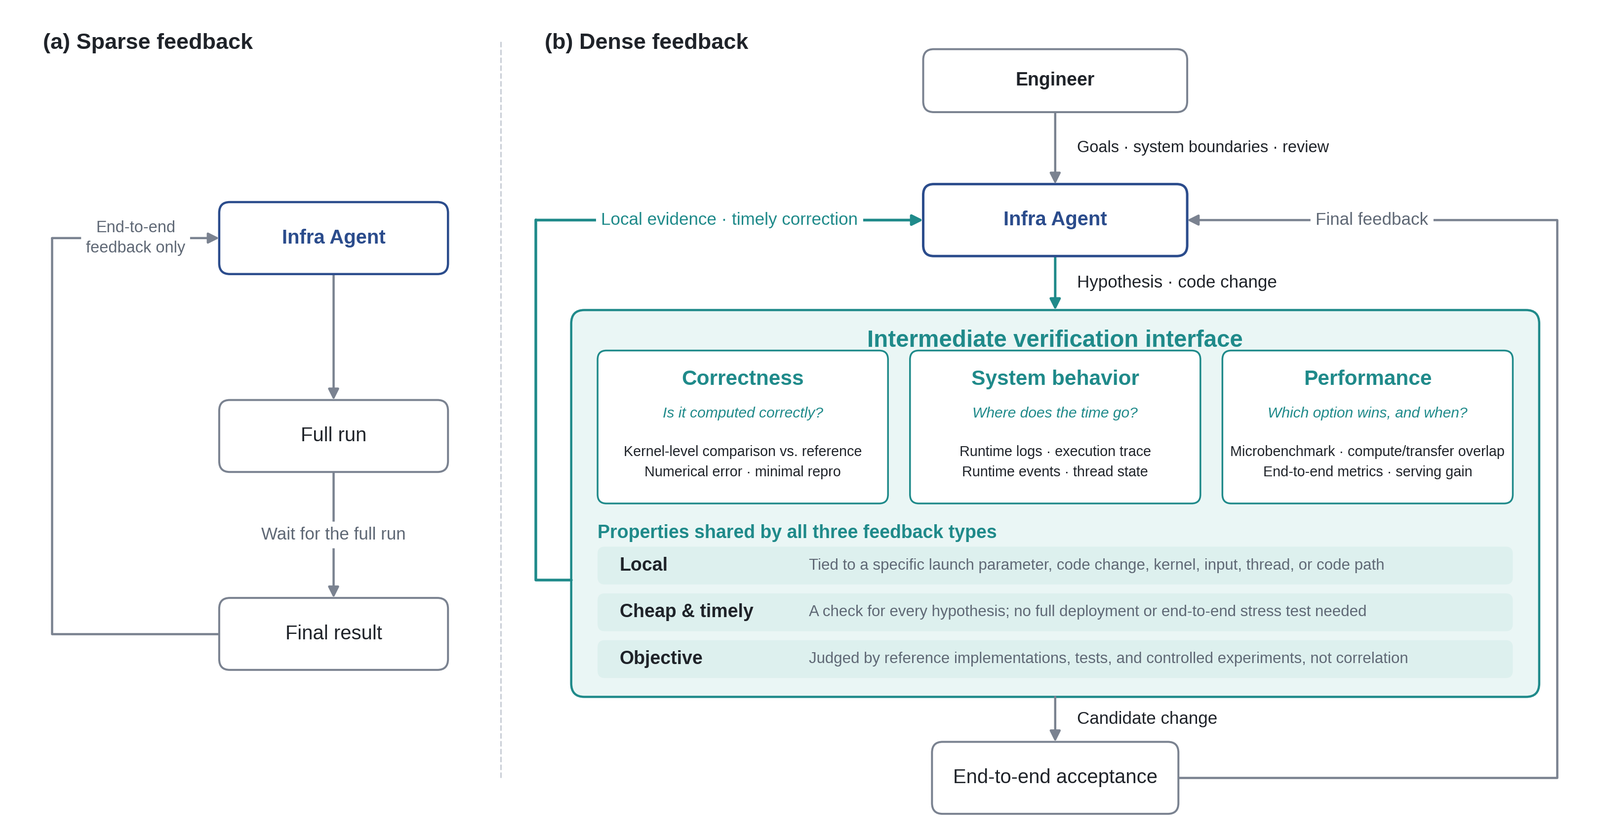
Sparse feedback is a loop with nothing inside it: agent proposes a change, the system runs a full run, the agent waits, gets a final result, tries again. Dense feedback inserts a triage stage between the agent's hypothesis and the expensive full run — correctness checks (“is it computed correctly?”), system-behavior checks (“where is the time going?”), and performance checks (“which approach wins, and under what conditions?”) — each one local, cheap, and objectively verifiable, so most hypotheses get an answer before anyone pays for a redeploy and a load test. Only survivors reach “end-to-end acceptance.”
The post states the underlying question precisely: “How do we turn sparse end-to-end results into fine-grained, attributable engineering feedback that directly guides the next action?” And it names why aggregate metrics fail an agent specifically: “numerical accuracy test failed,” “TTFT increased by 30%,” or “output throughput dropped by 20%” tells you that something regressed, never which layer is responsible or what to try next. That is exactly the gap the three case studies above each closed with something more local than an end-to-end number: a kernel-level tensor comparison, a timeline read, a per-version microbenchmark.
The red line is what the post draws as “(a) Sparse feedback” — every hypothesis waits for Full run → Final result before anyone learns anything. At 180 illustrative minutes per full run, the real 13-day bring-up window empties after about 104 hypotheses — drag past that point and the red line has already crossed the dashed budget line with hypotheses still left untested.
The green line screens each hypothesis with a cheap, local check first — a kernel comparison, a microbenchmark — and only sends the 15% that survive on to a full end-to-end confirmation. Same budget, roughly 5.1× more hypotheses testable. That ratio is not measured — Z.ai publishes no per-step durations — but it is the mechanism their own three case studies below actually exercise: a numerical check, a timeline read, and a microbenchmark, each run before anything needed a full redeploy.
The mechanism above is illustrative — Z.ai publishes no duration for any single validation step, so there's no real per-hypothesis cost to plug in. What's real is the 13-day budget (Figure 1's own T+0..T+13) and the shape of the argument: a fixed amount of wall-clock time buys far more testable hypotheses when most of them are screened by something that takes minutes instead of something that requires a redeployed service and a load test, which is the literal difference between the post's own “(a) Sparse feedback” and “(b) Dense feedback” diagrams.
Here is the part the post leaves as a diagram and someone else has already shipped as a command. The same repository that merged PR #1180 carries benchmarks/ops/verify.py, whose module docstring is the dense-feedback loop written as a tool contract:
# benchmarks/ops/verify.py — flash-linear-attention
"""
Correctness-gated benchmark driver for the kernel optimization loop.

This ties the two halves of an optimization iteration into one reproducible command:
it runs the op's **frozen pytest** as a correctness gate, and only if the gate is green does it measure performance.
A speedup is never reported on a red gate.
See ``.agents/skills/fla-optimization-loop/SKILL.md`` for the discipline this driver supports.
...
During an optimization loop you need both, every iteration,
and you must never let a fast kernel that silently broke gradients look like a win.
This driver enforces that ordering.
"""
Two commands, from that file's own usage block, are Z.ai's Figure 2 with the boxes replaced by argv (chunk_kda is one of the 23 ops registered in benchmarks/ops/registry.py):
# local, cheap, objective — correctness gate then microbenchmark vs. main
python -m benchmarks.ops.verify --op chunk_kda --base main

# fast signal: gate on a shape subset only (pytest -k selection, test unchanged)
python -m benchmarks.ops.verify --op chunk_gla --gate-k T15 --modes fwd
The discipline behind it is written down too, in .agents/skills/fla-optimization-loop/SKILL.md — an agent skill checked into the repo, which declares the test file and its naive.py reference frozen for the whole optimization loop and enumerates the ways an agent would otherwise cheat: loosening an assert_close tolerance, dropping parametrized shapes, special-casing on values the test happens to use, or — the one that would have flattered Case 1 — “flipping allow_tf32 on, dropping the fp32 accumulator to bf16/tf32, a config that quietly changes the numeric path.” That is the same failure mode Z.ai's Case 1 fixes, listed in an open repository as a thing you are not allowed to do to win a benchmark. None of this is Z.ai's work and none of it is evidence for their 3×. It is evidence for the argument underneath it, and unlike the argument, you can run it.
This is not a new observation on this site, and that's worth saying plainly rather than treating this post's version as novel. GeoGuessr recomputed from its own raw data makes the identical case from the opposite direction — three cheap, GPU-free checks (load-test the environment, simulate the rollout with no gradient, overfit a handful of tasks) exist specifically because “a broken reward, a wrong turn budget, and a model that genuinely can't do the task all produce the same flat line at zero, and you cannot tell them apart from a loss curve after the fact.” That is Z.ai's “end-to-end metrics can tell an agent that results got worse, but they cannot explain why,” independently arrived at, in reinforcement learning rather than kernel engineering. And Soup, covered separately on this site, lands on the same lesson from a third direction entirely — an executable proof notebook standing in for a paper's memory arithmetic. Three unrelated projects converging on “build the fast, local, attributable feedback loop before you trust the aggregate number” is a better argument for the lesson than any one of them stating it once.
What this closes, and what it still doesn't
Held against GLM-5.3-Flash's own coverage on this site, this post is a genuine, partial answer. That earlier piece listed the optimization stack in one paragraph — intra-node tensor parallelism, ReplaySSM, W8A8, mixed-precision KV cache, Layer Split, EPD disaggregation — and flagged two specific gaps: “the infrastructure-agent story has no detail attached,” and the 3x figure is “a ratio against an unstated baseline on unnamed hardware — the least checkable number in the release.”
The first gap is now filled, substantially — further than the post itself claims, in fact. Three case studies, a day-by-day optimization chart, a stated methodology, and one link that leads to a real, dated, merged pull request is a great deal more than “a GLM-5.3-powered infrastructure agent worked on kernels and bottleneck diagnosis.” And because the post names its versions instead of gesturing at them, two of the three cases turned out to be checkable rather than one: Case 1 against a merge commit, Case 2 against a git tag. Only Case 3's kernel is genuinely private, and even there the “four times” fell out of a public config divided by a public constant.
The second gap is not closed. The hardware is still just “a cluster of ≥100,000 Chinese-made AI accelerators,” never named. The baseline is still just “its first successful run” / “the initial baseline,” never given an absolute number. No published benchmark script, no raw log, no released harness accompanies any of the throughput, timeline, or accelerator-count claims — and the post nevertheless asserts parity with “mainstream NVIDIA GPUs” on both utilization and per-token cost. For a post whose stated thesis is that rigorous, attributable measurement beats trusting an aggregate number, publishing detailed methodology alongside an unquantified parity claim is a real tension, and it is worth naming rather than smoothing over just because the methodology argument itself is sound.
The ledger
Well supported. The dense-feedback methodology is described specifically enough to evaluate on its own terms, and it matches an already-verified pattern this site has found convergently in reinforcement learning and elsewhere. All three case studies name real mechanisms — a Triton default, a GIL-holding C++ call, a redundant per-tile computation — and all three survive contact with source. PR #1180 is real, merged 2026-08-27 as commit 465b4bc, six files, +140/−13. DeepEP v1.2.1 really does hold the GIL through intranode_dispatch's CPU spin while internode_dispatch, 348 lines later in the same file, already releases it with a comment naming KV transfer as the reason. And the KDA decode kernel's “four times” is head_dim 128 from the released config.json over BV = 32 hardcoded in fla/ops/kda/fused_recurrent.py.
Thin. Every headline number — 3.22× (rounded to “roughly 3×” and “tripling”), 13 days, ≥100,000 accelerators, 62 trillion tokens in six days, 1.71×, 9.6%, the 20%-to-1% GIL result — is asserted in prose or printed on a chart, with no absolute units, no named hardware, and no published script or log behind any of it. The GIL fix has no linked commit, and was never upstreamed: DeepEP at a56d615, the day before Z.ai published, still has exactly one gil_scoped_release in the whole repository, and it is not in either intra-node call.
Mis-framed, gently. “Tripling end-to-end throughput relative to the initial baseline” is accurate to the chart and still the weakest form the claim could take, since a first working run on hardware nobody had run at this scale before is nearly the lowest bar a multiplier can clear. The fix in the one linked artifact is opt-in and off by default, reachable only by a Python keyword argument on the distributed CP path — true to what the code does, understated by the post's one sentence about it. The post's two-line tl.dot pseudocode undercounts a six-call-site diff. And the sentence that does the most work in the whole piece — “Both hardware utilization efficiency and per-token cost reached levels comparable to mainstream NVIDIA GPUs” — carries no number at all, which is a heavier claim to make on an accelerator nobody will name than the 3× it is quietly leaning on.
The thing worth keeping is not the 3x. It's that a lab publishing a triumphant “our model helped build itself” narrative also published, in the same post, the one piece of it a stranger can independently verify — and that piece checked out, with a nuance the summary left on the floor. That is a better ratio of “checkable to asserted” than most infrastructure announcements manage, even though it is nowhere near the ratio the post's title implies.