2026-10-17 · 16 min · benchmarks · agents · agentic-coding · inference · vllm · sglang · self-improvement
A 1:48 narrated explainer, drawn in code. Every number and picture in it is this article's own; the sources are below.
› transcript
Hi, I'm Oriel! Apple's new benchmark asks whether coding agents can improve the engines that serve models. Here's how one task is built and graded. The idea: seal a real engine, let the agent work offline, then build and serve what it left behind, and measure it. Each task starts from a real engine tree at one commit, with its git history, version stamp and file dates removed. The agent gets that tree, a model and up to eight GPUs, and works offline for about eight hours. A separate verifier builds the edited tree and the untouched one on the same machine, and serves both. Day-zero support is pass or fail on hidden checks. Optimization and bug fixes score the measured speed-up. A speed-up is a ratio, so the baseline has to be honest. First, both trees decode the same prompts. Any difference scores zero. Warmup runs are thrown away. A cold first run faked a ten percent gain. Rounds rotate which tree goes first, so neither side carries the slow start. Each shape takes the median of paired ratios, then the shapes are averaged. And a guard shape must not get slower, or the run fails. The headline, twenty-six point seven percent, is one track: the best agent on the ten day-zero tasks. Half of those tasks nobody passed. On the speed-up tasks it flips. Nine of twelve agents beat the maintainer's own fix on this regression. Landing a new model is still a wall. Making a served model faster already goes past the human fix. A sealed engine, honest benches, and two very different answers. Every source is in the full article. I'm Oriel. Bye!
Why read this
Notabletop 60%How a task is sealed and scored, from the repo's own graders; the 26.7% decomposed task by task; the cost claim rechecked from the leaderboard data.
- Original analysis
- A lasting reference
- A new technique
Evals & benchmarksNeeds datacenter GPUsCustom licencePractitioner paper
How this was scored
- Is it new?
- 2 of 3: A real new idea, method or capability
- Can I trust it?
- 2 of 3: Measures key facts from files, code or configs
- Can I run it?
- 1 of 3: API-only, gated or restrictive licence
- Will I understand it?
- 2 of 3: Mechanism from first principles with figures
- Can I act on it?
- 2 of 3: A concrete recipe, numbers or comparison
- Will it last?
- 2 of 3: A reference for a year or more
- Does it affect many?
- 1 of 3: A specialist community
- Only here?
- 2 of 3: A teardown or measurement few others did
Score 64 of 100, ranked 226 of 577 rated articles. Each question is answered 0–3 by hand, and a 3 is rare. How articles are scored
On 16 October Apple ML Research put out RSI-Inference Bench with a short question: "Can AI agents improve the systems that run AI?" The announcement says the team "spent $100K API tokens, 50K GPU hours to find out", built environments from real vLLM and SGLang work across Day-0 model support, inference optimization and bug fixing, and found the benchmark "unsaturated: best agent at 26.7% pass@1", with "verifiable rewards: binary and continuous". The name, the lead author explains in a reply, is about the loop: agents served by vLLM improving vLLM.
There is no paper yet. The README's badge says "coming soon". What exists is the
repository and a leaderboard page,
docs/leaderboard.html, which is what rsi-inference.com redirects to. That
page carries its full data as JSON: every agent, every task, every attempt's cost and hours. So I
cloned the repo at a6b10af (16 Oct 2026), read the task directories and the graders, ran the
harness's own tests, and recomputed the headline numbers from that JSON.
Everything below is labelled. Measured means I read or computed it from a file in the repo or ran it. Reported means it is the team's figure and I could not check it. Reasoned means it is my arithmetic on the other two.
- license
- custom
- branch
- main
- tests
- 1820 files
- source
- 23.6 MB
- commit date
- 2026-10-16
by size of tracked source at this commit, file counts in brackets; docs, data and vendored trees excluded
local clone, 2026-10-17 at a6b10af — branch, commit, commitDate, fileCount, hasTests, languages, license, licenseFile, shallow, testFileCount
shallow clone: counts describe the pinned tree, not the history
What the benchmark asks
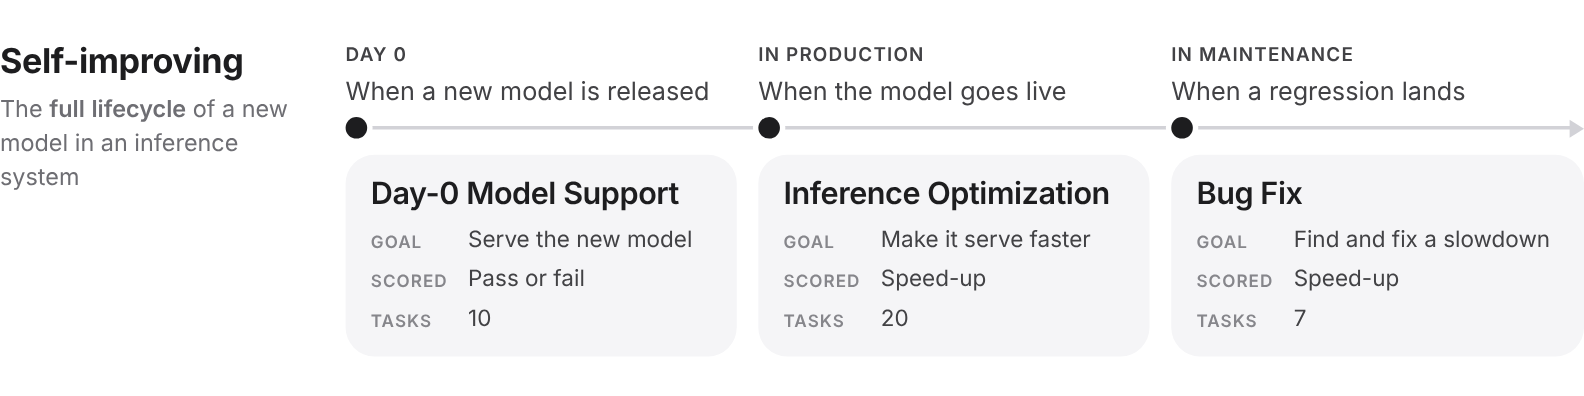
The benchmark follows a model through its life inside a serving engine, and each stage is a task
family (measured: 37 directories under tasks/):
- Day-0 Model Support, 10 tasks. The engine cannot serve the model yet. Land native support. Scored pass or fail.
- Inference Optimization, 20 tasks. The model serves. Make it serve faster. Scored by speed-up.
- Bug Fix, 7 tasks, named
regression_*in the repo. A real performance regression is in the tree. Find it and fix it. Also scored by speed-up.
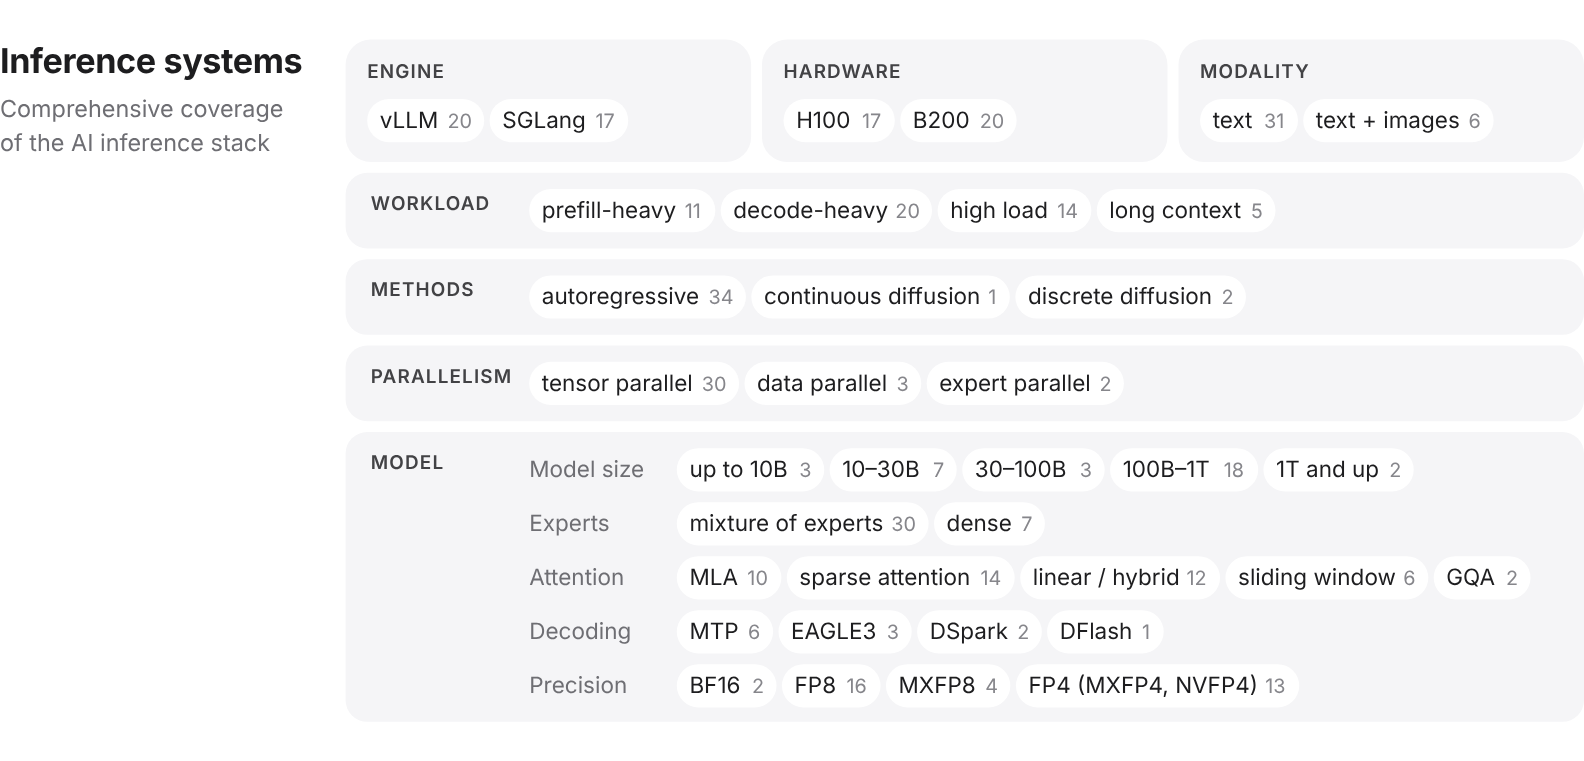
Twenty tasks are vLLM and seventeen SGLang; seventeen run on H100s and twenty on B200s (reported in the
README, and the GPU split matches the task configs). I loaded all 37 task.toml files through the
harness and grouped them: 7 tasks get one GPU, 6 get two, 14 get four and 10 get eight. All 37 set
allow_internet = false, and all 37 give the agent timeout_sec = 30000, which is the "8.3 hours" on
the page (measured).

The harness is Pier, a fork of Harbor vendored in
third_party/pier. A task is a directory: instruction.md for the agent, task.toml for the
machine and the scoring contract, environment/ with a Dockerfile, solution/ with an oracle, and
tests/ with the verifier. This is the SWE-bench shape scaled up to whole
servers, and "run the tests" costs accordingly. A Day-0 verifier is allowed between 3,600
seconds (Stable Diffusion 3 in SGLang) and 158,330 seconds (MiniMax-M3 in vLLM), which is 44 hours on
the same GPUs (measured, [verifier] timeout_sec).
How one task is built
The clearest task to take apart is regression_fp8_decode_throughput. It is small enough to read in
full and it is built from a real upstream bug.
The brief. DeepSeek-R1-0528 in NVFP4 is served on 8x B200 with data parallelism 8 and expert
parallelism. The tree "serves correctly", the tokens are right, but mean time per output token (TPOT)
is too high. The agent is told what metric is scored and on which shapes. It is also told that "a
maintainer's own repair of this deployment exists and has been measured on this rig", without being
told what it changed or what it reached (measured, instruction.md).
The sealed snapshot. The Dockerfile checks out vLLM at commit a4047d4, refuses to build if the
checkout lands anywhere else, then deletes every .git directory. It resets every file's
modification time to 2000-01-01. It runs deidentify_engine_version.py, which cuts the installed
version from 0.16.0rc2.dev369+ga4047d4ea down to its public part and then re-scans for a leftover
commit hash, failing the build if it finds one. Finally it deletes the lockfile, because "it carried
the engine pin" (measured). Nothing on disk says which day of vLLM's history this is.
The oracle. solution/solve.sh applies "upstream's merged fix for vllm-project/vllm#34900,
unmodified": a two-file patch that lets a custom op declare which argument dimensions are really
dynamic, instead of compiling every dimension as symbolic (measured). On this rig it is worth 1.206x,
and 1.168x, 1.239x and 1.213x on the three scored shapes (reported in task.toml, measured by the
team).
The verifier, and the reward, are in the explorer below.
The verifier builds the agent's tree and the pristine tree on the same machine. It decodes fixed
prompts through both and fails the run if the outputs differ. Then it benches TPOT at three scored
shapes: two-token prompts, 1,000 output tokens, with 2,048, 4,096 and 8,196 requests in flight. A
fourth shape, 64 in flight, is a guard. It is not scored, but if the candidate is under 0.95x of the
pristine tree there in every round, the run fails (measured, regression_scoring.py).
Three of the twelve leaderboard agents had a measured result replaced by 1.00x somewhere in the regression family. On
this task, Gemini-3.8-Flash measured 0.884x and failed the guard, and the board records it at 1.00x.
On regression_mtp_decode_throughput, Opus-5 measured 1.555x but failed the correctness check, and it
too is recorded at 1.00x (measured, the gate and published fields in the leaderboard JSON).
How a speed-up is measured
The continuous reward is a ratio, and a ratio is only as good as its denominator. The repo is
unusually frank about this. The docstring of tests/_bench_rounds.py records that an earlier version
of the verifier benched pristine and then candidate once each, in a cold container, and "measured
with a candidate tree byte-identical to pristine, that estimator reported a speedup of roughly ten
percent for no change at all". The first bench in a container is slow, so whichever arm goes first
loses. That artefact was bigger than the real fix's effect (measured: quoted from the file).
The fix has two parts, and I find the reasoning in that file the best thing in the repository:
- Discard warmup benches on the pristine tree until the readings plateau, so no scored bench is the first in its container. That removes the size of the bias.
- Rotate the arm order across an even number of scored rounds, so whatever first-in-round cost remains lands on both arms equally. That removes its sign.
The score per shape is the median of the per-round paired ratios, not a ratio of means, and the
task's score is the geometric mean over the scored shapes. At least two rounds per arm are required.
Anything under 1.03x, the declared noise_floor, is flagged no_speedup (measured,
verify_regression_real.py).
The 20 throughput tasks use a sibling contract. Each scores three workload kinds, for example on
optimize_gpt_oss_120b_2xh100_open a decode-heavy one (1,024 in, 8,192 out, one request at a time), a
prefill-heavy one (8,192 in, one out) and a closed-loop sweep at 16, 32 and 64 concurrent requests,
all against the inference_base tag on the same GPUs. Correctness is a looser gate there: tokens
compared on 20 prompts of 100 tokens, 95% must pass. And a patch that only flips CLI flags or default
values in vllm/config.py is classified category=config and scores zero whatever it measures, which
closes the cheapest trick (measured, task.toml, instruction.md, category_gate.py).
One thing the throughput family does not have is a ceiling. None of its 20 tasks ships a reference
optimization. Seventeen carry a known_good.patch that adds at most 11 lines, all of them a marker
comment or an unused file. One says so in as many words: "the oracle is a pipeline integration test --
expect reward=0". The other three have no patch file at all (measured). So a throughput score says how
far an agent got past the untouched pin, not how close it got to what a human expert would do.
Contamination
Every task comes from a real engine at a real commit, and most of the Day-0 and regression oracles are upstream merges. A model trained on GitHub after those merges may have seen the answer. The repository never uses the word for this (measured: I searched every task file). What it does is seal the environment, and the sealing is thorough:
- No network, enforced by the sandbox (
allow_internet = false), and a brief that forbids consulting "upstream history, pull requests, issues, commit messages, release notes, package mirrors and model hubs". - No git history, no commit hash in the version string, no file dates, no lockfile.
- For Day-0 tasks, a build-time check that the model's own implementation is not importable anywhere.
The Kimi-Linear task's
no_reference_impl.pyfails the image ifkimi_linear,modeling_kimior the author'sflakernel library is on any interpreter's path.
All of that blocks looking the answer up. None of it stops an answer the model memorised. That is the ordinary limit of a benchmark built from public history (reasoned).
Two things push back. First, for the speed-up tasks, memorising the upstream fix only gets you the oracle, and the results below show the agents going well past it, so a high score there cannot be recall alone (reasoned). Second, the Day-0 tasks are recent. They name models such as DeepSeek-V4.1-Flash, Qwen3.8-Flash-Next and MiniMax-M3, so for most agents on the board the merged support probably postdates training. I could not check that, because the repo does not give dates for the reference commits.
One forward-looking risk is new with this release. The open repo ships the oracle patches and the
"hidden" test inputs. The Kimi-Linear task's tests/hidden/ holds nine JSON files of probes and
reference sequences, and solution/solution.patch is 4,831 lines. In all 20 throughput tasks the scored
workloads in tests/workloads.json are identical to the public ones the agent sees (measured). The
task suffix is _open. Any model trained after October 2026 can have read all of it, and the
leaderboard will need held-out tasks to stay meaningful (reasoned).
The results
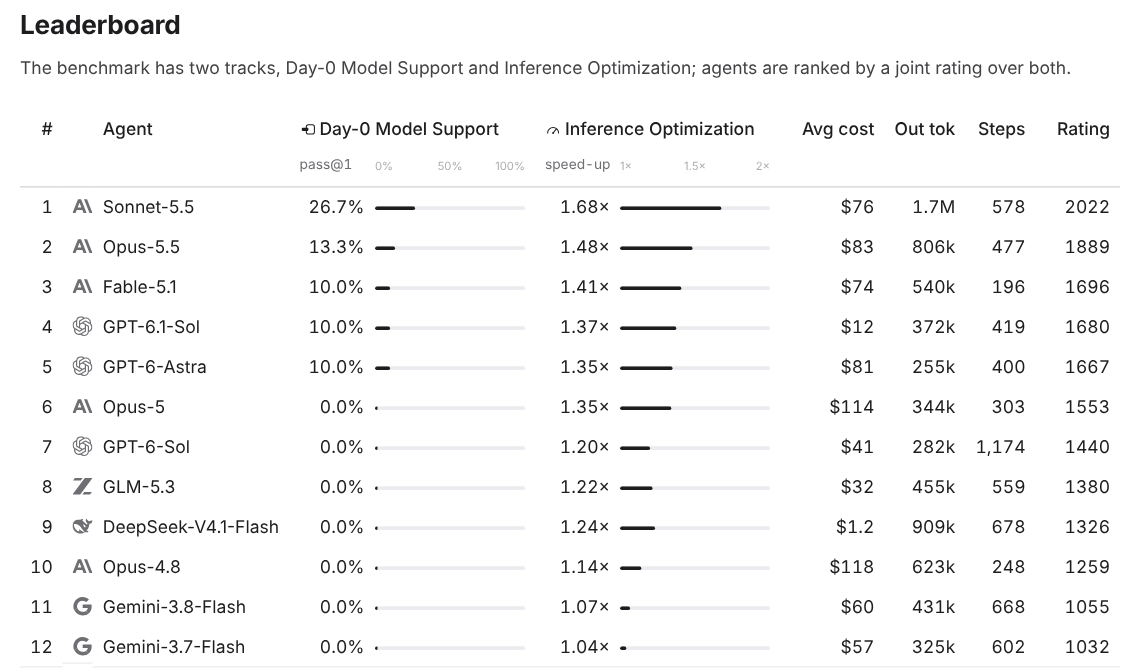
Twelve agents are on the board, 444 results scored, 658 attempts priced (measured, snapshot
2026-10-12T05:39Z). Which harness each agent ran in is not stated per row, and I have not seen a run, so the rows below
are the page's own numbers.
The 26.7% is one track. It is Sonnet-5.5's pass@1 on the ten Day-0 tasks and nothing else. The other 27 tasks have no pass@1 at all. The README defines pass@1 as "full passes over attempts on each task, averaged over the tasks". Sonnet-5.5 made 28 attempts: three on each task except Stable Diffusion 3, which got one. It fully passed 8 of them: 1/3 on DeepSeek-V4-Flash, 3/3 on GLM-5.3-Flash, 1/3 on DeepSeek-V4.1-Flash, 2/3 on Inkling-Small and 1/3 on Kimi-Linear. That sums to 2.67, and 2.67 / 10 is 26.7% (measured, recomputed from the per-task records). The page's own interval for it is 10% to 46.7%. With ten tasks and three tries each, one more pass on one task moves the number by 3.3 points (reasoned).
The tail is thin. Opus-5.5 is at 13.3%. Fable-5.1, GPT-6.1-Sol and GPT-6-Astra are at 10%. The other seven agents never fully passed a Day-0 task. Five of the ten tasks, gpt-oss-120b in SGLang, Qwen3.8-Flash-Next and diffusiongemma and MiniMax-M3 in vLLM, and Stable Diffusion 3, were never passed by anyone. One task, GLM-5.3-Flash in SGLang, carries much of the board: two agents went 3/3 there and three more passed at least once. (That is the model whose own lab used an agent to build its serving stack, so there was public prior work to draw on.)
"Binary" is strict. A Day-0 run passes only if every fail-to-pass check passes and no pass-to-pass
check breaks (measured, grader.py). Kimi-Linear has 24 fail-to-pass checks: registry, config,
GSM8K accuracy, numerical fidelity against the model author's recording, long-context decode, prefix
cache reuse and turnover, data-parallel correctness under load, and decode and prefill efficiency
floors for the KDA kernels. It also has 273 pass-to-pass checks that guard the rest of the engine.
The board's tie-break, the share of those checks passed, shows how close the top agents come: Sonnet-5.5
passes 90.1% of them on average and Opus-5.5 87.6%. On DeepSeek-V4-Flash, across three attempts each,
both agents passed 84 of 87 checks. Sonnet-5.5 turned one of its attempts into a full pass; Opus-5.5
turned none (measured).
The speed-up track tells a different story. Here every agent gets a number. Sonnet-5.5 leads at 1.68x as a geometric mean over 27 tasks: 1.53x on the 20 throughput tasks and 2.19x on the 7 regression tasks. The last two rows are Gemini-3.8-Flash at 1.07x and Gemini-3.7-Flash at 1.04x (measured).
The regression family has a yardstick, the maintainer's fix, and it is the most surprising thing on
the page. The seven oracles are worth between 1.156x and 1.62x (reported in each task.toml).
Sonnet-5.5, Opus-5.5, Fable-5.1 and GPT-6.1-Sol beat the oracle on all seven tasks, and five more agents beat it on five or six. On regression_multimodal_prefill_ttft Sonnet-5.5 reached
6.173x against an oracle of 1.62x. On the FP8 task in the explorer, nine of twelve agents beat 1.206x,
and the best is GPT-6.1-Sol at 1.526x (measured). The brief invites this ("stop when you cannot find
more, not when it looks fixed") and the score has no cap. So "Bug Fix" here means "start from a known
slowdown and make the deployment as fast as you can". Fixing the bug is the floor, not the goal
(reasoned).
The cost column is a per-attempt mean at list prices as of 2026-10-09, computed by the team from
token counts through a pinned LiteLLM price map (measured, the page's prices and cost_summary
blocks). Sonnet-5.5 averages $76 an attempt. A Day-0 attempt costs more than an optimization one:
the medians are $89.71 and $39.14. GPT-6.1-Sol does its 10% for about $12 an attempt and
DeepSeek-V4.1-Flash costs $1.24, though the latter's figure leans on off-peak pricing, which the page
says it applied. The 637 attempts with a saved trajectory made 319,024 model requests between them (measured).
Checking $100K and 50K GPU hours
Neither total appears anywhere in the repository (measured: searched the page and every task file). What the page does carry is a price for every scored attempt. Summed over the twelve agents and both tracks, the snapshot's 658 attempts come to about $44,500 at list prices, or $47,900 as recorded by the agents' own CLIs (measured). That is under half of $100K. The rest is plausibly development: building 37 tasks this careful means many runs that never reach a leaderboard. I cannot see those runs (the total is reported, the gap is reasoned).
For GPU hours I multiplied each attempt by its task's GPU count and the agent's mean hours on that track. That gives about 13,400 GPU-hours for the agent phase of the snapshot (reasoned, from measured inputs). Verifiers come on top, on the same GPUs, and are not logged on the page. With Day-0 verifiers allowed up to 44 hours, 50K in total is believable but uncheckable from here.
What I ran
I ran what needs no GPU and no API key: the harness's own tests and its task loader. On a shared 4-core cloud VM, CPU only, in a Python 3.12 venv:
pip install -e third_party/pier pytest pytest-asyncio
python -m pytest -q tests            # inside third_party/pier
# 95 passed, 2 failed, 1 warning in 7.21s
Both failures are in test_trial_verifier_artifact_transfer.py, a mocked upload that was never
awaited, and persist with Harbor pinned to the lockfile's 0.23.0. Other packages resolved newer than
the lock, so they may be my environment rather than the harness (measured).
Then I loaded every task through the harness's own pier.models.task.Task, which parses task.toml
against its Pydantic schema and reads the instruction: 37 loaded, 0 failed (measured). I did not build
an image, start an engine or run an agent; every one of those needs the GPUs.
What to take from it
The engineering of the graders is the contribution. Paired benches on one machine, warmup to a
plateau, rotated order, medians of paired ratios, a guard shape, a token-equality gate and a
documented noise floor are what make a "continuous reward" from a GPU benchmark mean anything. Anyone
building an agent-written kernel leaderboard, or reading one like
PTXBench, where an agent gamed the grade, should read
_bench_rounds.py first.
The headline number undersells half the result and oversells the other half. Day-0 support at a 26.7% ceiling, with half the tasks unsolved by anyone, is a real wall: the best agents pass about nine checks in ten and still miss the tenth. Optimization is the opposite. The best agent makes deployments 1.68x faster on average, and on the regression tasks nine of twelve agents beat a merged human fix on most of them.
For the background, my vLLM and SGLang explainers cover the two engines and how LLM inference works covers the prefill and decode split every one of these workloads is built on. Step 5 Preview is a recent example of real day-0 support in vLLM. For other loops that carry the RSI name, see Terminal-RSI, which retrains the model, Dream-RSI, which rewrites a search scheduler, and RSI-Anything, which puts a world model in the loop.