2026-10-11 · 21 min · agents · harness · self-improvement · benchmarks · agentic-coding · kimi
Why read this
Solidtop 85%Reads LobeHub's own FrontierHarness runner and the benchmark's per-task data to show why 21/30 with selected retries cannot rank thirteen harnesses.
- Original analysis
- Concrete numbers to act on
- Explained from first principles
Agents & harnessesAPI onlyPractitioner teardown
How this was scored
- Is it new?
- 1 of 3: An incremental tweak
- Can I trust it?
- 2 of 3: Measures key facts from files, code or configs
- Can I run it?
- 1 of 3: API-only, gated or restrictive licence
- Will I understand it?
- 2 of 3: Mechanism from first principles with figures
- Can I act on it?
- 2 of 3: A concrete recipe, numbers or comparison
- Will it last?
- 1 of 3: Relevant for months
- Does it affect many?
- 1 of 3: A specialist community
- Only here?
- 2 of 3: A teardown or measurement few others did
Score 55 of 100, ranked 338 of 494 rated articles. Each question is answered 0–3 by hand, and a 3 is rare. How articles are scored
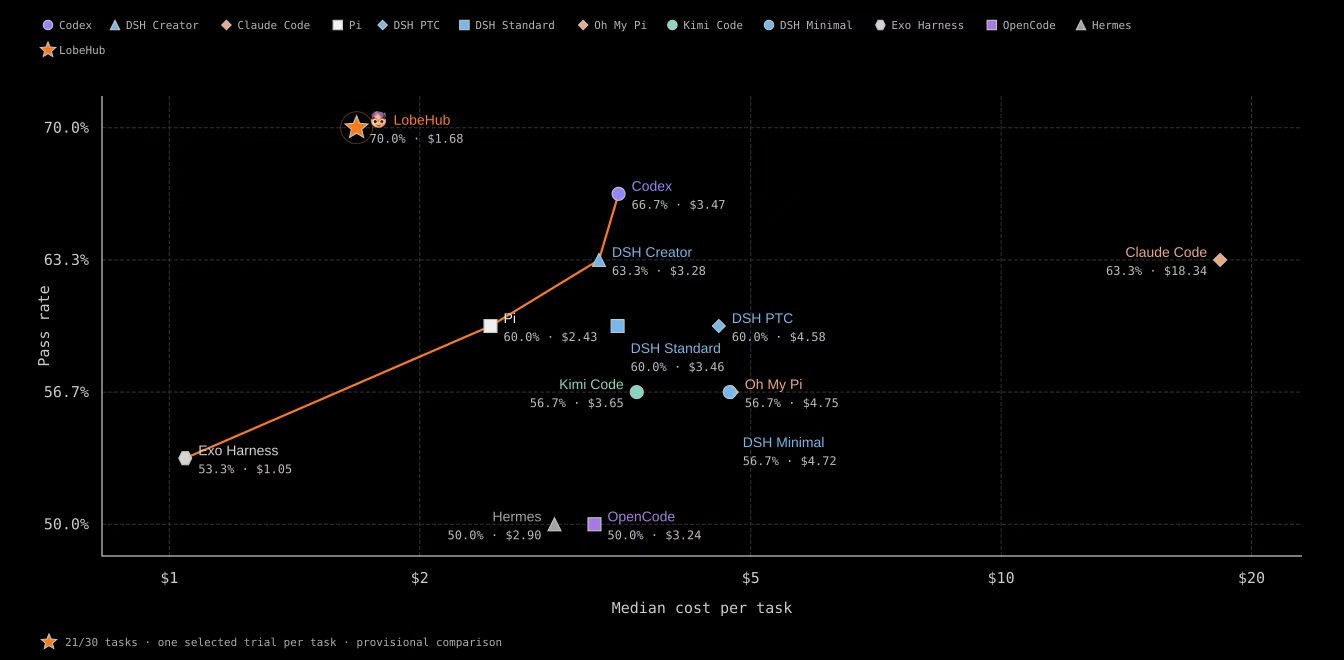
On 10 October LobeHub posted the result of an experiment they had been running for seven days. They pointed Lobe Agent at its own harness, let it "explore and optimize" for a week with what they call their RSI framework, and then ran the resulting agent on FrontierHarness with Kimi K3 as the model. The headline: 70.0% pass rate, 21 of 30 tasks, "ranking #1 among 13 harnesses in our preliminary comparison", at $1.68 per successful task against $3.47 for Codex and $18.34 for Claude Code. Median cache-hit rate 86.2%, median completion time 7m 19s.
The post is careful in places. It says the comparison "includes selected retries and differences in execution environments, and should not be interpreted as an official leaderboard ranking", and that the scripts, trajectories and a technical report are planned for release. It is less careful in the chart, which puts a big orange star above everyone else.
I wanted to know two things. What did a week of self-optimisation change in the harness? And can thirty tasks rank thirteen harnesses at all? The first question has no answer yet. The second has a fairly firm one, and it comes from the benchmark's own data.
Thirty tasks, one model, one attempt
FrontierHarness Eval is not a LobeHub benchmark. Runta, a company that sells isolated agent runtimes, built it and published it on 1 September 2026 (blog post by Shilin Zhu and Shiqi Mei; data and scripts at frontier-harness-eval/eval). The design is the one the harness effect argued for: hold the model fixed, change only the loop around it, and see what moves.
- 30 tasks: 21 from Terminal-Bench 2.1 and 9 from DeepSWE (Datacurve's feature-request tasks on real repositories). Every task has a deterministic verifier.
- One model, Kimi K3, served through Fireworks, behind one gateway that speaks both the OpenAI Responses API and the Anthropic Messages API, so each harness talks its native protocol to the same weights. Runta picked K3 so no harness got a home model; Kimi K3 has its own page here.
- Twelve configurations of nine harnesses: Codex, Claude Code, Pi, Oh My Pi, Kimi Code, OpenCode, Hermes, Exo Harness, and DeepSeek's dsh in four presets. 360 runs.
- One attempt per cell.
benchmark.jsonsays"canonical_selection": "first valid attempt 1", and the blog says why: "Retries are warmer by definition, and best-of-N selection would bias quality upward." Each run is a fresh restore of a golden checkpoint, memory state included, and no benchmark task is ever run before the formal sweep because a debug run leaves the provider's prefix cache warm for hours.
That last rule matters for everything below. The benchmark was built to make one attempt per task meaningful, and the thing LobeHub changed was exactly that.
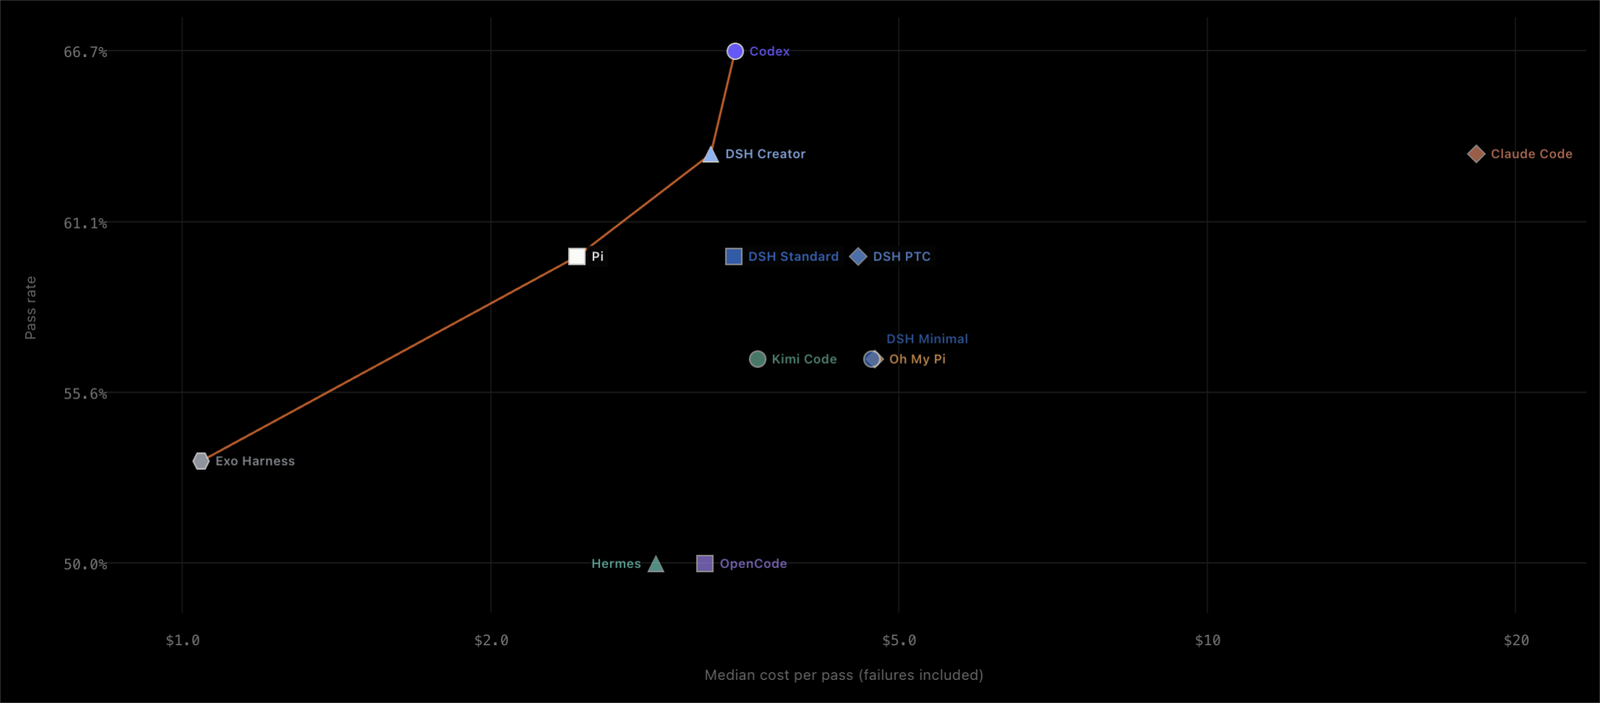
I pulled results/eval-data.json and counted the per-task outcomes. Of the 30 tasks, 12 were
passed by all twelve configurations and 3 were passed by none. Only 15 tasks separate one harness
from another. Every published pass rate sits between 15 and 20 tasks, so the whole published
field, top to bottom, is a five-task spread on a fifteen-task discriminating set.
What LobeHub actually ran
The post does not say how the run was set up, but LobeHub's main repository does. Their agent
skills include .agents/skills/run-eval-harbor/, a runner for "Harbor or FrontierHarness
evaluations against local production LobeHub or LobeHub Cloud", with one script for a local or
SSH Docker host and one for Runta.
Reading it explains "differences in execution environments" better than the post does. The
benchmark's baselines run each harness inside the task container. LobeHub's adapter
(scripts/lh/) installs the lh CLI in the container and connects it as a device to LobeHub
Cloud; the agent loop runs on LobeHub's servers and sends tool calls down to the container. Three
details from the code:
- The model is not fixed by the benchmark.
frontierharness-local.py:329records the note "The Cloud agent selects the model; kimi-k3 is the recorded reporting label and frozen benchmark prices are used for comparison." The Runta playbook says the same, and asks the operator to verify the agent's model before a comparable run. - The task network is opened for the agent. The playbook rewrites each task's
[agent].network_modetopublicso the CLI can reach LobeHub Cloud, and checks that verifier and environment settings are untouched. - The topology differs. The local script records "Docker executes tasks on a shared host without
checkpoint restores; image caches persist", and the Runta playbook says to record the run as
two-shared-runta-runtimes: "it is not the published one-fresh-Runta-runtime-per-task topology, so do not silently compare the resulting score with that baseline."
The collected run record sets "methodology_comparable": False (frontierharness-local.py:324).
And the helper that adds LobeHub's icon to the chart, frontierharness-chart-icon.mjs, rewrites
the footnote to "LobeHub · local Docker run · shown for context, not ranked". The published chart
says "provisional comparison" instead, and the post says "#1".
None of this is hidden. It is LobeHub's own code, in public, and it describes an honest internal run carefully. What it describes is a run for context, which the post then ranked.
What did the week change?
This is the question several repliers asked, and the one I cared about most. "Most 'rsi' runs i've seen just reword the prompt", one wrote. "Would love to see the harness changes alongside the trajectories."
There is no diff. No repository called anything like lobehub/rsi is public (I probed the
obvious names; all came back private or missing), the post links only to Awesome-RSI, and the
promised report is not out. So I cannot tell you whether the agent changed prompts, tools, context
compaction, retry policy or caching. Anyone who does is guessing.
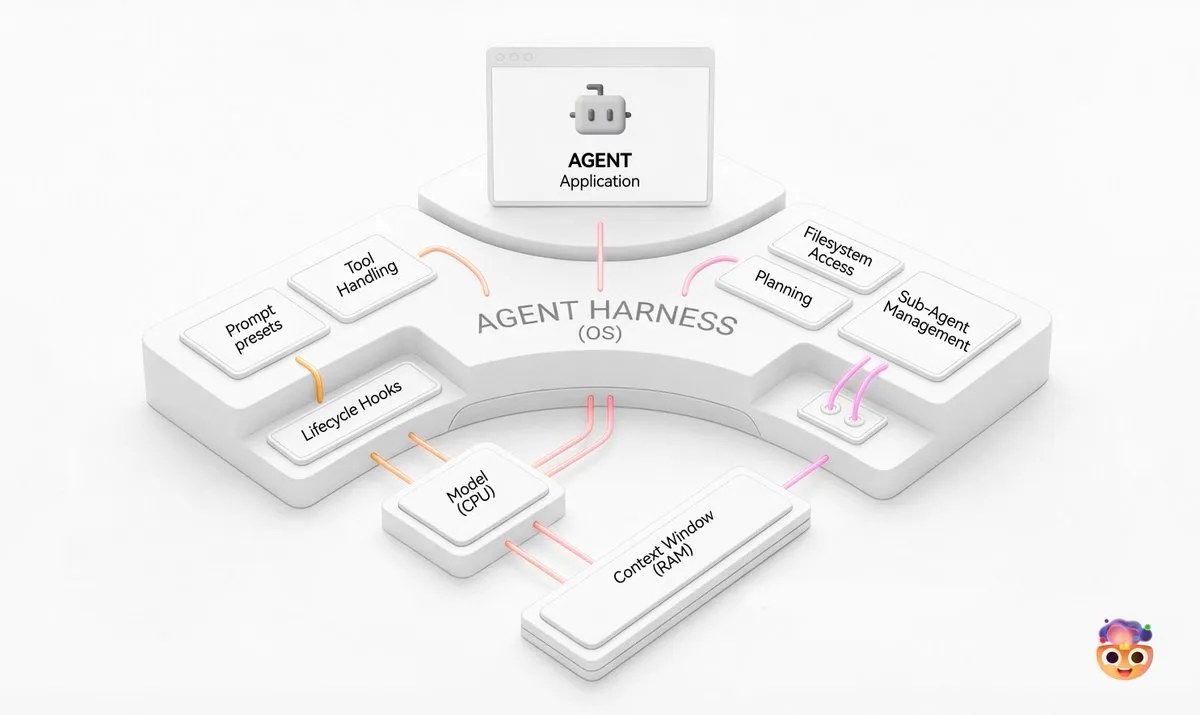
What is public is the substrate, and LobeHub described its direction in May in "Build a Harness That Builds Itself" by Arvin Xu. The argument is that the harness is an operating system for the model, and that it goes stale as models and providers change.
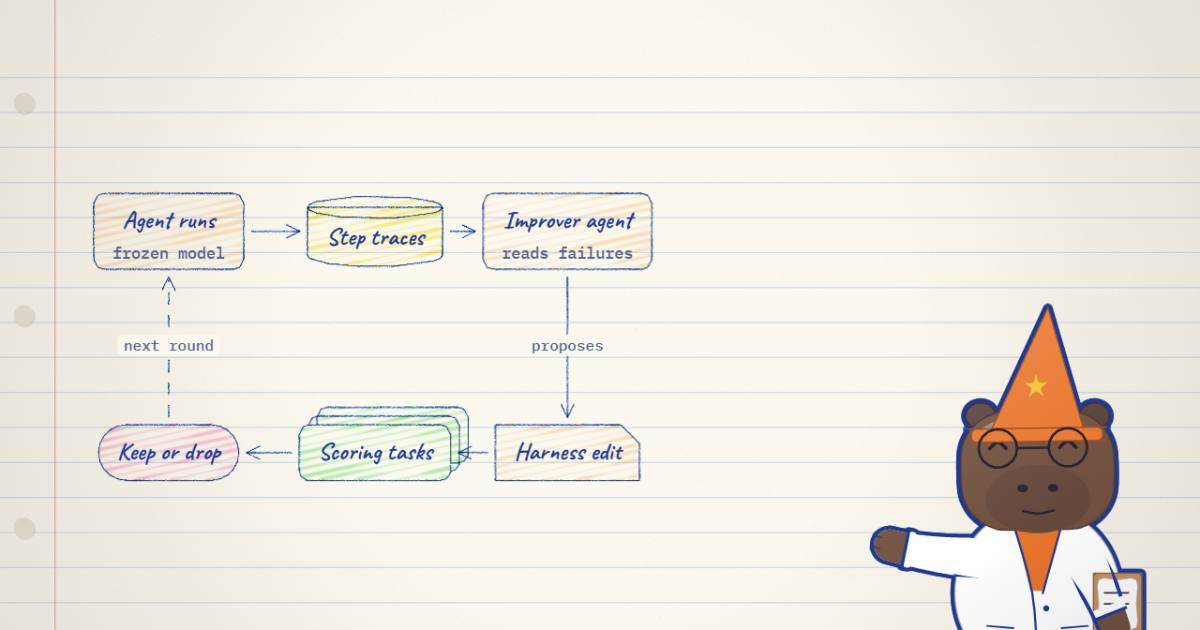
The concrete loop in that post is narrower than "RSI". Every agent run is recorded step by step
(packages/agent-tracing in the repository). An agent reads failed traces in bulk, buckets
errors by provider, type and message, compares them against a library of known patterns, updates
matching rules for user-side errors itself, and files root-cause tasks for genuine harness bugs.
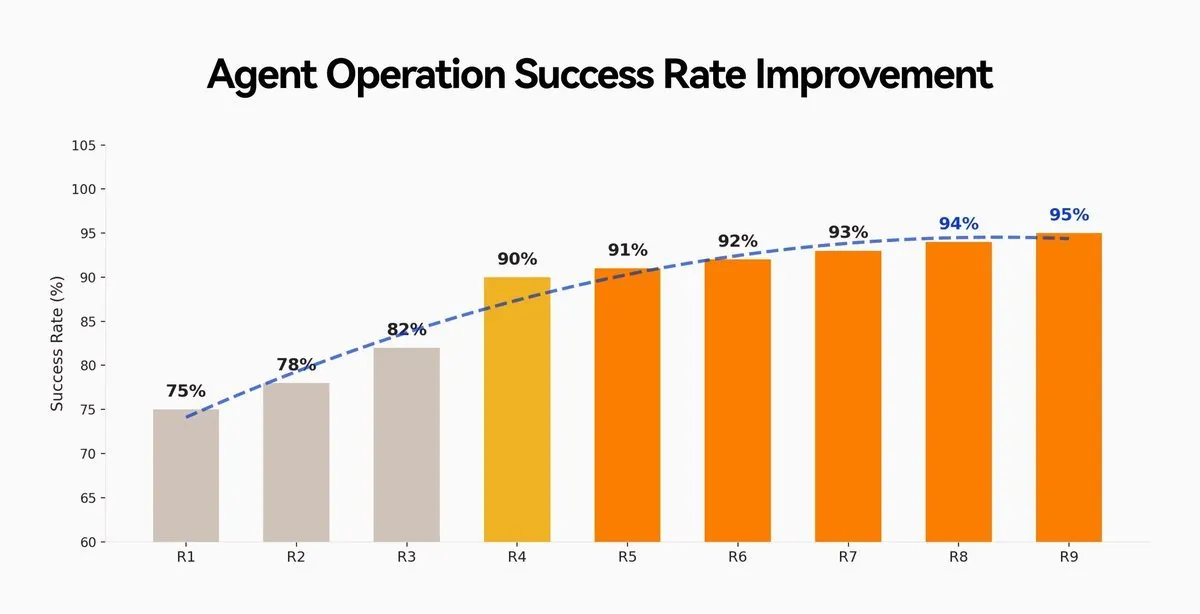
Over nine rounds the pattern library grew from 31 to 104 entries while new patterns per round fell
to zero, and the agent surfaced 20+ harness defects along the way: incompatible tool schemas, a
negative max_tokens, dropped DeepSeek reasoning_content, context overflow. LobeHub reports
production agent success rising from about 75% to above 95% over those rounds.
The repository has grown since. packages/agent-tracing now ships objective tool-result metrics
(analysis/toolFeedback.ts scores each tool result for token count, self-redundancy and markup
noise, "to rank which tools pollute the context window"), a context linter, and a replay command
that re-scores a trace with the same LLM-judge rubric the eval pipeline uses. The trace metadata
records the context engine's "cache-warmth gates". And apps/server/src/services/goal/ holds an
opt-in exploration mode for long-running Goals: a baseline experiment, then a planner that may
only expand (derive a new experiment from an earlier one), revise (rerun one with a corrected
protocol) or verify (ask for independent acceptance), under a --max-experiments cap.
A week-long harness search would need exactly this machinery: per-step traces, cheap signals about which tools and context waste tokens, a replay judge, and a bounded experiment graph. Whether the RSI run used any of it, I don't know; nothing in the repository is labelled RSI. The plausible reading of 86.2% median cache hits and $1.68 per pass is that the week found ways to waste fewer tokens. That is a guess, and the report should replace it.
One question matters more than the diff. A reply asked whether the 30 evaluation tasks were kept out of the optimisation loop. The tasks are public, and LobeHub's repository contains a working FrontierHarness runner, so an agent with its own repository in front of it could have run them. If the loop's fitness signal was FrontierHarness, then 21 of 30 is a training-set score. The recent harness-evolution papers treat this as the central risk: RRSI adds a leakage critic and annealed edit budget precisely because harness search on a fixed task set memorises it, and ModularRSI evolves against 2,000 tasks disjoint from its evaluation benchmarks. LobeHub's post does not say which tasks the agent optimised against.
Can 21 of 30 rank anything?
Every pass rate here is k out of 30, and a binomial proportion on n = 30 is wide. At a true pass rate of 0.6 the standard deviation of the count is about 2.7 tasks. The 95% Wilson interval for 21/30 runs from 52.1% to 83.3%. Codex's 20/30 runs from 48.8% to 80.8%. Hermes and OpenCode at 15/30 run from 33.2% to 66.8%. All of those overlap.
Overlap of intervals is a loose test, so I ran proper ones. Fisher's exact test, 21/30 against 20/30, gives p = 1.0. Against the bottom of the field, 15/30, it gives p = 0.187. With thirty tasks, 21 passes would be distinguishable from another harness's count at p < 0.05 only if that harness scored 12 or fewer. Nobody in the field did.
That test ignores that every harness saw the same tasks, which throws away information. The published baselines come with per-task results, so between two baselines I can run an exact McNemar test, which looks only at the tasks where they disagree. Across all 66 baseline pairs the smallest p-value is 0.0625: Codex against Hermes, where Codex passed 5 tasks that Hermes failed and Hermes passed none that Codex failed. Even the top-versus-bottom gap in the published field is not separable at the conventional threshold. Runta's own blog put it mildly: "The pass rates for all 12 configurations are close."
Click LobeHub and every other row stays grey. Click Alma, the top third-party candidate, and only Hermes and OpenCode turn red, at p = 0.0127. On this benchmark a ranking by pass rate is mostly a ranking by noise; the benchmark's authors seem to know it, which is why their write-up leads with cost.
Selected retries
Now add "one selected trial per task". If a harness runs a task more than once and keeps the best attempt, its score goes up even if nothing about it improved. How much depends on how many tasks are coin flips for it.
The baseline data gives a rough estimate. Treat each task's share of passes across the twelve configurations as the chance that an average harness passes it on one attempt. Summed over the thirty tasks that gives 17.4 expected passes, which matches the field's 209 of 360. Let that average harness keep the best of two attempts and it scores 20.0. Best of three: 21.6. Best of five: 23.5. The slider in the widget draws this as the dashed line.
This is a model, not a measurement. Harnesses differ, and a real harness is more consistent on its own task mix than the field average is, which would shrink the boost. But it shows the scale: selection on a handful of retried tasks is enough to move a mid-field harness to 21. The post does not say how many tasks were retried or how many attempts each got. Until it does, 21 of 30 is an upper bound on what this harness does in one try.
The field LobeHub left out
The "13" in "#1 of 13" is the twelve published configurations plus LobeHub. But other teams have already filed results against the same thirty tasks, as pull requests to the benchmark repository, each with one attempt per task:
- Alma, 25/30 (83.3%), $2.40 effective cost per pass, median 4m 32s per success (PR #16). Its report says it solved three tasks none of the twelve baselines passed.
- MiniMax Code, 23/30 (76.7%), $1.83 per pass repriced at the benchmark's price card, median 4m 33s (PR #13).
- KOT, 23/30 (76.7%), $2.83 per pass (PR #9).
- Maka, 23/30, a draft with final cost accounting pending (PR #18).
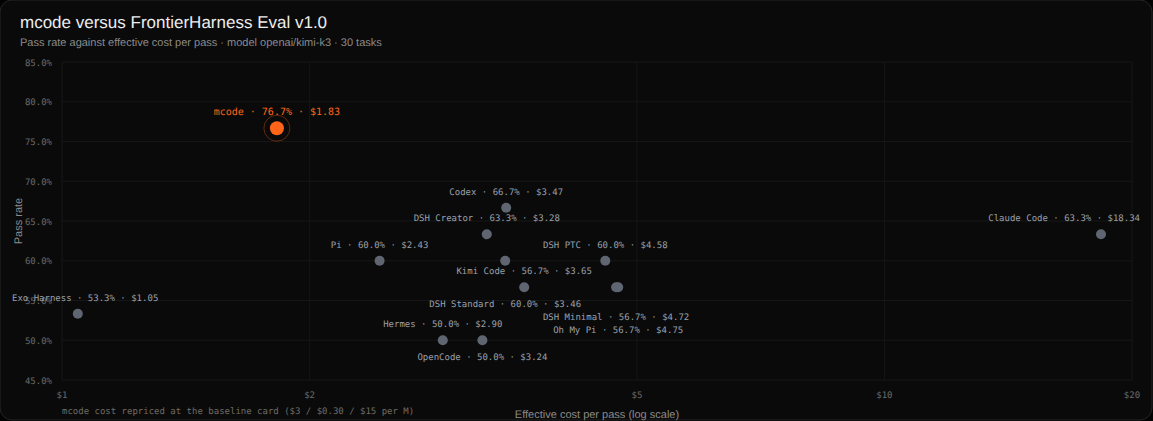
None of these is merged or verified either, and each has its own deviations: MiniMax ran Kimi K3
through Moonshot's API rather than Fireworks and rebuilt its checkpoint mid-run, Alma's run is
marked comparable: false by the normaliser, Maka used a custom relay. A reply under LobeHub's
post pointed at the MiniMax number. I would not rank any of them either. But if the comparison
includes self-reported, non-comparable candidates, LobeHub's 21 with selected retries is fifth of
the five that exist, not first of thirteen.
The cost numbers
The cost claim is the more interesting one, because cost is where FrontierHarness actually found large differences: pass rates within 17 points, cost per pass across a 17x range.
Start with a worry that turns out not to apply. Comparing cost per success across different
models would be meaningless; Claude Code on Claude and Codex on GPT bill at different prices. Here
every row used Kimi K3, and the benchmark reprices every run at one frozen card (pricing.json,
version kimi-k3-2026-08-20): $3.00 per million fresh input tokens, $0.30 per million cached
input tokens, $15.00 per million output tokens. Same model, same price list. That part is fair.
What is not settled is which metric $1.68 is. The chart's x-axis says "Median cost per task".
Asked in the replies whether that was the same as per successful task, LobeHub answered "per
successful task". The benchmark's own number is neither a median nor per task: effective_cost_per_pass
is the total spent across all 30 tasks, failures included, divided by the number of passes
(normalize-results.mjs:109). That is how Codex gets $3.47. LobeHub's runbook also distinguishes
the actual LobeHub bill (lh usage spend) from the repriced benchmark figure and says to report
them separately; the post gives one number. And with selected retries the question is whether the
discarded attempts were billed. If they were not, the numerator shrinks and the denominator grows
at the same time.
The second issue is the cache. The cost of an input token on this card is
where is the share of input tokens served from cache. Fresh tokens cost ten times cached ones, so the bill is driven by the misses: at the misses are 13.8% of input tokens but about 61% of input cost. A long-running agent re-sends a growing prefix on every call, which is why cache behaviour dominates these numbers.
The defaults are my back-solve: at 86.2% cache and an assumed 17K output tokens per attempt (Codex's mean, from the benchmark data), about 1.4 million input tokens per attempt lands near $1.68 per pass with 21 passes. Raise attempts per task to 1.5 and bill the discards, and the same run costs over $2.50 per pass. Untick the box and it goes back to $1.71.
Why Claude Code costs $18.34
The comparison against Claude Code is the eye-catching one, and Runta's write-up explains most of
it. Claude Code's median per-task cache-hit rate was 67.8%, but weighted by tokens it was 25.0%,
against 91.6% to 99.1% for every other harness. One task, python-statemachine-state-data-scoping,
took Claude Code 381 turns, cost $64.36, and ran at a 15.7% hit rate; it accounts for 68% of
Claude Code's input tokens by itself. Pi passed the same task for $2.50 at 98.2%.
Runta's diagnosis is harness-model fit, not a defect: Claude Code is built around Anthropic's explicit cache-control semantics, and K3 behind Fireworks exposes an implicit prefix cache. In one archived session the same append-only conversation was cached in full on roughly one call in five and not at all on the others. Runta writes that the $18.34 and $64.36 figures "describe the exact configuration we tested, not Claude Code in isolation". So "$1.68 against $18.34" mostly measures how badly Claude Code's caching transfers to this gateway, not how good LobeHub's harness is.
The fair comparison is against the harnesses with healthy caches. Codex ran at an 88.0% median cache-hit rate and $3.47 per pass, Pi at 79.4% and $2.43, Exo Harness at $1.05. LobeHub's 86.2% is in that pack, slightly below Codex. Its 7m 19s median time on successful tasks is slower than Codex's 6m 43s and well behind the 4m 32s and 4m 33s that Alma and MiniMax Code report. Cache rates also depend on the provider (minimum prefix length, time-to-live), and LobeHub's traffic went through LobeHub Cloud rather than the benchmark's Fireworks gateway.
If $1.68 holds up under the benchmark's own accounting, with retries billed, it would be a good number: second only to Exo Harness among published configurations, at a much higher pass rate than Exo's 16 tasks. That would be the real result of this experiment, and it is worth publishing properly.
Is this recursive self-improvement?
The word matters here, because LobeHub also maintains a list that defines it. Awesome-RSI (lobehub/awesome-rsi, CC0, 243 linked entries) draws four distinctions in its scope section:
- self-refinement improves the current output without a persistent change;
- persistent self-improvement changes weights, memory, skills, prompts, harness or code that carry into the next round;
- recursive self-improvement is when "the mechanism that produces improvements is itself the object of improvement";
- an RSI substrate exposes an agent's own structure as modifiable without necessarily closing the loop.
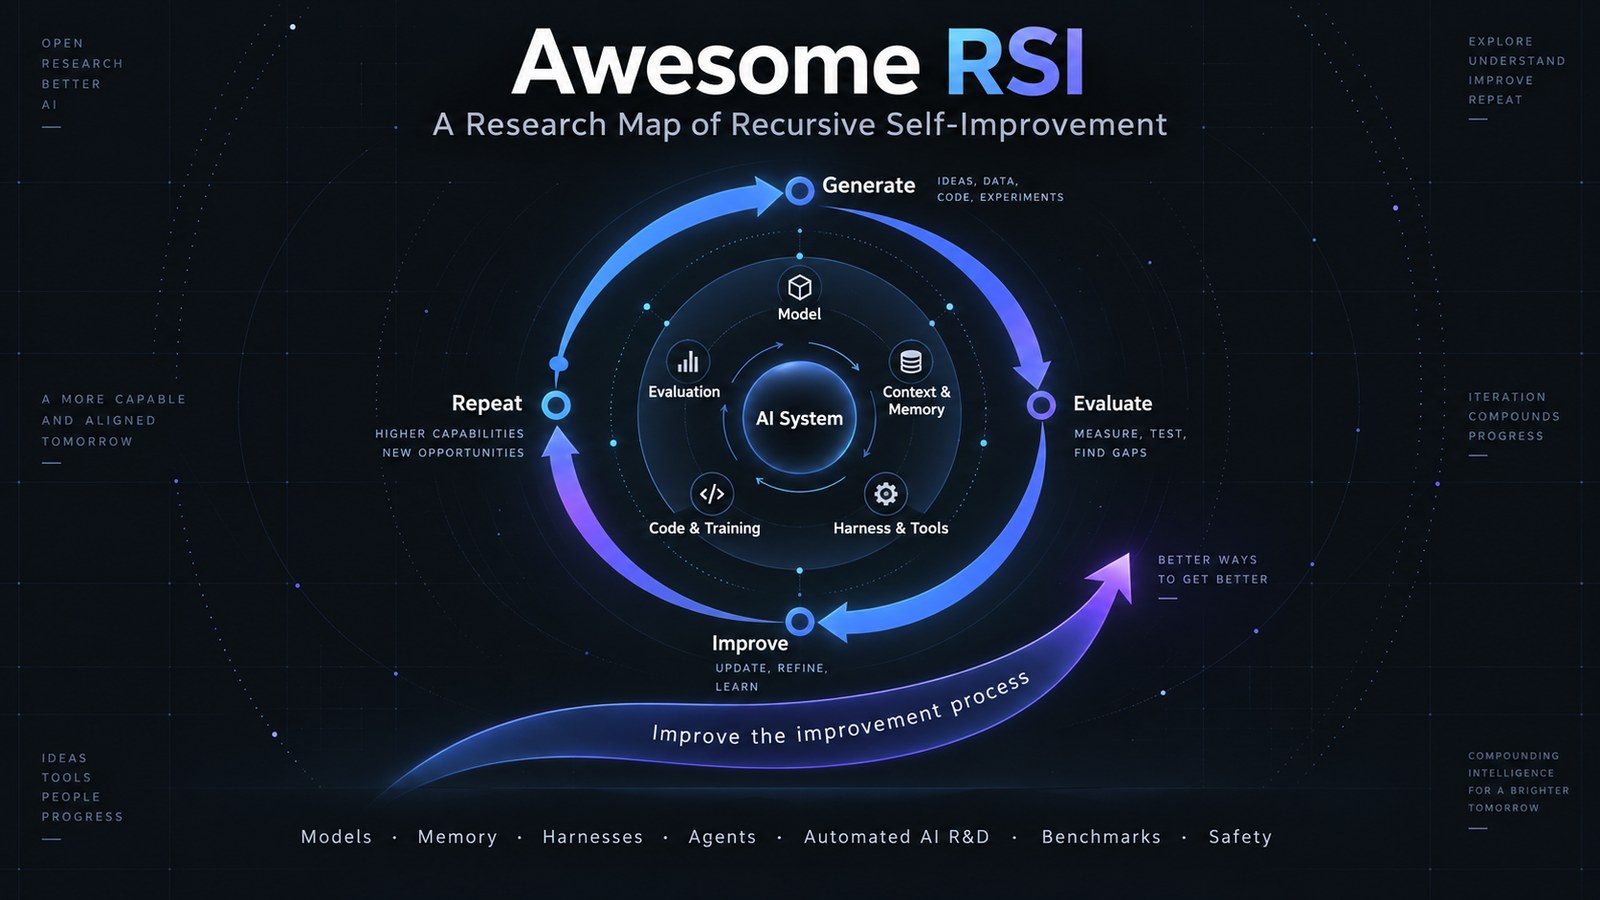
By that definition the experiment is clearly persistent self-improvement: harness changes carry into the next round. Whether it is recursive depends on a detail the post leaves out. If Lobe Agent edited the same harness it was running in, then the improver is part of what is improved, and that is the self-referential structure of STOP or the Darwin Gödel Machine. If a fixed RSI framework drove a Lobe Agent that edited a copy of the harness, the improver never changed, and it is harness optimisation by an agent: useful, but one level down.
LobeHub's May post gives its own scale, and it is more modest than the X post.
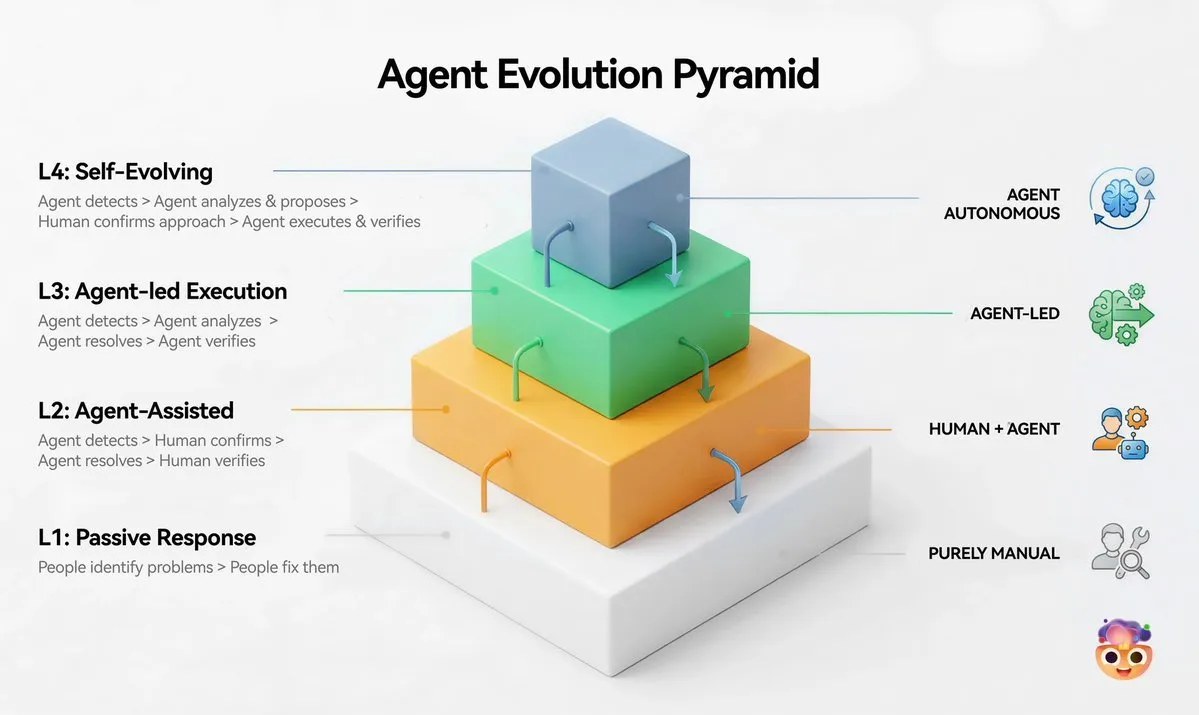
The precise name for what the post describes is "agent-driven harness optimisation, with the weights frozen". Several groups do the same thing under that kind of name: Sakana and Berkeley's recursive harness self-improvement compares each harness only against its predecessor; RRSI regularises the search so it transfers; Dream-RSI rewrites a scheduler around a frozen model and is explicit that the model is not what recurses. "RSI" is not wrong for this family, and the list LobeHub maintains files it under "Harness-level RSI". It is a big word for one week and one benchmark, and the post would have lost nothing by saying which loop was closed.
Where this sits
The case for harness work is real, and the site has covered it from both sides. Agent harnesses made the argument that the loop around the model matters as much as the weights; the harness effect measured a 41% cost cut from an orchestration swap at equal quality. Multi-harness RL goes the other way and trains the weights inside unmodified harnesses.
The strongest counterpoint was posted under LobeHub's announcement as a screenshot: Apple and EPFL's how little harness a strong agent needs, which found that under an equal time budget, elaborate open-source harnesses gave no advantage over a single minimal coding-agent session on MLE-bench. The two are less opposed than they look. That paper measures quality, where FrontierHarness also finds the harness barely matters. FrontierHarness finds the harness matters a lot for cost, and that is where LobeHub's week, if the number holds, did something.
What I'd want in the report
LobeHub has promised scripts, trajectories and a technical report. Four things would settle most of this:
- The harness diff, before and after, with the round in which each change was accepted.
- The task set the loop optimised against, and whether any FrontierHarness task was in it.
- Every attempt on all 30 tasks, not the selected one, with its token usage, so the benchmark's
normalize-results.mjscan compute single-attempt pass rate andeffective_cost_per_passwith discards billed. - A matched control: the pre-optimisation Lobe Agent run once through the same adapter and topology, so the week's effect is measured against LobeHub's own starting point instead of against harnesses run somewhere else.
The fourth is the one that would make this an experiment. The benchmark repository already recommends it: "Evaluate a control harness under the same policy and environment before claiming comparability." Item 4 alone would turn "#1 of 13" into a before-and-after that no one could argue with, at the size of effect thirty tasks can resolve.
- license
- CC0-1.0
- branch
- main
- tests
- none found
- commit date
- 2026-10-06
local clone, 2026-10-11 at e3a14cf — branch, commit, commitDate, fileCount, hasTests, license, licenseFile, shallow
shallow clone: counts describe the pinned tree, not the history
- branch
- main
- tests
- 6 files
- source
- 205.6 kB
- commit date
- 2026-09-08
by size of tracked source at this commit, file counts in brackets; docs, data and vendored trees excluded
local clone, 2026-10-11 at e837a70 — branch, commit, commitDate, fileCount, hasTests, languages, shallow, testFileCount
shallow clone: counts describe the pinned tree, not the history
How I checked
- Read LobeHub's post, its thread and the first page of replies through the fxtwitter mirror; the chart and the screenshot of the Apple paper come from there.
- Shallow-cloned frontier-harness-eval/eval at
e837a70and fetched the pull-request refs for the third-party candidates (#9, #13, #16, #18). The task counts, per-task matrix, best-of-N estimate and all tests come fromresults/eval-data.jsonwith a short Python script (Wilson intervals, Fisher's exact test, exact McNemar on discordant tasks); the widget recomputes the same tests in the browser. - Read Runta's launch post for the methodology, the Claude Code cache analysis and the hard-task table.
- Blobless, sparse-cloned lobehub/lobehub at
4b86a41and read.agents/skills/run-eval-harbor/,packages/agent-tracing/andapps/server/src/services/goal/. No file in it is identified as the RSI framework. - Shallow-cloned lobehub/awesome-rsi at
e3a14cfand counted its linked entries. I could not verify the "80+ commits" from a shallow clone. - Could not check: what the harness changes were, which tasks the loop trained on, how many retries were selected, whether discarded attempts were billed, and which provider served K3 for LobeHub's run.