An agent won the DSA kernel track unattended: 98 experiments, 32 kept, and a baseline that copies 624 MB per call
mdjsonmcp2026-09-18 · 26 min · agents · kernels · triton · benchmarks · reproducibility · gpu
auto-gpu-kernel is a Claude Code loop that writes GPU kernels while nobody watches. It was entered into the MLSys 2026 FlashInfer AI Kernel Generation Contest on the DeepSeek Sparse Attention track, in the sub-track that requires the whole pipeline to run with no human in it, and the repository's first line says it won with "an average speedup of 34.93x."
I cloned it, cloned FlashInfer-Bench, pulled the contest's trace set and definitions off Hugging Face, and read the scoring rule the organisers published. The rank is real and independently confirmable. The number needs a paragraph of context that neither the repository nor the report supplies, and the thing most likely to be wrong about a generated kernel — that it is fast because it is wrong — turns out to be the part this whole stack handles best.
| Code | github.com/Dogacel/auto-gpu-kernel, Apache-2.0, with archive/ holding both submitted kernels and every experiment log |
| Report | archive/report.pdf — Auto GPU Kernel: Autonomous Kernel Discovery for DeepSeek Sparse Attention, Doğaç Eldenk, Northwestern University. 4 pages, MLSys format, not on arXiv (I searched; there is no arXiv ID to verify) |
| Contest | MLSys 2026 FlashInfer AI Kernel Generation Contest, Track B (DSA), Full-Agent sub-track |
| Headline | "average runtime of 0.010 ms" (sparse attention) and "0.016 ms" (top-k indexer), "yielding an average 34.93x speedup over the FlashInfer baselines" |
| Baseline | flashinfer_wrapper_5af199 and flashinfer_deepgemm_wrapper_2ba145, committed in the contest dataset |
| Hardware | Official: bare-metal B200, clocks locked at nvidia-smi -ac 3996,1965, CUDA 13.2, Triton 3.6.0. Every number in the report: Modal, which the contest page says is "for reference only (clock frequency cannot be locked)" |
| Verified here by | Cloning both repos, counting the 23 + 128 workload records in flashinfer-ai/mlsys26-contest, and reading flashinfer_bench/bench/ end to end |
| Not verified | Any latency. I have no B200 and did not run a kernel. Everything below is source, arithmetic, or a count |
The organisers' own results page is the only independent confirmation of the rank, and it is worth looking at for what it does not contain:
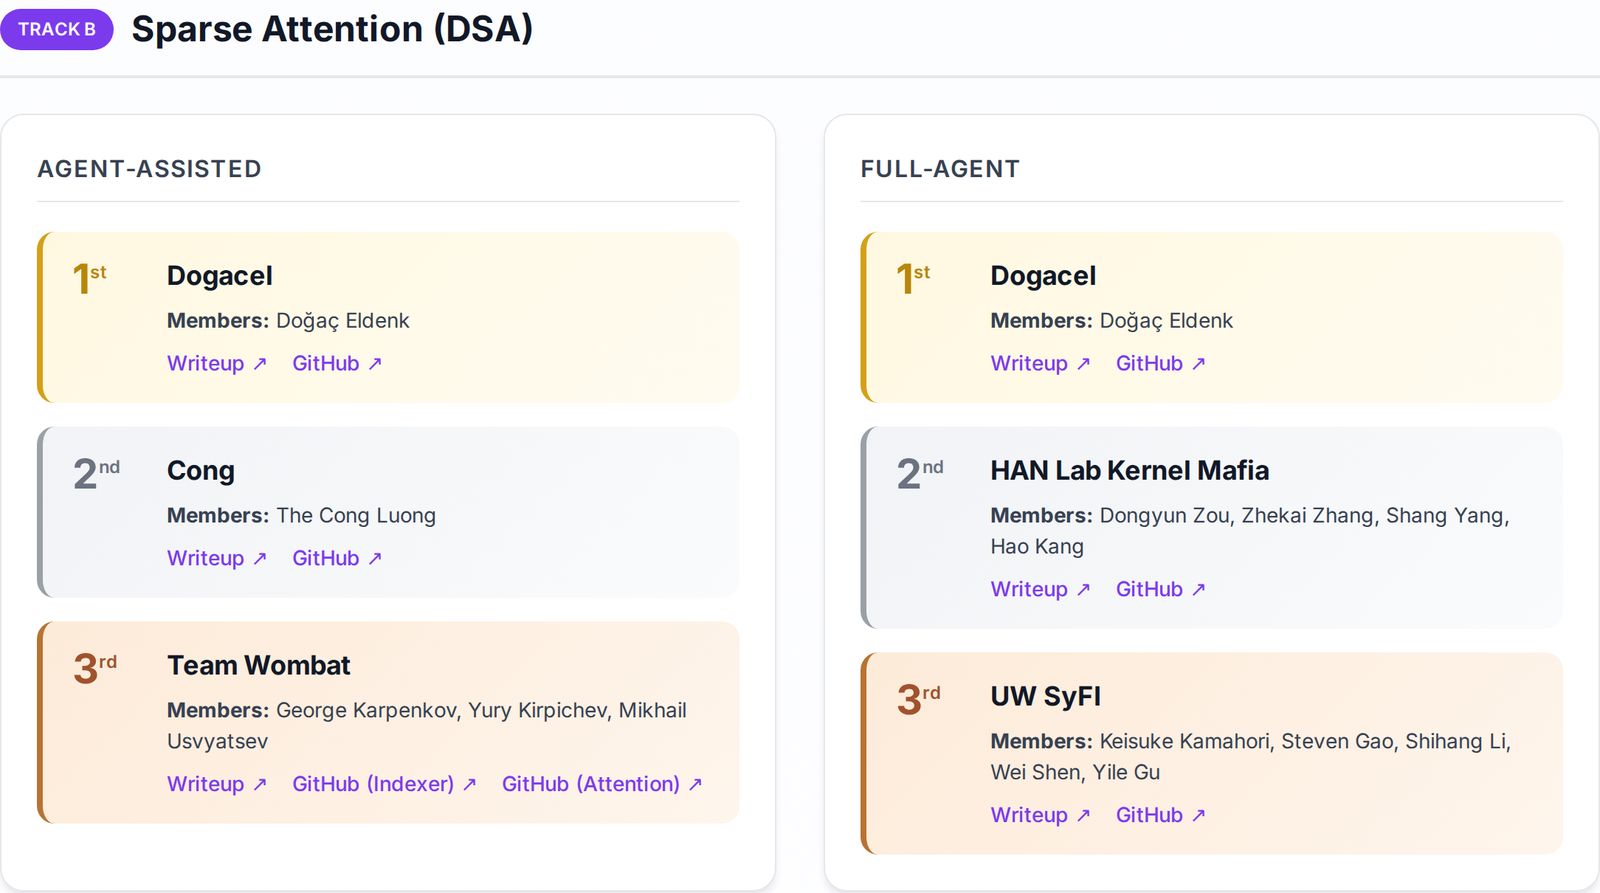
So the rank is confirmed by the organisers and the number is not. 34.93x appears in the entrant's README and report; nowhere on the contest site is there a leaderboard column it could be checked against. That is not an accusation — it is the reason the rest of this piece works from the scoring rule and the baseline source rather than from the number.
What 34.93x is a ratio of
The organisers do publish the scoring rule, in the starter kit's EVALUATION.md:
Per-kernel speedup — arithmetic mean of per-workload
FlashInfer_baseline_latency / your_kernel_latency. Correctness-gated: any failing workload zeros the whole kernel's score.Per-track speedup — for multi-kernel tracks (DSA, GDN), arithmetic mean of per-kernel speedups.
Two facts fall out of that. The denominator is a specific committed file, not the phrase "FlashInfer." And the DSA track score is the mean of exactly two per-kernel numbers, so 34.93 is (S_attention + S_indexer) / 2.
The sparse-attention baseline is solutions/baseline/dsa/dsa_sparse_attention_h16_ckv512_kpe64_topk2048_ps64/flashinfer_wrapper_5af199.json in the contest dataset. It is 50 lines of Python around a real TensorRT-LLM MLA decode kernel. Here is the part that runs first:
# solutions/baseline/dsa/.../flashinfer_wrapper_5af199.json — main.py::run
query = torch.cat([q_nope, q_pe], dim=-1).unsqueeze(1)  # [T, 1, H, ckv+kpe]
kv_cache = torch.cat([ckv_cache, kpe_cache], dim=-1)    # [num_pages, page_size, ckv+kpe]
block_tables = sparse_indices.unsqueeze(1)              # [T, 1, topk]

seq_lens = (sparse_indices != -1).sum(dim=1).to(torch.int32)
max_seq_len = int(seq_lens.max().item())
The second line concatenates the entire paged KV cache. Not a page, not the selected pages — the whole cache, into a fresh allocation, every call. I pulled workloads/dsa_paged/dsa_sparse_attention_h16_ckv512_kpe64_topk2048_ps64.jsonl and counted: all 23 workloads declare num_pages: 8462, and ckv_cache is [8462, 64, 512] bf16. The arithmetic is not subtle.
[8462, 64, 512] bf16
[8462, 64, 64] bf16
[8462, 64, 576] bf16, a fresh allocation every call
torch.cat alone1247.8 MB · ≥156 µs1247.8 MB ÷ 8 TB/s = 156 µs at peak bandwidth, on a chip that never reaches peak
0.010 ms, the report’s own average over the 23 traces — about 16× inside the baseline’s copy floor
The max_seq_len line then does a .item(), which is a host synchronisation, on every call. A kernel the winning submission completes in about ten microseconds is being compared against a wrapper whose prologue cannot finish in under a hundred and fifty, by conservation of bytes.
I want to be careful about what this does and does not mean. It does not mean the submission is bad; the kernel underneath is genuinely good and I will show why below. It does not mean the entrant did anything wrong; every team was scored against the same denominator, so the ranking between teams is unaffected. What it means is narrow and important: "34.93x faster than FlashInfer" is not a claim about FlashInfer's DSA kernel. It is a claim about a reference wrapper that spends most of its time on a data-layout conversion, and the actual trtllm_batch_decode_with_kv_cache_mla call inside it has no published number of its own.
The definition's own reference field — the code FlashInfer-Bench uses to produce the expected outputs — is a third, even slower thing: a Python for t in range(num_tokens) loop doing a fancy-index gather and two fp32 matmuls per token. The submission repo ships a copy as solution/triton/sparse_baseline.py, and its rulebook tells the agent to read it "for numerical semantics," which is the right use for it. It is not the scoring baseline, and nothing in the repo claims it is.
And what kind of average
The second half of the scoring rule is the estimator: arithmetic mean of per-workload ratios. That choice interacts badly with one verified property of the indexer's trace set.
The top-k indexer selects the K = 2048 highest-scoring tokens from a paged FP8 cache. If a sequence has fewer than 2048 valid tokens, every valid token is in the top-K set and there is nothing to select — the answer is just the page-table-expanded valid IDs. The report says "roughly half of the contest traces" are like this. I counted the real number from workloads/dsa_paged/dsa_topk_indexer_fp8_h64_d128_topk2048_ps64.jsonl: of 128 workloads, 69 have max_num_pages <= 32, so max_num_pages × 64 <= 2048 and the selection collapses. That is 53.9%, and it matches the repo's own experiment log for exp_26 exactly ("69/128 workloads hit fast path").
Those 69 traces are where the enormous ratios live, because the winner returns an answer without doing any arithmetic on the data while the baseline runs a full FP8 paged MQA logits kernel plus a top-k transform. An arithmetic mean over ratios is dominated by its largest terms, which is exactly the set of terms a structural shortcut creates.
what the contest scores
the usual choice for normalised benchmark results
how much less wall time the whole trace set takes
The gap between the top bar and the bottom one is the gap between “the average of our per-trace ratios” and “our kernels take this fraction of the time.” Both are honest arithmetic. Only one of them is what a reader hears in “34.93× speedup.”
I cannot tell you this submission's real distribution — nobody published per-workload ratios and I have no GPU to make them. What the widget shows is a property of the estimator, not a measurement of the entry, and under its stated equal-baseline model the ordering is a theorem rather than a guess — the three bars are the arithmetic, geometric and harmonic means of the same ratio set, and AM ≥ GM ≥ HM with equality only when every ratio is identical. The contest picked the one that reads highest. Every team got the same treatment, so the ranking is untouched; what moves is only what the winning number means when it is quoted on its own.
The correctness gate is the part that holds
The interesting question for any generated kernel is not whether it is fast. Fast and wrong is easy: return the input, memoize the output, skip the masked lanes. The question is whether the harness can tell. So I read it instead of the README, and it is better than I expected.
The ordering is the whole thing. In flashinfer_bench/bench/evaluators/evaluator.py:
# flashinfer_bench/bench/evaluators/evaluator.py — Evaluator.evaluate
correctness, evaluation = cls.check_correctness(...)
if evaluation is not None:
    return evaluation

performance, evaluation = cls.eval_performance(...)
check_correctness returns a non-None evaluation exactly when something failed — wrong shape, wrong dtype, a NaN, an inf, or a numerical miss. On any of those the function returns before eval_performance runs. A failing kernel therefore never gets timed at all: its trace carries a Correctness object and performance=None. Downstream, kbench reads ev.performance.latency_ms if ev.performance else None and drops None from every aggregate. A wrong kernel does not produce a bad number in this harness. It produces no number. Combined with the contest's "any failing workload zeros the whole kernel's score," that is the strongest version of the gate available.
The tolerance comes from ResolvedEvalConfig: rtol = 1e-2, atol = 1e-2, required_matched_ratio unset, which compute_error_stats resolves to 1.0. The contest's per-track commands override those for MoE (--atol 1 --rtol 0.3 --required-matched-ratio 0.9) and override nothing for either DSA kernel, so DSA runs at the strict defaults: every element must pass. The comparison itself:
# flashinfer_bench/bench/utils.py — compute_error_stats
exceeds_tol_mask = (abs_error > cfg.atol) & (rel_error > cfg.rtol)
exceeds_count = float(exceeds_tol_mask.sum().item())
matched_ratio = 1.0 - (exceeds_count / float(total_elements))
exceeds_tol = matched_ratio < required_matched_ratio
That is an &, so an element fails only if it misses both tolerances — it passes if it is within atol or within rtol. This is looser than torch.allclose, which tests the single combined bound |x − y| <= atol + rtol·|y|, and the difference shows up in the submission's own logs. Experiment 47 in the sparse-attention summary records the kernel's worst absolute error as 1.56e-02, which is above the harness's atol of 1e-2. It passes because the relative error at those elements is under 1e-2. The agent's rulebook independently set its own guardrail at abs_err > ~0.02, a factor of two above the harness, and never tripped it.
The indexer's gate is stricter than a tensor comparison, and it has to be, because a top-k index list has no canonical order. DsaTopkIndexerEvaluator validates that every returned index is reachable through the batch's block_table and inside its seq_len, that no index repeats, and only then recomputes the weighted-ReLU score at each returned index, sorts both score vectors, and compares. Out-of-range or duplicated indices return INCORRECT_NUMERICAL with max_absolute_error = inf before any scoring happens. The three obvious ways to game a top-k — return garbage, return duplicates, return the same token 2048 times — are all closed explicitly.
One genuine soft spot, and it is in the baseline rather than the submissions. The DSA sparse-attention definition declares two outputs, output and lse. DsaSparseAttentionEvaluator.check_correctness zips over ref_out[: len(out)], so a solution that returns one tensor is only checked on that one. flashinfer_wrapper_5af199.json sets "destination_passing_style": false and returns (output,) — so the baseline's lse is never compared, while the submitted kernel, which uses the default destination-passing style and receives both buffers, is checked on both. The reference gets an exemption the contestant does not.
The other soft spot is in the agent's own tooling. archive/.../scripts/ab_benchmark.py, the paired same-VM comparison the rulebook mandates for any sub-5% delta, collects results like this:
# archive/dsa_sparse_attention_.../scripts/ab_benchmark.py — run_ab
for t in res.traces.get(definition.name, []):
    if t.evaluation and t.evaluation.performance:
        out[side][t.workload.uuid] = t.evaluation.performance.latency_ms
A workload that fails correctness has no performance, so it is skipped. It does not appear as a loss; it silently vanishes from the table, and the printed verdict — B wins 9/12 — is computed over whatever survived. The only signal is n shrinking. Nothing here is unsound: the loop's own procedure runs /benchmark quick for correctness before it measures, and kbench bench exits non-zero on any failing workload. But the safety lives in the procedure, not in the comparison tool, and a reader skimming an A/B table in summary.md has no column telling them how many workloads were in it.
The denominator
The report names four optimizations. The repository commits the whole search.
The auto-gpu-kernel report names four optimizations it converged on. Its committed experiment logs record 98 numbered experiments across the two DSA kernels, of which 32 were kept. Every row below is counted by hand from the two summary.md tables in archive/, classifying each experiment by the verdict its own Notes column gives.
| kernel | experiments logged | kept | discarded | rejected by the correctness gate | rejected by the compiler | keep rate |
|---|---|---|---|---|---|---|
| DSA sparse attention (23 traces) | 54 | 17 | 37 | 1 | 3 | 31.5% |
| DSA top-k indexer (128 traces) | 44 | 15 | 29 | 1 | 0 | 34.1% |
| both | 98 | 32 | 66 | 2 | 3 | 32.7% |
The two correctness rejections are sparse-attention exp_27 (compact-block partition, quick run 1/2 passed, T=8 workload abs_err 2.82) and indexer exp_36 (skipping iteration 0 of the radix loop, 8/16 passed — negative learned weights make a negative final score, so the count above the initial threshold falls below topk). Both were reverted the same iteration. The three compiler rejections are sparse exp_20 (num_ctas=8 trips a Triton 3.6 CTA-planner assertion), exp_33 (BLOCK_N=256 needs 321 KB of shared memory) and exp_46 (.evict_last cannot be combined with .cg). Neither summary.md records an experiment that produced a latency number while failing the gate — the harness does not compute one.
Ninety-eight numbered experiments, thirty-two kept, a keep rate just under a third. That is the number I would have wanted from the report and it is not in the report, which describes only the survivors. The ratio is the actual finding about autonomous kernel work: two out of three carefully-reasoned, individually-plausible changes made things worse or made no difference, and the loop's value is that it wrote all of them down.
The failure modes are worth reading in the raw. Of the 37 discarded on the sparse-attention side, three died at the compiler — one asked for 321 KB of shared memory on a chip with 232 KB per SM — and one was killed by the numerical gate. The rest split between measured regressions and deltas the logs themselves refuse to believe. Exp_50 is the model of the second kind: "Cross-session sign flip = pure noise, no real signal," written after A/B runs on two different VMs disagreed about the sign of a 0.0001 ms delta on a 5 µs workload. An agent that can write that sentence about its own result is doing the part of benchmarking that people usually skip.
Both numerical rejections were caught before anything was timed, because nothing that fails gets timed: sparse exp_27 failed the two-workload quick run at abs_err = 2.82, and indexer exp_36 failed 8 of 16 on a stride-8 run. Neither row carries a latency, because the harness never produced one.
What the loop actually found
The method is a four-step cycle around three durable files, and the report's one figure is the clearest statement of it:
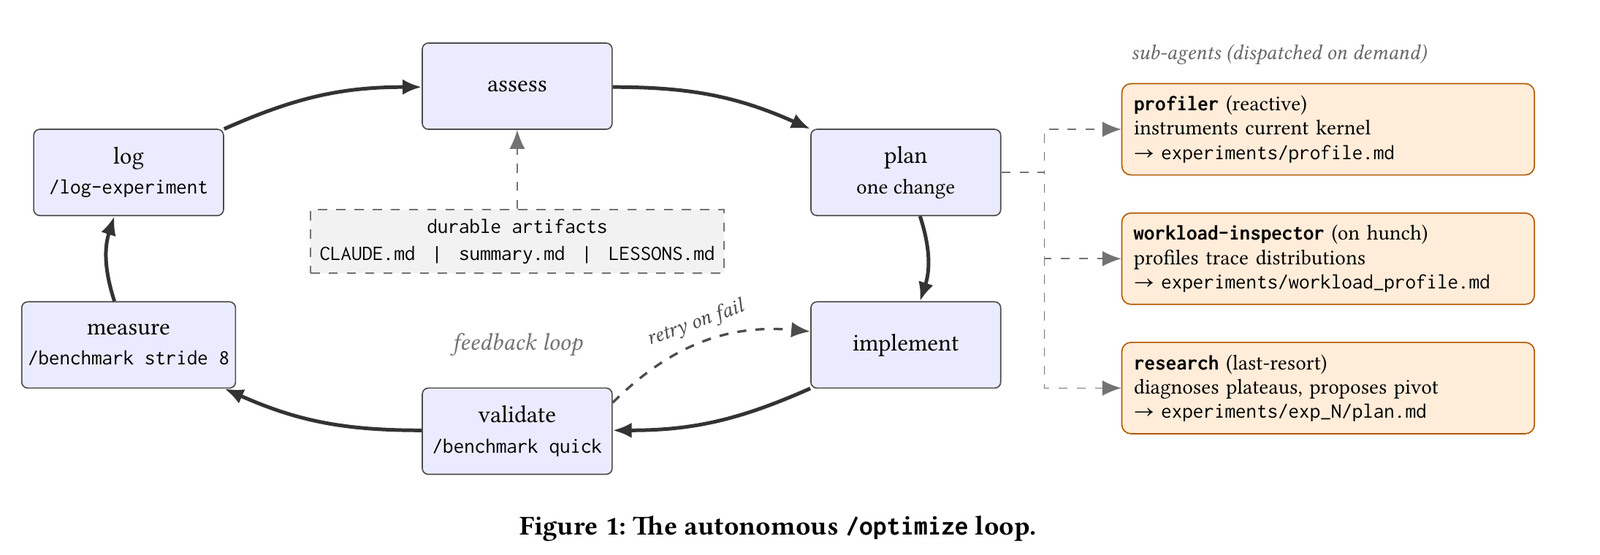
That is the only figure in the report. There is no results chart — a four-page paper whose headline is a single number publishes no plot of it. The repository is more generous than the paper: each experiments/exp_N/result.md carries per-workload deltas, stratified by regime, with the mechanism argued. What is missing everywhere is the per-workload ratio table from the official scoring run, which is the only artifact that would let anyone reconstruct 34.93.
What the loop converged on is not micro-tuning, and this is the part I would defend against a sceptic. The largest indexer win is a kernel that does no arithmetic at all:
# archive/dsa_topk_indexer_.../solution/triton/indexer_fused.py — scoreless_kernel
seq_len = tl.load(seq_lens_ptr + pid_b)
actual_topk = tl.minimum(seq_len.to(tl.int32), topk)

page_idx = k_offs // page_size
offset = k_offs % page_size
k_in_range = k_offs < actual_topk

bt_ptrs = block_table_ptr + pid_b * stride_bt_b + page_idx * stride_bt_p
global_page = tl.load(bt_ptrs, mask=k_in_range, other=0).to(tl.int64)

token_idx = (global_page * page_size + offset).to(tl.int32)
tl.store(out_ptrs, tl.where(k_in_range, token_idx, -1), mask=k_in_topk)
No dot product, no sort, no torch.topk. When seq_len <= 2048 the correct answer is every valid token, and the only work left is expanding the page table. The host dispatches it on max_num_pages <= 32, a shape known without touching the data, so there is no synchronisation to pay for the branch. Experiment 26 measured the full 128-workload mean dropping from 0.0496 ms to 0.0276 ms on that one change, with seven workloads falling about 95%, from roughly 49 µs to 2 µs.
The report is candid that the loop did not find this by itself. It found it after a workload-inspector sub-agent was added whose entire job is to look at the inputs rather than the code — "The agent was too fixated on improving the code to do the necessary exploration." That is a genuinely useful result about agent design, and it generalises: the loop could read its own kernel all day and never learn that half its inputs made the kernel unnecessary.
The sparse-attention side found something less obvious. Its trace set is small-batch decode — I counted num_tokens across the 23 workloads and got {1: 1, 2: 8, 6: 3, 7: 3, 8: 8}, max 8, exactly matching the agent's own workload_profile.md. Eight CTAs on a 148-SM B200 is an empty machine, so the kernel splits each token's 2048 top-k slots across 16 CTAs. But the valid indices are a contiguous prefix followed by -1 padding — median 33 valid entries out of 2048 — so the obvious contiguous chunking gives all the work to the first split and leaves the rest spinning:
4 of 8 splits idle · the prefix piles into the first splits
0 of 8 splits idle · the prefix is spread across every split
Chunking puts 2 iterations on the critical path; striding puts 1. Same work, same kernel, different index arithmetic.
# archive/dsa_sparse_attention_.../solution/triton/sparse_fused.py:81-90
# Stride-partition: split `s` owns TopK positions {s, s+NUM_SPLITS, ...}
# so a prefix-valid run of length N is spread across all NUM_SPLITS CTAs
# as ~N/NUM_SPLITS each — straggler imbalance (one split doing all work)
# is eliminated on small-valid workloads.
offs_split = s + tl.arange(0, SPLIT_SIZE) * NUM_SPLITS
idx_scan = tl.load(Indices_ptr + t * stride_idx_t + offs_split)
num_valid = tl.sum((idx_scan >= 0).to(tl.int32), axis=0)
max_bn = ((num_valid + BLOCK_N - 1) // BLOCK_N) * BLOCK_N
And then it does the thing I did not expect an unattended loop to get right. Flash-decoding is normally two kernels — split, then combine — and the report puts a launch at roughly 8 µs on B200, which on a 16 µs kernel is the whole budget. The loop collapsed the pair into one launch behind a grid-wide atomic barrier at experiment 15, swapped the spin's read-modify-write poll for a volatile load at 18, and deleted the per-call counter reset at 37:
# archive/dsa_sparse_attention_.../solution/triton/sparse_fused.py:128-140
# ===== Atomic barrier =====
# Release: all prior stores visible before the increment.
tl.atomic_add(Counter_ptr + t, 1, sem="release")

# Monotonic counter: host tracks generation; target_count = gen *
# NUM_SPLITS. Counter grows monotonically across calls — no reset or
# per-call decrement needed. Eliminates the final atomic_add(-1) per CTA.
count = tl.load(Counter_ptr + t, volatile=True)
while count < target_count:
    count = tl.load(Counter_ptr + t, volatile=True)
tl.debug_barrier()

# ===== Combine phase (D-parallel; s indexes D-slice) =====
d = s
Three separate ideas are stacked in that one block. The release/acquire pairing, so the partial (m, l, acc) stores are visible before the increment. The spin on a volatile load instead of an atomic_add(0) — exp_18's finding that a read-modify-write poll serialises through the L2 atomic unit while a plain volatile read does not. And reusing program_id(1) as the split index before the barrier and the output D-slice after it, which is what lets one grid do both phases.
The loop is also honest about how much this bought. The profiler had projected 8 µs of recoverable launch tax; exp_15 measured about 2 µs, and LESSONS.md records the correction as a rule — "expect to recover ~25–50% of the profile's launch tax anchor, not the full number." Whatever one thinks of the benchmark, that is not slop.
Three things the report gets wrong
The trace counts are swapped. Section 2 says "The TopK indexer is evaluated on 23 traces and Sparse Attention on 128 traces." It is the other way round: I counted 23 records in the sparse-attention workload file and 128 in the indexer's, and the repository's own logs agree — the sparse summary reports 23/23 and 12/12 (a stride of 2 over 23), the indexer reports 128/128 and 16/16 (a stride of 8 over 128). The error has a traceable cause. The sparse-attention project's CLAUDE.md tells the agent that a full run is "128 workloads, 3-4 min" and its LESSONS.md opens with "our 128-workload set" — both copied from the indexer project, both wrong for the kernel they sit next to. The same file also says --stride 2 gives "~10 workloads," which is right for 23 and not for 128; the rulebook contradicts itself in two lines. Two rows of the sparse summary duly record 128/128 where every neighbouring row says 23/23. A durable artifact is durable whether or not it is correct, and this one propagated from a rulebook into a log into a published paper.
The loop itself was not confused, which makes this a write-up error rather than a measurement error. experiments/exp_51/result.md opens its results with "Pass: 23/23 (full benchmark, this trace set has 23 workloads)" — the agent stated the correct count, in writing, in the experiment that produced the final kernel.
The indexer's headline latency is worse than its own best logged number. The report gives "the TopK indexer 0.016 ms." The last full 128-workload measurement in summary.md is experiment 29 at 0.0116 ms mean, and the four experiments kept after it were all small wins. The most likely explanation is that 0.016 ms comes from the bare-metal scoring run and 0.0116 ms from Modal, which is entirely plausible and is exactly why the difference should be labelled. Which brings up the third one.
Every number in the paper is from a platform the contest says cannot be used for scoring. Section 6 opens "All experiments run on a single NVIDIA B200 via Modal," and the contest page says: "Modal scores are for reference only (clock frequency cannot be locked). Official evaluations run on bare metal machines." The report's headline-numbers paragraph then puts a Modal latency and the official score in one sentence — "0.010 ms and the TopK indexer 0.016 ms, yielding an average 34.93x speedup" — where the two came from different machines under different timing configurations. The repo's own kbench config runs 100 iterations × 5 trials with 3 warmup runs; the official DSA command overrides none of those, so it uses FlashInfer-Bench's defaults of 50 × 3 with 10 warmup. Neither the iteration counts nor the machines match, and "yielding" implies they do.
Two smaller ones, for completeness. The agent's own workload_profile.md states ckv_cache as "275 MiB" and kpe_cache as "35 MiB"; those are the element counts, and at two bytes per bf16 element the real footprints are 529 MiB and 66 MiB. The artifact counted elements and called them bytes. It happens not to have mattered — both numbers are far past L2 either way — but it is an error inside a file the loop treats as ground truth. And LESSONS.md still documents the atomic barrier as ending with "atomic_add(-1, sem="release") at end to reset for next call," which experiment 37 deleted; the durable lesson now contradicts the shipped kernel. Separately, the report says the submitted runs used Claude Opus 4.7 while the README's example invocations pass --model anthropic/claude-opus-5, presumably because the tool kept moving after the April deadline.
"No human in the loop"
The abstract says the kernels "were generated end-to-end by an autonomous Claude Code optimization loop with no human in the loop." The paper then describes, without apparent tension, a human doing three things.
The loop is driven by "a project rulebook (CLAUDE.md), an append-only experiment summary (summary.md), and a hand-curated lesson log (LESSONS.md)" — the paper's own adjective. Of the rulebook it says "Each rule was added because the agent violated it or got stuck due to it at least once," which is a human reading logs and writing rules between runs. And the largest single algorithmic win arrived only after "we added workload-inspector."
None of this makes the claim false in the sense the sub-track means it. The Full-Agent rules govern the submission pipeline: no human edits the kernel, no human picks the optimization, the artifacts are what carry state across context resets. But the honest description of what won is not "an agent wrote these kernels." It is an agent wrote these kernels inside a scaffold a human tuned over months, and the scaffold is where most of the engineering went — which is what the paper's conclusion says in its own words: "the bottleneck for autonomous kernel discovery is experiment management."
There is one number that makes this measurable, and it is a gift. The same entrant also won the Agent-Assisted sub-track of the same track, with a separate repository of human-assisted kernels for the same two definitions. That entry claims 37.07x; this one claims 34.93x. Same person, same problem, same baselines, same scoring rule, one with a human in the loop and one without. The unattended loop landed at 94% of the attended one. That is the most useful number either repository contains, and neither draws attention to it. (The two entries' latencies do not scale the way the two scores do — the Agent-Assisted README claims "both kernels average a runtime of 0.009 ms" against this one's 0.010 and 0.016 — which is another consequence of a score built from an arithmetic mean of ratios rather than from time.)
Where it breaks
The grid-wide spin barrier is correct on this trace set and I do not think it is safe to lift.
while count < target_count has no bailout. Every one of the NUM_SPLITS CTAs sharing a token must be resident on the GPU at the same time, or the ones that are resident spin forever waiting for siblings that cannot be scheduled until somebody finishes. The kernel's own LESSONS.md states the condition — "Works as long as CTAs comfortably fit on available SMs (no risk of spin-wait deadlock)" — and the kernel ships NUM_SPLITS = 16 with BLOCK_N = 128. Experiment 33 reports that BLOCK_N = 256 needed 321 KB of shared memory against the B200's 232 KB per SM, which puts BLOCK_N = 128 around 160 KB: one CTA per SM. With 148 SMs, the grid of T × 16 CTAs is resident up to T = 9. The largest contest trace has T = 8.
num_tokens in this definition is the decode batch size. A batch of ten is not exotic. The kernel is not merely untuned past the trace set's largest shape; past it, the failure mode is a hang, and the atomic counter is module-level state that survives across calls, so a launch that dies mid-grid desynchronises the generation counter and the next call hangs too. Nothing in the contest could have caught this, because the contest's job was to rank kernels on a fixed trace set, and it did that.
The same caveat applies more gently to everything else the loop found. The two-tier scoreless dispatch, the T <= 2 versus T >= 3 hybrid, NUM_SPLITS = 16 chosen because it makes every split fit in one BLOCK_N = 128 iteration when topk = 2048 — all of these are correct specialisations of a static distribution, and all of them are load-bearing for the score. That is not cheating; the report argues, persuasively, that workload specialisation is the work, and a serving stack absolutely should skip the top-k when the sequence is shorter than K. It does mean the artifact is a kernel for these 151 traces, and the report's framing of the result as a general capability should be read with that in mind.
What I could not check
I have no B200, so I did not reproduce a single latency in this article, and I am not going to imply otherwise. Every number above is one of three things: read out of a source file, counted out of the contest trace set, or arithmetic on declared tensor shapes with the assumption stated. The 624 MB and the 156 µs floor are the latter — exact byte counts divided by a peak bandwidth no real copy achieves, which makes the floor a floor and nothing more.
Three things would settle what I could not. Running flashinfer-bench run --solutions flashinfer_wrapper_5af199 alone would say how much of the baseline's time is the torch.cat and how much is the MLA kernel — a one-command experiment that nobody appears to have published. Running the submitted kernels on bare metal would reconcile 0.0116 ms with 0.016 ms. And the per-workload ratio table behind 34.93 would settle the estimator question in one look. All three are cheap for anyone with the hardware, and none of them are in either repository.
What would change my mind
5 claims above, and what would falsify each
The 34.93x denominator is dominated by a data-layout conversion, not by FlashInfer's DSA kernel.
A timed run of
flashinfer_wrapper_5af199on B200 that attributes most of its latency totrtllm_batch_decode_with_kv_cache_mlarather than to the twotorch.catcalls. My claim rests on byte counting — 623.9 MB written and 623.9 MB read per call atnum_pages = 8462— and a CUPTI span that starts at the first kernel and ends at the last, which includes the copy kernels. If the profile shows the cat costing a small fraction of the total, I am wrong about where the ratio comes from.No kernel that fails the numerical check can contribute a latency to any reported number.
A trace from FlashInfer-Bench whose
evaluation.statusis notpassedand whoseevaluation.performanceis non-null.Evaluator.evaluatereturns beforeeval_performanceon every failure path I read, so this should be unconstructible — but I read FlashInfer-Bench'smainbranch on 2026-09-18, and the entrant's own A/B harness pins80f40d45968cfrom April, so the code that produced the submission's logs is five months older than the code I read.69 of the 128 indexer traces need no top-k selection at all.
A different count of
max_num_pagesinworkloads/dsa_paged/dsa_topk_indexer_fp8_h64_d128_topk2048_ps64.jsonl, or evidence thatmax_num_pages × page_sizeis not an upper bound on a sequence's valid token count. My count agrees with the repository's own exp_26 note, so both would have to be wrong together.The report swaps its two trace counts.
A version of the contest dataset in which the sparse-attention definition has 128 workloads and the indexer has 23. I counted the records on 2026-09-18 from the Hugging Face
mainrevision; if the set was reshaped after April, the report could be right about the set it ran on and the repository's own23/23rows would need another explanation.The shipped sparse-attention kernel deadlocks above about T = 9.
A run at
num_tokens = 16that completes. The argument is occupancy arithmetic — 16 CTAs per token, roughly one CTA per SM at 160 KB of shared memory, 148 SMs — and it fails if the kernel actually fits two CTAs per SM, or if Blackwell schedules the grid in a way that keeps the spin loop live. This is the claim in the article I am least able to test and would most like someone to check.