lithos-metal: per-layer megakernels for Qwen3.8-27B on an M5 Max, and where the 200 tok/s comes from
mdjsonmcp2026-10-08 · 25 min · inference · speculative-decoding · kernels · apple-silicon · on-device · quantization
Why read this
Hightop 30%Sums the 17.6 GB a Qwen3.8-27B pass reads and rebuilds 200 tok/s from Lithos's own rounds: 188 if all drafts land, 80 on their prompts; fusion alone is parity.
- Checked against the source
- Runs on a consumer GPU
- A new technique
Inference & servingApache-2.0Practitioner tool
How this was scored
- Is it new?
- 2 of 3: A real new idea, method or capability
- Can I trust it?
- 3 of 3: Reproduces the headline result, or shows from primary files it is wrong
- Can I run it?
- 2 of 3: Open code or weights with real limits
- Will I understand it?
- 2 of 3: Mechanism from first principles with figures
- Can I act on it?
- 2 of 3: A concrete recipe, numbers or comparison
- Will it last?
- 1 of 3: Relevant for months
- Does it affect many?
- 1 of 3: A specialist community
- Only here?
- 2 of 3: A teardown or measurement few others did
Score 68 of 100, ranked 130 of 476 rated articles. Each question is answered 0–3 by hand, and a 3 is rare. How articles are scored
Zhihao Jia's launch post for lithos-metal makes one claim: "Megakernels + DSpark speculative decoding run Qwen3.8-27B at 200+ tokens/s/user peak on one @Apple M5 Max." Jia leads the Mirage group at CMU, whose Mirage Persistent Kernel is one of the serious megakernel projects, so I took the claim seriously. It is also a number you can check with a memory bus and some arithmetic.
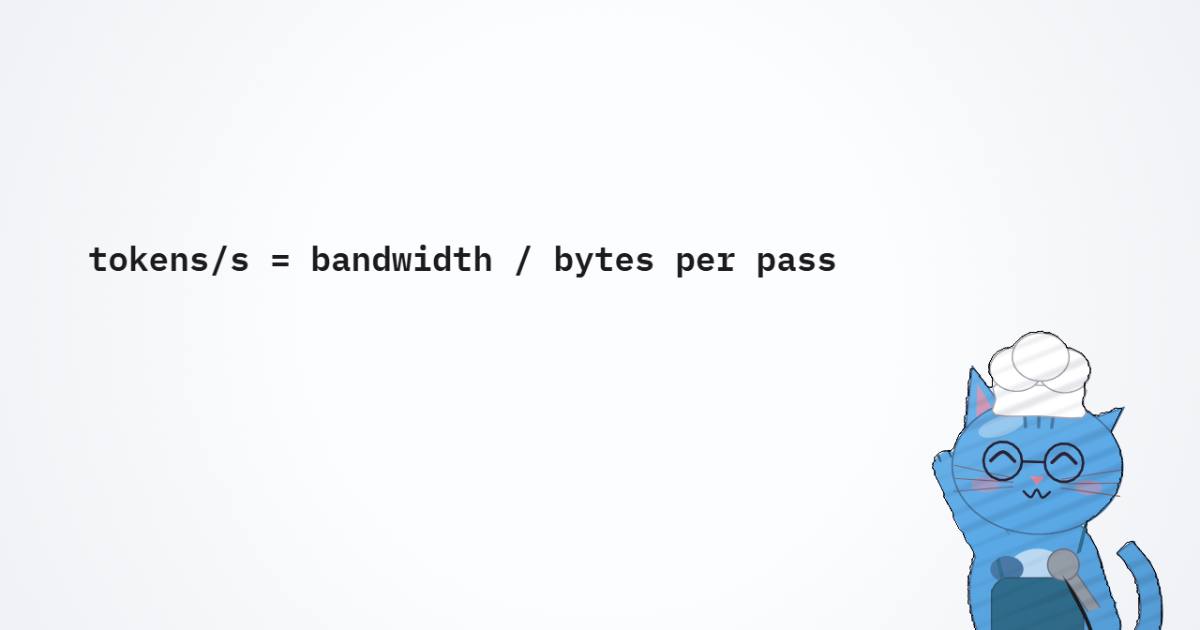
Qwen3.8-27B is mostly dense. Every decoded token has to stream close to eighteen gigabytes of weights out of unified memory. The 40-core M5 Max moves 614 GB/s. Divide one by the other and plain decoding tops out at about 35 tokens a second, however good the kernels are. So the 200 depends almost entirely on speculation. What I wanted to know was how many tokens each verification pass has to land, and whether anyone measured that.
What I didn't expect was that the most careful answer would come from the repository itself. Lithos's research notes are unusually honest. They say plainly that the chart in the launch blog is a projection. They say fusion on its own doesn't beat a well-tuned multi-dispatch control, and that the assumed acceptance rate was never measured. This article explains how the engine works and then puts those notes next to the launch claim.
- license
- Apache-2.0
- branch
- main
- tests
- 151 files
- source
- 2.7 MB
- commit date
- 2026-10-08
by size of tracked source at this commit, file counts in brackets; docs, data and vendored trees excluded
Read at 236475f (7 October 2026). The research notes it links live at 46b2bc4 under docs/research/.
local clone, 2026-10-08 at 236475f — branch, commit, commitDate, fileCount, hasTests, languages, license, licenseFile, shallow, testFileCount
shallow clone: counts describe the pinned tree, not the history
What one token costs the bus
Start with bytes, because the rest of the article depends on them. The
target is nvidia/Qwen3.8-27B-NVFP4,
a ModelOpt export. Despite the name it is mixed precision.
hf_quant_config.json marks every Gated DeltaNet and attention projection
FP8 and every MLP projection NVFP4 with group_size: 16. I read the three
safetensors headers with HTTP range requests and summed the tensors by group:
| Tensor group | Format | GB |
|---|---|---|
| MLP gate/up/down, 64 layers | NVFP4 codes | 8.556 |
| MLP block scales | FP8 E4M3, one per 16 weights | 1.070 |
| Gated DeltaNet projections, 48 layers | FP8 E4M3 | 5.536 |
| Full-attention projections, 16 layers | FP8 E4M3 | 1.678 |
| Small BF16 tensors (A/B projections, norms, conv) | BF16 | 0.053 |
| Vocabulary head | NVFP4 + scales | 0.715 |
| Read on every decode pass | 17.608 | |
| Token embedding (one row is gathered) | BF16 | 2.543 |
| Multi-token-prediction head, vision tower | various | 1.770 |
The file totals 21.92 GB, which matches the "21 GB of weights" note in the
backend's own config.json.
Only 17.6 GB of that moves per pass. The embedding is a gather, and the MTP
head and vision tower are never touched in text decoding.
There is state as well. Qwen3.8-27B interleaves three Gated DeltaNet layers
with one full-attention layer (full_attention_interval: 4), so 48 layers
carry a fixed recurrent state and 16 carry a KV cache. In lithos-metal the
GDN state is FP32, (v_heads, dk, dv) (monolith/nn/gdn.py:58). That is
48 × 48 × 128 × 128 × 4 bytes, 151 MB, read and written once per pass. The
KV cache is BF16 (monolith/nn/attention.py:89): 16 layers × 4 KV heads ×
256 dims × K and V × 2 bytes comes to 65,536 bytes per token of context. At
32K that adds 2.15 GB.
Apple's MacBook Pro spec page
lists the 40-core M5 Max at 614GB/s and the 32-core bin at 460GB/s.
lithos-metal's backend config records "nominal_gbps": 614.4. With those
inputs, a perfectly bandwidth-bound engine with no draft model decodes at:
No kernel improvement changes that ceiling. The only way past it is to make one pass over the weights produce more than one token. That makes this a speculative-decoding story with a kernel story attached.
The megakernel is per layer, not per step
When I hear "megakernel" I think of MPK's design: one persistent kernel for the whole forward pass, with workers pulling tasks from a dependency graph. The README rules that out for lithos-metal in its second section: "lithos-metal uses layer-wise fusion rather than one whole-model megakernel." In each selected layer, the token mixer (the GDN block or the attention block) becomes one dispatch. The MLP stays as two ordinary kernels. A decode pass is a sequence of these dispatches, recorded once into a Metal indirect command buffer (ICB) and replayed.
The blog gives the reason. Their probes on an M3 Pro and an M5 Pro "found that in-kernel global barriers were no cheaper than dispatch boundaries, and long dispatches could delay other GPU clients." That second point matters on a laptop, because the window server shares the GPU. A kernel that never returns makes the display stutter. Bounded dispatches give macOS a point at which it can preempt.
So where is the persistent part? It sits inside each mixer. Here is the Gated DeltaNet case as the blog draws it:
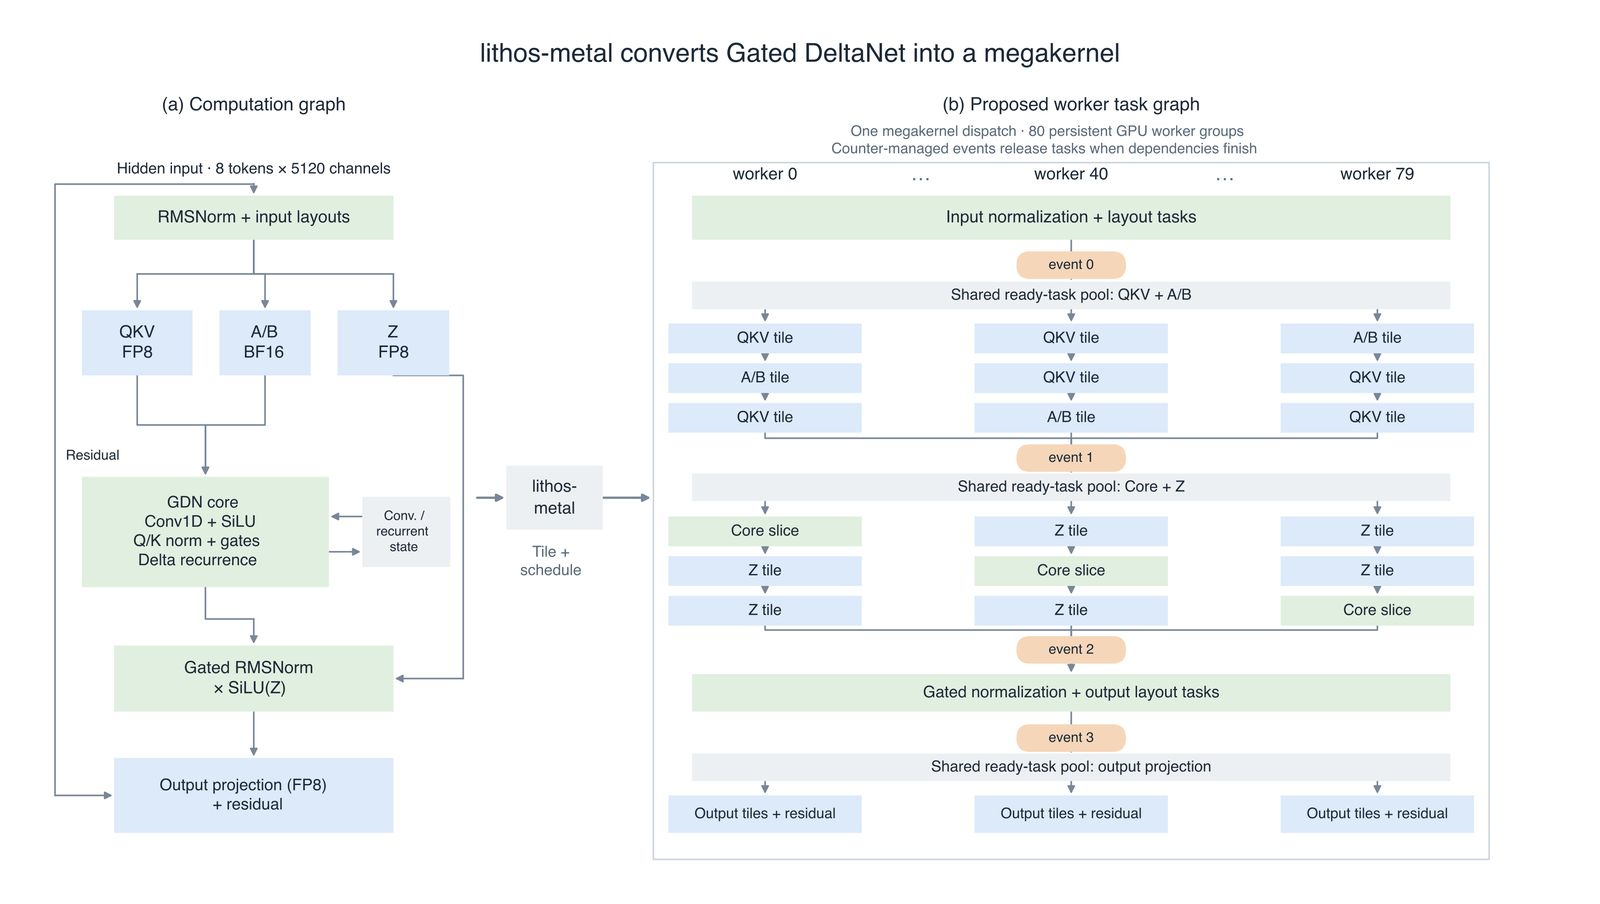
The interesting piece is how this gets compiled. monolith/compiler/static_fusion.py
does not write a new mixer kernel. It takes the existing multi-dispatch
program for the region (normalization, permutation, the projection GEMMs,
the GDN core, gated norm, output projection) and inlines each kernel's body
as a task() function inside one kernel. Every original dispatch becomes a
loop over task ids, strided by the worker count. A device-wide barrier
replaces each dispatch boundary that used to carry a dependency:
# monolith/compiler/static_fusion.py:1050-1053
sync='if (!stage_barrier(flags, worker, tid, ok)) return;' if i and o.barrier_before else 'threadgroup_barrier(mem_flags::mem_threadgroup);'
...
calls.append(f'{{ using namespace s{i};\n{sync}\nfor (uint task_id=worker;task_id<({count});task_id+={workers}u) {{ task('+','.join(args)+'); '+after+' }\n}\n')
o.barrier_before comes from an earlier pass, monolith/compiler/barriers.py,
which compares buffer read and write sets and leaves out a barrier wherever two
consecutive ops do not conflict. The docstring gives the motivating case: the
gate projection can run beside the mixer core instead of after the
projection that preceded it. Inside the megakernel, independent ops that share
a phase can also be drawn from one atomic queue instead of fixed strides:
# monolith/compiler/static_fusion.py:1077-1080
fetch=f'atomic_fetch_add_explicit(task_queue+{group[0]}u,{task_batch}u,memory_order_relaxed)'
...
body+='threadgroup_barrier(mem_flags::mem_threadgroup);\nconst uint first=queue_job;\nif(first>=total) break;\n'
The barrier is a counter per worker. Each worker bumps its own flag, then one SIMD group (32 lanes) polls every other worker's flag until all have reached the epoch. The spin is bounded:
// kernels/common/static_barrier_simd.metal:13-18
for (uint i = tid; i < WORKERS; i += 32u) {
  uint spins = 0;
  while (atomic_load_explicit(flags + i, memory_order_relaxed) < epoch) {
    if (++spins == 1000000u) { success = false; break; }
  }
}
The bound is there because Metal does not promise that every threadgroup you
launch is resident at once. If worker 79 never gets scheduled, an unbounded
spin hangs the GPU. lithos-metal instead writes an error code into the
step state, marks it done, and the Python engine raises
"Megakernel: bounded worker barrier timed out" (monolith/runtime/engine.py:105).
The GDN study records 723 such timeouts among its rejected tuning trials, so
the guard is doing real work.
This is a simpler scheduler than MPK's event graph. Tasks are grouped into phases with full barriers between them, and only inside a phase do workers pick work dynamically. The blog figures draw "events", but in the code those events are phase boundaries. For a mixer, with four or five phases per layer, I think that is the right call. The dependency structure is a chain, and a finer-grained graph would mostly add atomics.
Full attention follows the same template with one change that pays off at long context:
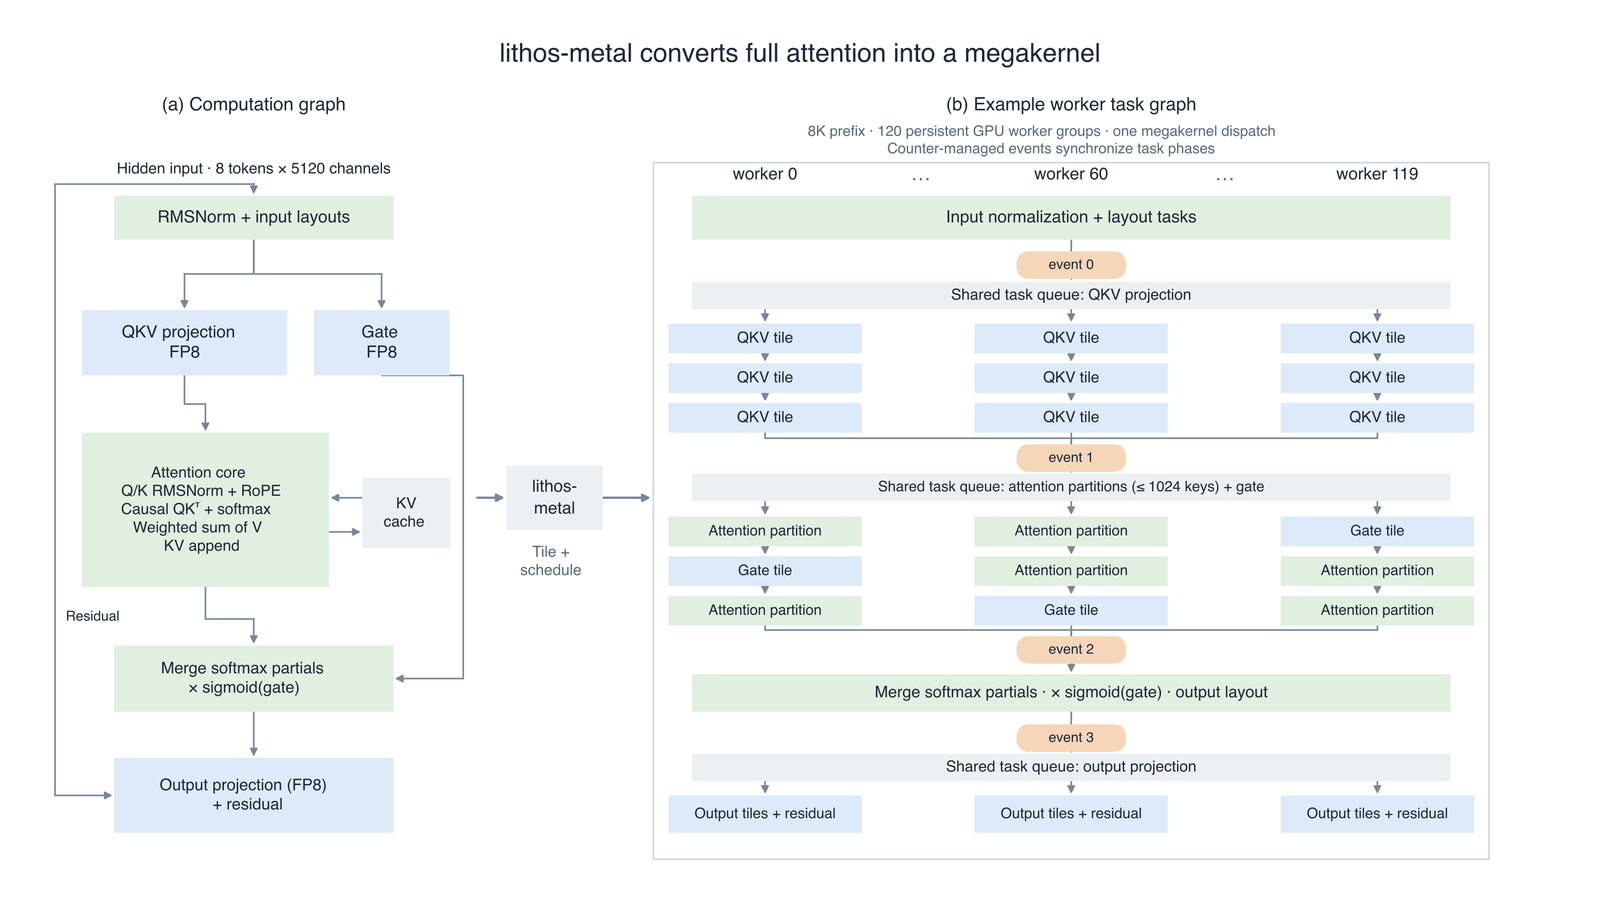
The KV range is split into partitions, and each task runs the online-softmax update over several 16- or 32-key tiles before it writes a single partial result:
Partition size is the main control. Small partitions give more parallel tasks but more partials to store and merge. Large ones do the reverse. Their attention study puts the 32K tier at 1,024 keys per partition, and the complete layer at 1,319 µs against 2,487 µs for their original kernels, a 47% cut. Most of that comes from this local reduction. The rest of the attention story is in the KV-cache architecture page.
The control experiment the blog leaves out
The blog leads with megakernels. The research notes have a less flattering experiment, and it is the most useful thing in the repository.
For every fused mixer, Lithos also benchmarked a matched multi-dispatch control: the same packed weights, the same tile geometry and the same task bodies, launched as separate kernels. This is the right control, because it separates "we fused it" from "we packed it better". The GDN mixer results, in mean µs per layer over all 48 GDN layers:
| Variant | µs per layer |
|---|---|
| Original Monolith kernels | 646.25 |
| Optimized megakernel (the default) | 599.72 |
| Matched packed multi-dispatch control | 596.02 |
| Fastest MLX-LM path | 1,050.12 |
The control is 0.62% faster than the megakernel. The study's own conclusion: "lossless operand packing and projection geometry supply much of this improvement; fusion does not establish a speed advantage over the same packing and projection optimizations." Attention comes out the same way. The selected multi-dispatch control is within 3% of the fused mixer at every context, faster at 128 and slightly slower at 32K. The DSpark draft study ran full rounds with only draft-mixer fusion toggled and got 53.04 ms fused against 52.83 ms unfused at 128 tokens, with overlapping ranges.
Publishing that table is to their credit. Most launches would report the 1.75× over MLX and attribute all of it to the headline technique. The honest reading is that lithos-metal is fast because of three less glamorous things:
- A weight layout built for the bus. The block-lane-major pack
(
monolith/formats/blm.py) arranges each matrix so that one load instruction across a 32-lane SIMD group reads 512 contiguous bytes. The docstring says that order "streams at 95 % of nominal on Apple10". - Tile shapes searched per chip and per context. The GDN study logged
7,105 trials. The selected recipes are checked into
monolith/backends/metal/m5_max_40c/recipes/, and they differ by context tier. - No CPU in the decode loop. The runtime encodes the whole step once and then submits command buffers that replay it eight times each, keeping three buffers in flight:
// runtime/src/metal_core.mm:325-326
for (size_t i = 0; i < r.resources.size(); i++) [en useResource:r.resources[i] usage:r.resource_usage[i]];
for (uint32_t s = 0; s < n; s++) [en executeCommandsInBuffer:r.icb->icb withRange:NSMakeRange(0, r.icb->count)];
Position, accepted count, anchor token, stop flags and the output ring all
live in a GPU-resident StepState. A replay after the request has finished
returns without doing work. The host's job is reduced to draining a token
ring. I think this is the part that will travel to other engines. Each
launch on Apple's driver is cheap, but a speculative round on this model
issues 313 dispatches by their count. Once the CPU is in that loop, the
CPU sets the speed.
Their 64-layer chain measurement, with real consecutive decoder layers and eight rows, is 38.155 ms. The full verification stage in their DSpark study, including the vocabulary head, is 38.03 ms. Against my 17.608 GB, that is 463 GB/s effective, or 75% of 614.4. A 1-row GEMV that streams at 95% of nominal does not turn an eight-row pass with attention, recurrences and barriers into 95%. 75% is a solid figure for a mixed FP8/NVFP4 pass on a laptop GPU.
How DSpark is wired in
DSpark is the drafter from DeepSeek; I covered the method in DeepSeek DSpark, and LFM2.5-DSpark is another place it shows up. In short, a small transformer reads features tapped from the target and drafts a whole block of positions in one parallel pass. A cheap sequential Markov head then corrects each proposal using the one before it.
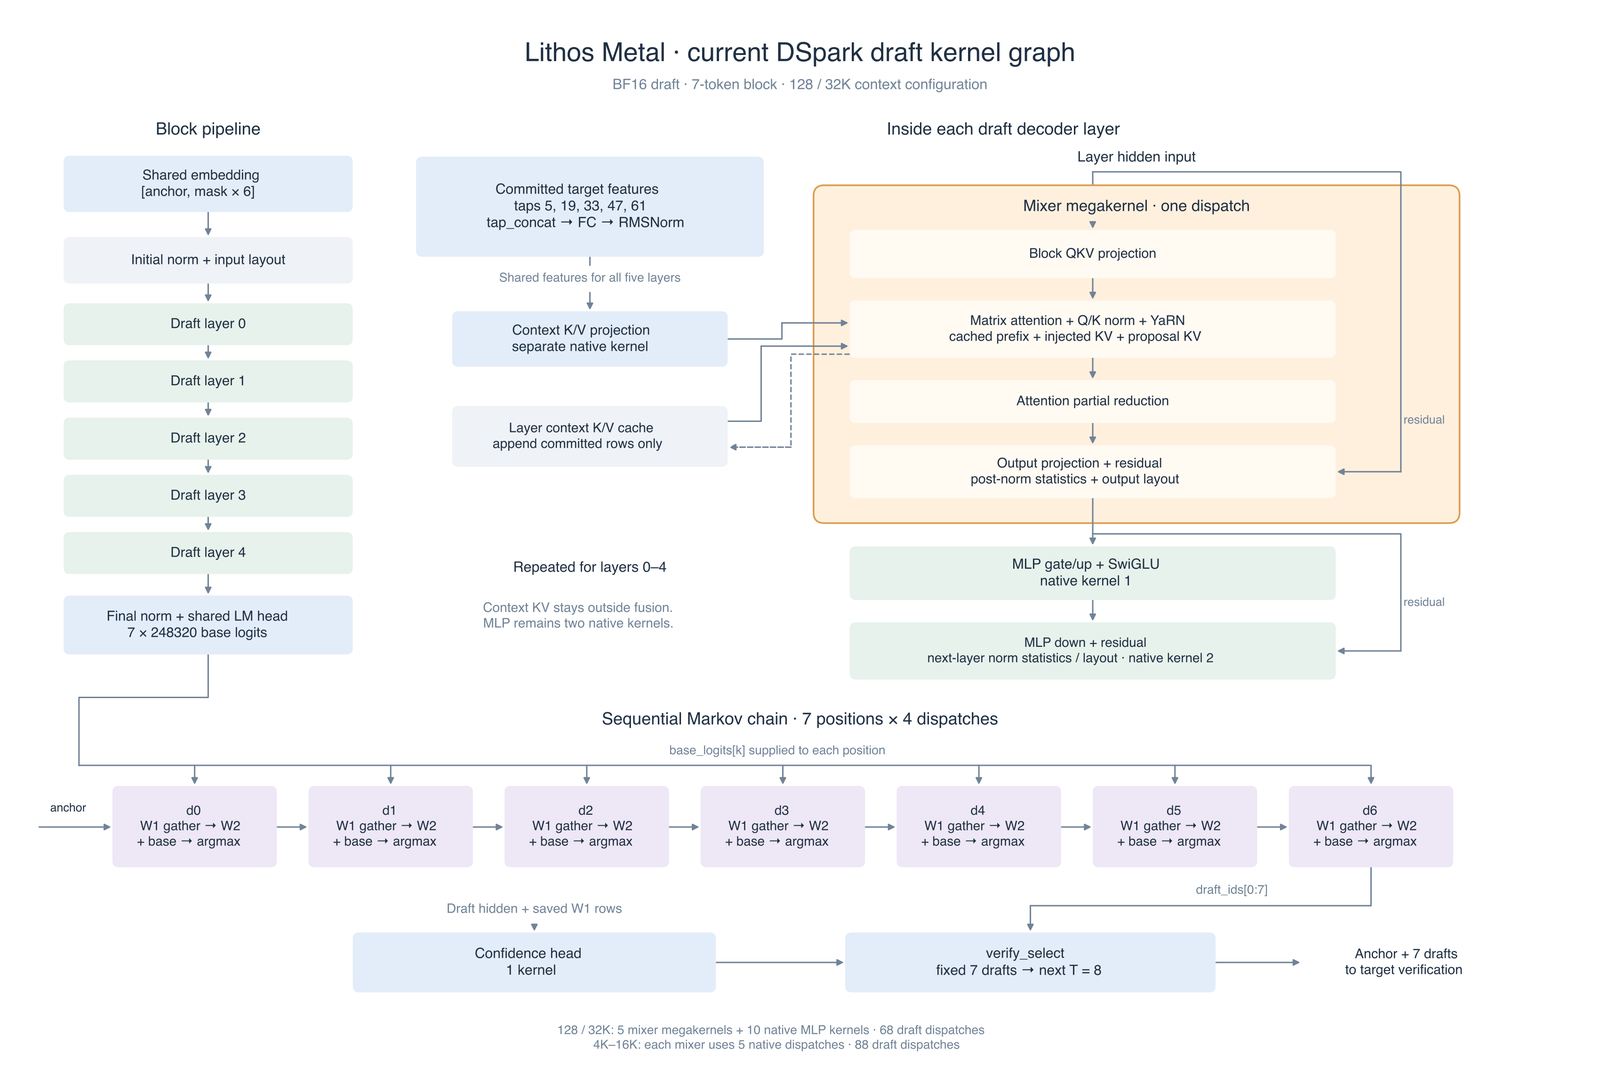
The head lithos-metal downloads by default is
LithosAI/Qwen3.8-27B-DSpark-NVFP4,
an NVFP4 re-export of RadixArk's BF16
Qwen3.8-27B-DSpark. Its
config has five full-attention layers at the target's width (hidden 5,120,
intermediate 17,408), taps the target after layers 5, 19, 33, 47 and 61,
uses a Markov rank of 256, and serves a block of 7. The Markov step is
written out in the graph builder:
# monolith/spec/dspark/model.py:395-408
# 3. the Markov chain: d_k = argmax(base_k + W₂·W₁[d_{k−1}]), d_{−1} = the anchor
...
for k in range(gamma):
    e_k = g.view(f"draft.markov.emb.{k}", markov, k, 1)
    g.op("embed", [prev, w1], [e_k], domain=BlockDomain("rows", 1), klass=OpClass.MAP, packed=True)
    lg = self.markov_w2.lower(g, e_k, residual=g.view(f"draft.base_logits.{k}", base, k, 1), name=f"draft.markov.{k}.logits").value
    ...
    prev = d_k
W₂ maps rank 256 to the full 248,320-token vocabulary, so each of those
seven steps is a full-vocabulary projection, and the steps cannot overlap.
They tried fusing all 28 stages of the chain into one kernel. It tied or
lost.
Acceptance is a single GPU thread at the end of the step, and it is short enough to quote whole:
// kernels/common/spec_ops.metal:165-166
while (acc < L && token[base + acc] == st->pending_tokens[base + acc + 1u]) acc++;
const int bonus = token[base + acc];
The target's sampled token at each verified row is compared with the draft
for that row. The matching prefix is accepted, and the target's own token
after it is committed as a bonus. So a round always commits between 1 and
8 tokens. GDN makes rollback awkward, because a recurrence cannot simply
truncate a cache. lithos-metal keeps two state slots per layer, alternating
by step parity: the verify pass reads one and writes the other
(monolith/nn/gdn.py:54-58). After acceptance, a commit pass goes back to
the slot the verify pass read and recomputes the recurrence over only the
committed tokens, whose count the accept scan wrote into checkpoint_index
(kernels/common/gdn_mixer.metal:312). That costs one more trip through the
state on every round, which my byte floor below leaves out. Rejected KV
entries are simply left in place and overwritten later. At nonzero temperature the server's default proposes
the drafter's argmax and accepts it only when it equals the target's
sampled token, the point-mass case of standard speculative sampling, so
output keeps the target's distribution
(docs/design/speculative-decoding.md).
Most of the draft work went into making the head cheap. With BF16 weights, the five draft MLPs alone stream 2.674 GB per block, and the first tuned draft took 10.66 ms of a 50.68 ms round. Re-exporting the head to NVFP4 brought the draft span down to 4.186 ms and the full round at 128 tokens to 42.611 ms. On their four regression prompts it produced the same 512 target tokens as the BF16 head.
I checked that 4.186 ms against bytes the same way. The NVFP4 head is
1,136,258,502 bytes. Leave out the BF16 Markov W₁ (only seven rows are
gathered), add six more reads of the 35.8 MB W₂, and add the shared
715 MB vocabulary head the draft also runs. That is about 1.94 GB per draft
block, or 3.16 ms at 614.4 GB/s. 3.16 out of 4.186 is 75%, the same
efficiency as the target pass, which suggests both are limited by the same
bus.
Rebuilding 200 tokens a second
Here are the three inputs: the round time, which Lithos measured; the bytes, which I counted; and the tokens committed per round, which depends on the workload. Tokens per second is tokens per round divided by round time. Pick an acceptance level and see where it lands:
- measured round
- 42.61 ms
- at this τ
- 80 tok/s
- floor share of round
- 76%
- τ needed for 200
- 8.52, past the max of 8
What the published numbers say:
The peak. Lithos's fastest published round is 42.611 ms, NVFP4 draft at 128-token context. Their timing fixture happens to accept all seven proposals, so each round commits 8 tokens: 8 / 42.611 ms = 188 tok/s. For a round that commits 8 tokens to reach 200, it must finish in 40.0 ms or less. No round time I could find in the repository or its research notes is that fast. The launch was also a few days after those measurements, so a faster recipe may exist that I can't see. At 32K the same round takes 57.472 ms, and the best case falls to 139.
The typical case. The same study ran four prompts (code, math, chat, text) for 128 tokens each with the refined NVFP4 head. It took 150 rounds to deliver 508 decode tokens, 3.39 per round, at 12.470 GPU ms per token: 80 tok/s. RadixArk's own model card measures this drafter's acceptance length on 17 workloads with a GPU server. The coding sets fall between 3.35 (LiveCodeBench) and 4.06 (MBPP). At 42.611 ms per round that is 79 to 95 tok/s. At 32K it is 58 to 71.
So "200+ peak" is roughly the instantaneous rate of a round in which the
drafter guessed all seven tokens. A token-rate meter on a demo video will
show that on easy, repetitive text, and it is real in that narrow sense.
It is not what a coding agent will see on average, and the repository
tells you so. docs/design/speculative-decoding.md ends with a sentence I
wish every launch carried: "A target-only timing divided by an assumed
acceptance count is a projection. It does not include drafting, acceptance
processing, state commit/rollback, prefill, or serving overhead."
In the replies, Jia said they "observe 120-130 TPS when context length grows to 32K-64K". The measured 32K round is 57.472 ms. 120 to 130 tok/s at that round time needs 6.9 to 7.5 tokens per round, close to full acceptance on every round. 127 is also exactly the number the README's projection gives at 32K. I can't tell from the outside which one he meant, but the published round time supports the projection, not a typical measurement.
The ratio between what you get and what you could get is still worth having. A bandwidth-bound engine with no draft gives 34 tok/s. On the same chip, lithos-metal with DSpark gives roughly 80 to 95 on code at short context. That is about 2.5× the hard ceiling of plain decoding, and the reason to care about this engine.
The chart, and what it compares
The blog's results section is one chart:
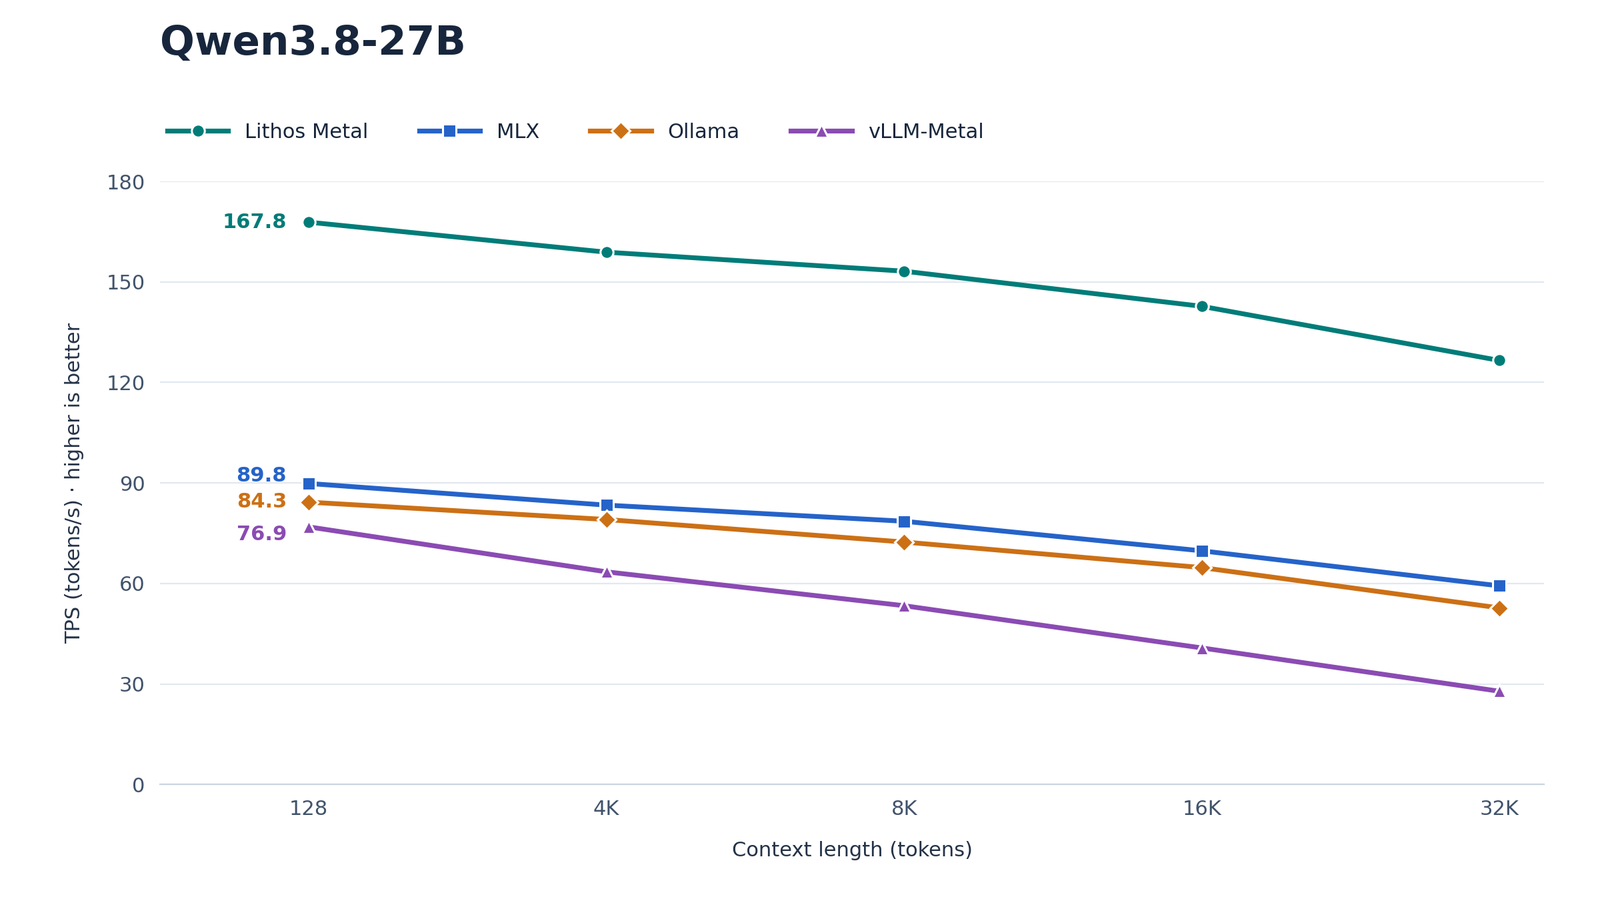
The README calls it a target-compute projection, and the backend study behind it is clear about three problems. I'll add a fourth.
- Six tokens per pass is assumed. The study states that "the assumed six-token acceptance has not been measured." Their own four-prompt run delivered 3.39.
- The scopes differ. Lithos and MLX are sums of 64 isolated layer minima, with no embedding and no vocabulary head. 6000 / 167.8 implies 35.76 ms. Their own chained 64-layer measurement is 38.155 ms, and the verification stage with the head is 38.03 ms. On that basis the Lithos point at 128 is about 158, not 168.
- Drafting is excluded. In a real round the NVFP4 draft adds 4.186 ms.
- Ollama was given more bytes to read. Ollama could not load the checkpoint's scalar FP8 scales, so the benchmark rebuilt every FP8 projection as BF16. That doubles 7.214 GB of FP8 weights and gives Ollama about 24.8 GB per pass instead of 17.6. Ollama's measured 71.19 ms per eight-row pass works out to 349 GB/s of effective bandwidth. Lithos's 38.03 ms on 17.6 GB works out to 463 GB/s.
The fair comparison from their own data, with the same scope (full eight-row target forward including the head) and both measured, is 71.19 against 38.03 ms at 128 context (1.87×) and 113.82 against 48.69 ms at 32K (2.34×). About 1.41× of the short-context gap is the extra bytes Ollama was made to read. Lithos's per-byte advantage at 128 is about 1.33×. At 32K the gap widens because of the attention work described above, and that part is real. vLLM-Metal is worse off still: version 0.30.0 rejects speculative verification for hybrid GDN models, so its curve is a paged-prefill proxy. The study says so in bold.
None of this is hidden. The study's own words: "The different scopes and summary statistics prevent a direct end-to-end speedup claim across all four curves." The blog then describes the same chart as showing "approximately 1.8–2× the throughput of MLX and Ollama". The research notes are careful; the marketing copy drops the caveats.
"One command" for a coding agent
The agent integration is the part most people will actually use, and it really is one command once the server is running:
brew install lithos-ai/tap/lithos-metal
lithos-metal serve --model nvidia/Qwen3.8-27B-NVFP4   # fetches the NVFP4 DSpark head too
lithos-metal claude                                    # or opencode, codex, hermes, run -- <client>
The launchers are in monolith/serving/clients.py. They find the served
model at /v1/models and start the client with process-local environment
variables, without touching your global config. For Claude Code that means:
# monolith/serving/clients.py:44-54
if name == 'claude':
    env.update(ANTHROPIC_BASE_URL=url, ANTHROPIC_AUTH_TOKEN=key, ANTHROPIC_API_KEY=key,
               ANTHROPIC_MODEL=model, ANTHROPIC_DEFAULT_OPUS_MODEL=model,
               ANTHROPIC_DEFAULT_SONNET_MODEL=model, ANTHROPIC_DEFAULT_HAIKU_MODEL=model,
               CLAUDE_CODE_SUBAGENT_MODEL=model, CLAUDE_CODE_DISABLE_NONESSENTIAL_TRAFFIC='1',
               CLAUDE_CODE_DISABLE_EXPERIMENTAL_BETAS='1',
               CLAUDE_CODE_MAX_CONTEXT_TOKENS=str(context),
               CLAUDE_CODE_ATTRIBUTION_HEADER='0',
               MAX_THINKING_TOKENS='0',
               CLAUDE_CODE_MAX_OUTPUT_TOKENS=str(min(4096, context // 4)))
The server speaks Chat Completions, Responses and Anthropic Messages, with
tool calls and streaming. Every model alias the client might request is
pointed at the same local model, thinking is turned off, and output is
capped at 4,096 tokens. Before you plan a workday around it, there are three
limits in docs/design/serving.md to know about:
- One generation at a time. "Overlapping requests receive HTTP 429." An agent that fans out subagents or makes a background call while the main turn streams will get refusals. The launcher points subagents at the same model, but it cannot serialize them.
- 32K context by default. A coding agent's system prompt and tool
schemas use a meaningful part of that before your repository shows up.
--max-contextraises it within the 48 GB, at the KV cost worked out above. - Prefill was not the target. The DSpark study says it "does not optimize prefill/TTFT". Exact-prefix checkpoints restore both target and draft state on a cache hit, which helps a lot in an agent loop where every turn shares the system prompt. The first read of a large file is still prefill, and none of the speed numbers above cover it.
Formats, and what runs where
The engine has five weight-format plugins in monolith/formats/: BF16, FP8
E4M3, INT8, affine INT4 (the MLX/AWQ/GPTQ layout, kept bit-exact) and NVFP4
(E2M1 codes, an E4M3 scale per 16 weights, an FP32 tensor scale). Arithmetic
is always weight-only. Activations and residuals are BF16, accumulation
and recurrent state FP32 (docs/design/design.md:130). The NVFP4 docstring
records something I liked: they checked the convention on the real
checkpoint, found the block-scale codes top out at exactly 448, and showed
that reading the tensor scale as a divisor gives values of 7.9e4 instead of
an absmax of 0.98. That is the kind of mistake that silently produces
garbage, and they ruled it out with a measurement.
Hardware support is narrow, and the README says so. Only the 40-core M5 Max has measured megakernel recipes for the large models. The M5 Pro has measured kernels for smaller models. The M3 Pro has a probe-derived config. The M4 Pro and the 32-core M5 Max get an "unmeasured native fallback" with no automatic fusion and the tensor accelerator off. Since the 32-core bin has 460 GB/s against 614, the same arithmetic puts its plain-decode ceiling 25% lower before you lose the tuned recipes. Splash, a different Metal engine for this model, hit the same line between the two M5 Max chips.
What I'd take from it
lithos-metal is a well-built engine with an overstated tweet. The code matches the documentation, the research notes publish their rejected trials and controls, and the speed on short code-shaped prompts, about 80 to 95 tok/s for a 27B model on a laptop, is a real result that sits at 75% of what the bus allows.
The design lesson differs from the headline. Fusing a mixer into one dispatch is worth roughly nothing once the multi-dispatch version gets the same packing and tiles. What pays is the work around it: weight layouts that stream at close to nominal bandwidth, tile shapes searched per chip and per context, a speculative round that never returns to the CPU, and a draft head re-quantized until it stops dominating the round. If you run another engine on Apple silicon, those are the parts to copy.
For readers deciding whether to install it: with a 40-core M5 Max and 48 GB, it is the fastest documented way I know of to run this model locally for one user at a time. Expect speeds in the 80s on code, not 200, and keep the agent's parallelism at one. On any other Mac, wait for measured recipes. For other ways to run the same model, see Qwen3.8-27B variants for the bytes-per-token trade-offs across quantizations, Cinference for what a datacenter number for this model counts, and How LLM inference works for why decode is a bandwidth problem at all. Kimi K3's TPU megakernel is the opposite design choice, a whole model in one kernel, if you want the comparison.
How I checked
- Repository. Shallow clone of
lithos-ai/lithos-metalat236475f(7 October 2026). I read the compiler (static_fusion.py,gdn_fusion.py,barriers.py), the barrier and steal kernels, the native runner (runtime/src/metal_core.mm), the DSpark model and spec kernels, the format plugins, the serving launchers and all seven design docs. I did not build or run anything, and I have no M5 Max. - Research notes. The README links four studies at commit
46b2bc4. I read those plus the DSpark integration study through raw.githubusercontent.com. Every round time, layer time, acceptance count and trial count above is copied from them. - Bytes. Safetensors headers of
nvidia/Qwen3.8-27B-NVFP4andLithosAI/Qwen3.8-27B-DSpark-NVFP4, read with HTTP range requests, summed per tensor group. State and KV sizes come fromconfig.jsonand the dtypes inmonolith/nn/. The floors ignore activations and pack padding. Lithos's pack reports the vocabulary head at 763 MB against 715 MB in the checkpoint, so the real floor is a few percent above mine. - Bandwidth. Apple's MacBook Pro spec page (614GB/s for the 40-core M5 Max, 460GB/s for the 32-core).
- Acceptance. Lithos's own four-prompt run, and RadixArk's model card for the BF16 drafter. RadixArk's figures come from SGLang on NVIDIA GPUs at temperature 1.0 with thinking enabled, so they are a guide to this drafter, not a measurement of lithos-metal.
- Not verified. The 200+ figure itself: it does not appear in the blog text's measurements, the README or the research notes. It probably comes from the launch video's live counter, which I couldn't inspect.