2026-09-22 · 17 min · inference-optimization · speculative-decoding · long-context · kv-cache · linear-attention · llm · explainer
satellitedown/fast-long-context-cinference
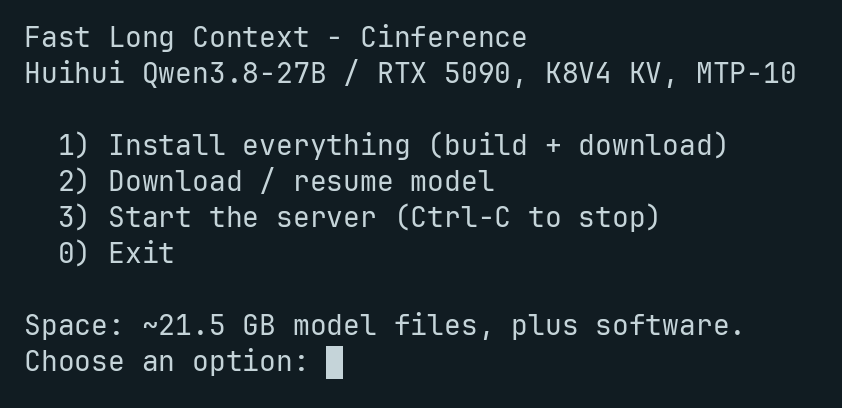
is a twelve-file repository that installs a C++/CUDA inference engine, downloads a
21.5 GB model and starts an OpenAI-compatible server, from one bash setup.sh. Its
results table is four rows:
| Prompt tokens | Tokens/s |
|---|---|
| 8,192 | 450.78 |
| 32,768 | 432.60 |
| 131,072 | 364.84 |
| 260,000 | 299.64 |
Throughput that survives a 32× increase in context is the interesting claim. Decode is memory-bound, attention cost grows with the sequence, and the KV cache stops fitting — so the normal shape of that table is a cliff. This one falls 33%.
The first question is always the same and it is the only one that matters: 450 tokens a second for whom? Four hundred and fifty aggregated across sixty-four concurrent users is an ordinary result. Four hundred and fifty for one user is not.
It is one user. That is the strong reading, and it is stated three times in the repository.
So the headline is honest, and it is the more impressive of the two claims it could have been. What follows is everything else the number depends on, because a per-user 450 tok/s from a 27B model on a consumer card is not a free lunch and the repository does not pretend it is.
The full denominator
Every figure in that table comes from
results/rtx5090-archive-recall.json,
which is 60 lines of JSON and is the most useful file in either repository. Unpacked:
| Hardware | one NVIDIA GeForce RTX 5090, 32 GiB |
| Model | Huihui Qwen3.8-27B abliterated, NVFP4 weights, 21,492,938,224 bytes |
| Engine | Cinference 44e9603, a fork of NInfer 9e163ee |
| Concurrency | 1 |
| Speculation | MTP, 10 draft tokens, --lm-head-draft |
| KV cache | k8v4 — FP8 keys, 4-bit values |
| Context ceiling | 262,144 · prefill chunk 1,024 |
| Sampling | temperature 0, thinking off, max_output_tokens 256 |
| Workload | "deterministic archive recall with six markers at 1%, 10%, 25%, 50%, 75% and 95% depth" |
| Samples | one cold-prefix request per context checkpoint |
| The metric | the server's predicted_per_second: (generated - 1) / decode seconds, excluding prompt processing |
Two things in that list do most of the work, and neither is in the headline: MTP-10 and the workload.
The 450 is a speculation number
The draft acceptance rate is recorded next to every measurement, and the repository's own MTP tables let you pin down what it means. At three draft tokens and 76.3% acceptance the same tables report 3.29 tokens per round; at 89.5% they report 3.68. Both satisfy
for acceptance and draft window . At and that is 10.31 tokens per verification round; at , 10.85.
Divide the measured rate by that and you get the wall clock of one round. Compare it
against the same model, the same card and the same NVFP4 weights with speculation
switched off — run N0 in
docs/performance/qwen3.8-27b.md,
which that page is careful to label a retained upstream NInfer result rather than a
Cinference one.
Without speculation this engine does 71.2 tok/s at 8K and 52.9 at 260K. The headline is 6.33× and 5.66× those numbers. Everything above 71 is the draft head being right about the next ten tokens.
That is not a criticism — that is what speculative decoding is for, and getting 6× out of it is a good result. But it relocates the claim. This is not a faster forward pass and not a cheaper attention kernel. It is one forward pass amortised over ten tokens, and it is worth exactly as much as the draft head's hit rate.
A sanity check on the no-speculation line, since it is now load-bearing: 19.729 GiB of weights in 14.04 ms is 1.51 TB/s of weight traffic, about 84% of the RTX 5090's 1,792 GB/s. The plain decode step is doing what a plain decode step does — streaming the whole model through the memory bus — and it is doing it efficiently. The engine is not leaving performance on the table; it is buying tokens per byte read.
Why the long-context figure holds up
Here is the part the table does not show, and it is the article's actual finding.
Two things happen between 8K and 260K and they point in opposite directions.
The step gets slower. 14.04 ms to 18.90 ms, a 35% increase, exactly as the physics says it should: the K8V4 cache at 260,096 tokens is 6.69 GB, which at 1,792 GB/s is 3.73 ms of extra reading per step. The observed increase is 4.86 ms. The cache accounts for about three quarters of it and the gated-DeltaNet state and lower tail efficiency account for the rest.
The draft head gets better. Acceptance rises from 93.1% to 98.5%. Of course it does: the workload is archive recall, where the model is asked to find six planted markers in a haystack and repeat them. Longer haystack, more verbatim text to copy, easier next-token prediction. Tokens per round go from 10.31 to 10.85.
The second effect cancels most of the first. The engine did not defeat long-context decay; the workload paid for part of it. On a task where the model composes rather than copies, both curves move the same way and the fall is much steeper.
The repository says so itself, in the limitations array of the same results file:
275.73 is under 300. The "stays above 300 TPS even at 256K" claim rests on one of the
two recorded observations of that point. It is measured rather than projected — but n =
1 per checkpoint, the results file says so in its sampling field, and the file records
the other draw.
How much slower is "much slower"
The repository answers this too, for a different draft window. The MTP3 cross-scenario
tables in docs/performance/qwen3.8-27b.md run the NVFP4 weights over three fixtures
× five seeds per category, at one request in flight:
| Workload, MTP3, NVFP4, C=1 | Acceptance | Tokens/round | Decode |
|---|---|---|---|
| Structured output | 90.8% | 3.72 | 219.8 tok/s |
| Code | 76.4% | 3.29 | 194.3 tok/s |
| Translation | 75.0% | 3.25 | 192.3 tok/s |
| Story | 37.4% | 2.12 | 126.1 tok/s |
Synthetic recall at 93–98% sits above every one of these. Story writing sits at 37%, which is a 1.7× multiplier on a plain step rather than a 6× one. Widening the window from 3 to 10 does not rescue a low acceptance rate — a chain that breaks at the second draft never reaches the tenth — so the honest expectation for free-form prose on this setup is somewhere between the 52.9–71.2 floor and the 126 that MTP3 gets, not 450.
The 107 seconds nobody mentions
The project is called Fast Long Context. The decode rate at 260,000 tokens is 299.64 tok/s. The prefill for that same request takes 106.72 seconds.
| Prompt tokens | Prefill (s) | Prefill rate | Decode |
|---|---|---|---|
| 8,192 | 0.90 | 9,093 tok/s | 450.78 tok/s |
| 32,768 | 4.39 | 7,453 tok/s | 432.60 tok/s |
| 131,072 | 32.40 | 4,044 tok/s | 364.84 tok/s |
| 260,000 | 106.72 | 2,436 tok/s | 299.64 tok/s |
Prefill throughput falls 3.7× over the same range that decode throughput falls
1.5×. Each 1,024-token chunk has to attend over everything before it, so the 16
full-attention layers' prefill work grows with the square of the sequence, and there is
no draft head to amortise any of it. The upstream N0 run measures the same thing as
a server-side TTFT: 118,354.8 ms ± 717.2 at 260,096 tokens.
So a 256K session on this box is: wait two minutes, then read at 300 tok/s. That is a perfectly reasonable shape for a document-analysis tool and a bad one for a chat UI, and it is the number I would want in the README next to the other one. Prefix caching helps on the second turn and there is nothing here that measures it.
The cache codec is rotate-then-quantize
k8v4 is not a standard name, and the kernel comment explains it in two lines:
// src/ops/kv_cache/append/k8v4_kernel.cuh:3
// Asymmetric K8V4 append kernel. K uses the existing row-256 E4M3 cache codec; V uses the
// group-16 packed E2M1 cache codec. Both operands receive the fixed FP32 D256 Hadamard rotation.
Three things worth naming there.
Keys get 8 bits, values get 4. That asymmetry is the standard finding — key outliers move attention scores, which then go through a softmax that amplifies the error, while value outliers move the output linearly. Spending the bits on K is the right call and it is what TurboQuant concluded from a different direction.
Both operands are Hadamard-rotated before quantization. This is TurboQuant's central claim shipping in a production engine: rotate the vector by an orthogonal matrix first and its energy spreads evenly across coordinates, so there are no outliers left to clip and one data-free quantizer fits every vector. A fixed D256 Hadamard is the cheap instantiation — no randomness, no calibration set, and it is its own inverse up to a scale.
The V codec is NVFP4 in all but name. Group-16 packed E2M1 with a one-byte scale per group is exactly the format NVIDIA published, applied to the value cache rather than to weights. Which makes this the same month's second shipped 4-bit KV cache — SGLang's is the other — and the two differ on precisely the question TurboQuant raised. Cinference rotates. SGLang does not, and relies on the 16-element block to localise outliers instead.
What is actually holding the context
Quantizing the cache is the visible move. The structural one is in the model.
Qwen3.8-27B is not a transformer with 64 attention layers. Its published geometry, in the
engine's own docs/maintainer/qwen3_5-model.md, is 64 text layers of which 16 are full
attention and 48 are gated DeltaNet, with the full-attention layers at indices
3, 7, 11 and so on. The 48 linear layers hold a fixed-size recurrent state — 48 layers
× 48 value heads × 128×128 in FP32, which the engine's own ReplaySSM
note computes as exactly 144 MiB, regardless of context length.
So three quarters of this model does not have a KV cache to quantize, and three quarters of its per-token attention work does not grow with the sequence.
The honest version of "256K on a 32 GB card" is therefore: the architecture removes 75% of the cache, FP8 removes half of what is left, and K8V4 removes a further 1.8 GiB that you do not strictly need. BF16 is the only setting that does not fit.
This also reframes the headline table. A 33% decode falloff from 8K to 256K would be remarkable on a dense-attention model. On a 3:1 linear-to-full hybrid where only 16 layers read a growing cache, it is roughly what you would predict — and the same architectural choice is what makes vLLM's 2.4T numbers legible, where the linear layers' per-request state is 37% of the KV budget and sets the block size for everybody else.
What the fork changed
upstream-provenance.json is unusually candid: fifteen modified paths against NInfer
9e163ee, and a three-line statement of what they do.
"summary": [
  "Raise the product MTP draft-token cap from five to ten and extend related round buffers, contracts, and coverage.",
  "Derive MTP CUDA Graph topology classes from captured node-type and kernel-function signatures while separating batch sizes.",
  "Preserve native binaries, API symbols, .ninfer format, and build organization."
]
That is the whole delta. The paths bear it out — include/ninfer/ops/mtp_round.h,
src/ops/kernel/mtp_round.cuh, src/core/decode_graph.cpp,
src/models/qwen3_5/program/round_buffers.h, and the two tests that cover them. There is
no new attention kernel, no new cache codec, no new scheduler. k8v4, NVFP4 weights,
paged KV, the 262,144 context ceiling and the Hadamard rotation are all upstream NInfer.
Which means the fork's contribution to the headline is: the draft window went from 5 to 10. On a workload that accepts 93–98% of drafts, doubling the window is close to doubling the tokens per round, because the acceptance chain rarely breaks. On story writing at 37% acceptance it would buy almost nothing — the expected chain length at is , which converges to about 1.6 whether the window is 5 or 10 or 50.
The second change is the more generally useful one and it is not in the headline at all. Matching CUDA Graph profiles by their captured node types and kernel function signatures, rather than by the planned context range, lets configurations that compile to the same graph share one executable. On a single-request server with a 262,144-token ceiling, the number of distinct decode shapes is large and the capture cost is paid at startup; sharing executables across them is the kind of change that shows up as a shorter warm-up rather than a bigger number.
What I would take away
- Ask "450 for whom" first, every time. Here the answer is the good one — batch size one, stated in three places — and that makes it a strong per-user result. A great many inference posts answer the other way and do not say so.
- A speculative-decoding throughput number is a statement about the workload. 450 on recall, 219.8 on structured output, 126.1 on story, from the same repository's tables. Quote the acceptance rate next to the throughput or the throughput means nothing.
- Long-context resilience here is architecture, not engineering. 48 of 64 layers have no growing cache. Measure a 3:1 hybrid against a dense model and you are measuring the model.
- The repository publishes its own counter-evidence. A
limitationsarray naming the workload bias, a repeat observation below the claim, and a docs page that labels which tables are upstream and which are the fork's. That is more discipline than most benchmark posts manage, and it is why this piece could be written at all.
Related reading: what a prefill and a decode actually cost; rotating the KV cache before you quantize it; the NVFP4 format itself; SGLang's 4-bit KV cache, which makes the opposite choice about rotation; and continuous batching on a small box, which is what the aggregate-throughput version of this question looks like.
What would change my mind
7 claims above, and what would falsify each
The 450 tok/s figure is single-request, not aggregate.
runtime-manifest.jsonsets"max_concurrency": 1,scripts/serve.shpasses it through as--max-concurrency 1, and the results file records"max_concurrency": 1in its profile block. If a later revision raises that default, or if the native server treats the flag as a soft hint and admits more, this is wrong — and the whole framing of the article flips, because 450 aggregate over even four streams would be an unremarkable number.Without speculation the same setup does 71.2 tok/s at 8K and 52.9 at 260K, so the headline is 5.7-6.3x a plain step.
Run
--spec none(MTP0) on the shipped profile at 8,192 and 260,000 tokens. My numbers are runN0fromdocs/performance/qwen3.8-27b.md, which is a different campaign — 2026-08-17, CUDA driver API 13.3, stochastic sampling, five samples, contexts 7,680 and 260,096 rather than 8,192 and 260,000, and the page explicitly labels it a retained upstream NInfer result rather than a Cinference one. A fresh MTP0 baseline at the recall workload's exact settings could move these by enough to change the multiplier, though it would have to move by a factor of four to change the argument.Long-context throughput holds up because draft acceptance rises on this workload, not because the engine avoids the usual decay.
The step-time series is the test. Take the MTP-10 rate and the acceptance at each checkpoint, compute
(1 + 10a) / ratefor the round time, and check whether it grows the way the MTP0 step time grows. I get 22.87 → 36.21 ms against 14.04 → 18.90 ms, so the round degrades faster than the step and only the rising acceptance keeps the tokens-per-second up. If someone runs the same context sweep on a composition workload and the rate still lands above 300 at 256K, the decay really is being handled in the engine and I have the mechanism wrong.Ordinary prose on this setup is far below 450 tok/s.
The repository's own MTP3 story category measures 37.4% acceptance and 126.1 tok/s on NVFP4 at C=1. What I do not have is MTP-10 on prose — nobody has published it. If the wider window recovers substantially more than the geometric-series estimate suggests (about 1.6 accepted tokens per round at that acceptance rate, window-independent), then MTP-10 does something for low-acceptance workloads that MTP3 does not, and my "between 71 and 126" expectation is too pessimistic.
The K8V4 cache costs 25.125 KiB per token, so a full 262,144-token context is 6.28 GiB.
Computed from the published geometry (16 full-attention layers, 4 KV heads, head dimension 256) and the two cache codecs in
src/ops/kv_cache/: K as 256 E4M3 bytes plus one FP16 row scale, V as 128 bytes of packed E2M1 plus 16 one-byte group scales. Start the server with--max-context 262144 --kv-capacity 262144 --kv-dtype k8v4and read the arena size it reports. If the pool carries per-page metadata I have not counted, the real figure is higher; if V shares a scale across a wider group, lower.Only 16 of the model's 64 layers keep a KV cache; the other 48 are gated DeltaNet with a fixed 144 MiB state.
docs/maintainer/qwen3_5-model.mdgives the geometry table (64 text layers, 16 full attention / 48 GDN, full-attention layers at indices 3, 7, ...) anddocs/maintainer/replayssm-gdn.mdcomputes the recurrent state image at 144 MiB for the 27B. Both are the engine's docs, not the model's card; if the shippedHuihui-Qwen3.8-27B-abliterated-NVFP4-NInfer-v3artifact carries a differentlayer_typesarray, every memory figure here is wrong in proportion. Dump it with the container's own inspector and count thefull_attentionentries.The fork's contribution to the headline is the draft window going from five to ten.
upstream-provenance.jsonlists fifteen modified paths and a three-line change summary, all of it MTP window, round buffers and CUDA Graph matching. If a diff againstNeroued/ninfer@9e163eeshows changes to the attention kernels, the cache codecs or the scheduler that the manifest does not mention, the attribution is wrong. I read the manifest and the file list; I did not diff the C++ line by line.
Read at satellitedown/fast-long-context-cinference commit 104b236 and
satellitedown/cinference commit 2205806 (results file rtx5090-archive-recall.json,
recorded 2026-09-21, engine revision 44e9603, upstream Neroued/ninfer@9e163ee). Both
repositories are Apache-2.0. No model was run: every number here is read out of committed
JSON and Markdown, or computed from the published geometry. I have no RTX 5090.