2026-08-25 · 12 min · on-device · benchmarks · quantization · inference
Why read this
Hightop 30%Reads Liquid's on-device dataset and checks it: a one-parameter KV model reproduces the 4x Granite gap, and a bandwidth model misses MoE speed both ways.
- Original analysis
- Runs on a phone
- Widely used
Inference & servingApache-2.0Practitioner dataset
How this was scored
- Is it new?
- 2 of 3: A real new idea, method or capability
- Can I trust it?
- 2 of 3: Measures key facts from files, code or configs
- Can I run it?
- 2 of 3: Open code or weights with real limits
- Will I understand it?
- 2 of 3: Mechanism from first principles with figures
- Can I act on it?
- 2 of 3: A concrete recipe, numbers or comparison
- Will it last?
- 2 of 3: A reference for a year or more
- Does it affect many?
- 2 of 3: A widely used model, tool or lab release
- Only here?
- 2 of 3: A teardown or measurement few others did
Score 70 of 100, ranked 119 of 577 rated articles. Each question is answered 0–3 by hand, and a 3 is rare. How articles are scored
If you have ever tried to answer "will this model run acceptably on a phone", you have run into the fact that nobody publishes the thing you need. Model cards report parameter counts and eval scores. Runtime repos report throughput on somebody's laptop. Device makers report TOPS. None of those is an answer, because on-device performance is a property of a deployment — this model, at this quantization, on this runtime, on this silicon, at the context length your app actually uses — and changing any one of those five moves the number, sometimes further than changing the model does.
Pipette, from Liquid AI in partnership with Artificial Analysis, is a benchmark suite built around that observation, and its best decision is the one it declines to make: it does not produce a ranking.
| What it is | a lab-verified dataset of 1,000+ model × quantization × runtime × device × context configurations, plus the clients that produce it |
| Coverage | 30+ models, context 256 → 8,192 tokens, llama.cpp on macOS / iOS / Windows / Android |
| Devices | MacBook Pro M5 Max · iPhone 17 Pro · Galaxy S26 Ultra — AMD Ryzen AI Max+ 395 and Radeon 8060S announced |
| Performance metrics | TTFT · end-to-end latency · prefill tok/s · decode tok/s · peak RAM |
| Quality evals | IFBench · GPQA Diamond · MATH-500, on the same quantized artifacts |
| Protocol | fixed token shapes, greedy decoding, discarded warm-up, five measured repetitions, readiness gating on thermal and load |
| Components | pipette-mgmt · pipette-clients · pipette-scores — Apache 2.0, plus iOS and Android apps |
| Verified by | Artificial Analysis reviewed the measurement methodology |
The shape of the problem
Every on-device speed claim you have read pinned all five of those axes and told you about none of them. That is rarely dishonesty — there was nowhere to put the conditions, so the number got quoted stripped of them and compared against another number measured under different ones.
The reason it bites harder on a phone than in a datacenter is that the conditions move the answer as much as the model does. The same GGUF at Q4_0 and Q8_0 is two deployments. The same quantization on Metal and on an Android CPU path is two deployments. And as it turns out, "350M parameters on a Galaxy S26 Ultra at Q4_K_M" is still not enough to pin a number down.
Two 350M models, four times apart
This is the finding I would put first, because it is the one most likely to change what somebody ships.
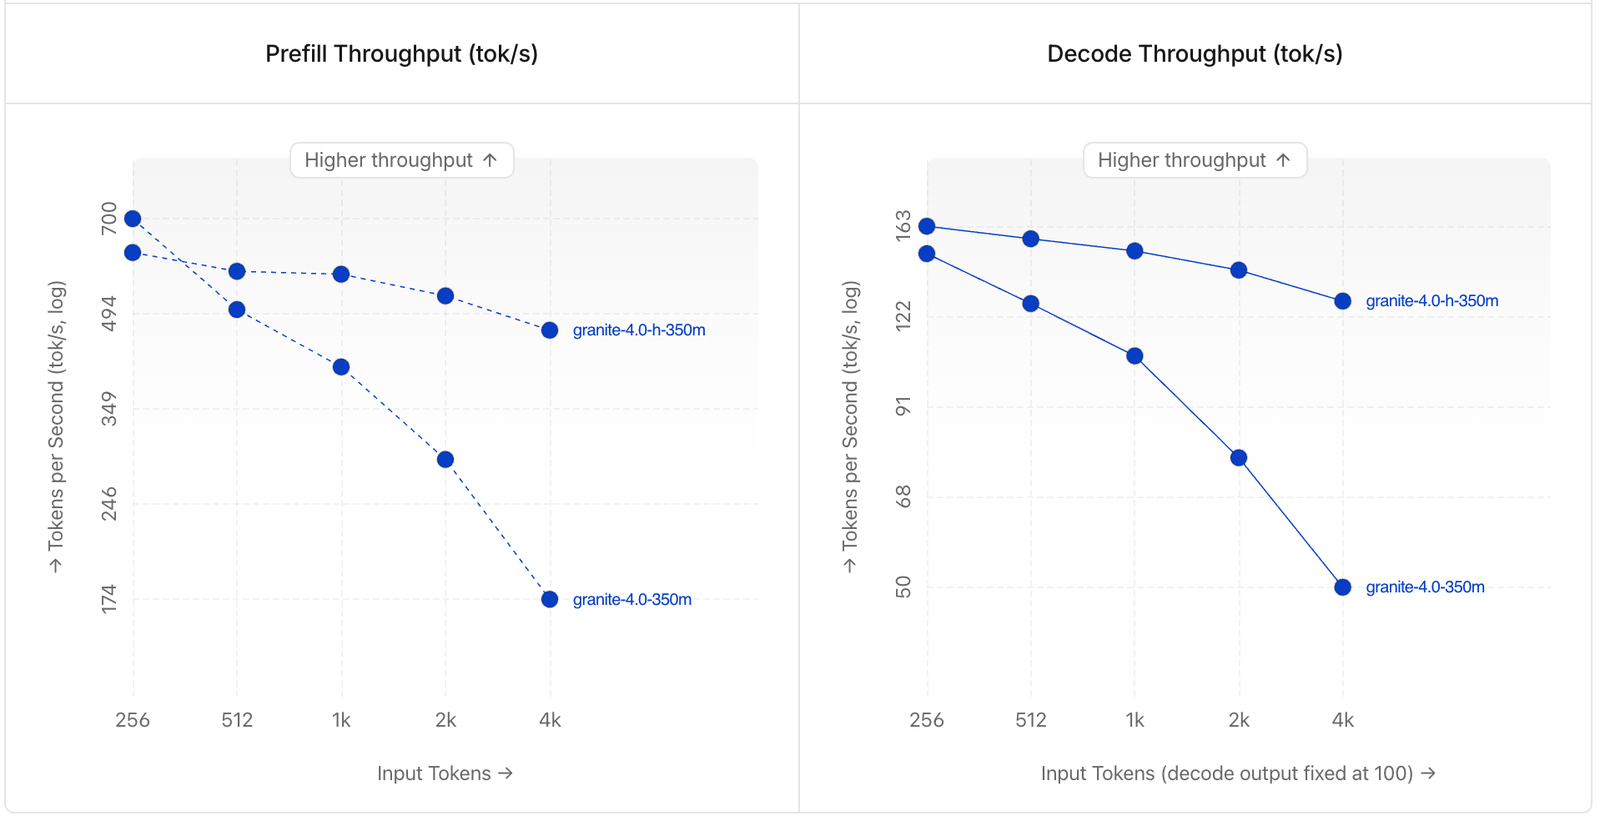
At Q4_K_M on a Galaxy S26 Ultra, Granite-4.0-H-350M retains 78.4% of its decode throughput going from 256 to 4,096 input tokens. Granite-4.0-350M retains 33.8%. Identical parameter count, adjacent names, same lab, same run conditions.
The mechanism is the KV cache, and it is worth being explicit because the interactive above is built on it. A full-attention layer must attend over every previous token, so per-token decode cost rises with the context. A recurrent or linear-attention layer carries fixed-size state and does not. The H is hybrid: most layers use the fixed-state mixer and only a small share do full attention.
Which gives a model with one parameter — the share of layers on full attention — and a per-token cost of a + b·f·L. Calibrate a/b so that f = 1 reproduces the plain model's measured 33.8%, and the hybrid's measured 78.4% falls out at f ≈ 0.125: about the attention share Granite's hybrid stack actually uses. Two independently published numbers, one physical model, a sensible parameter. That consistency is why I would trust the mechanism here and not merely the measurement.
The practical consequence is blunt. Almost nothing you build sends 256 tokens. Summarising a thread, answering over a document, running a few turns of chat history — all of that is thousands of tokens of input, which is the regime where these two models are four times apart and the spec sheet says they are the same.
Memory and speed come apart
LFM2.5-8B-A1B activates 1.5B of its 8.5B parameters per token. At 2,048 input tokens on a Galaxy S26 Ultra it decodes 2.4× faster than Qwen3.5-4B and 2.6× faster than Ministral-3-3B-Instruct-2512 — and peaks at 5.29 GiB, because every expert has to be resident whether or not it fires.
Decode is memory-bandwidth bound, so per token you pay for the weights you read. RAM is a residency question, so you pay for the weights you have. Sparse activation puts those two on opposite sides of a factor of five, and on a device with a hard memory ceiling that is the trade you are actually making: small-model speed at large-model footprint.
The more interesting half is where the arithmetic fails. The naive bandwidth model predicts 2.67× against Qwen3.5-4B and 2.0× against Ministral-3B; the measurements are 2.4× and 2.6×. Both wrong, in opposite directions. The residual is kernel quality, routing overhead, memory layout, and whatever the runtime happens to be good at — none of which is on any model card, and all of which is the reason a benchmark that runs on the actual device has to exist.
The reversal
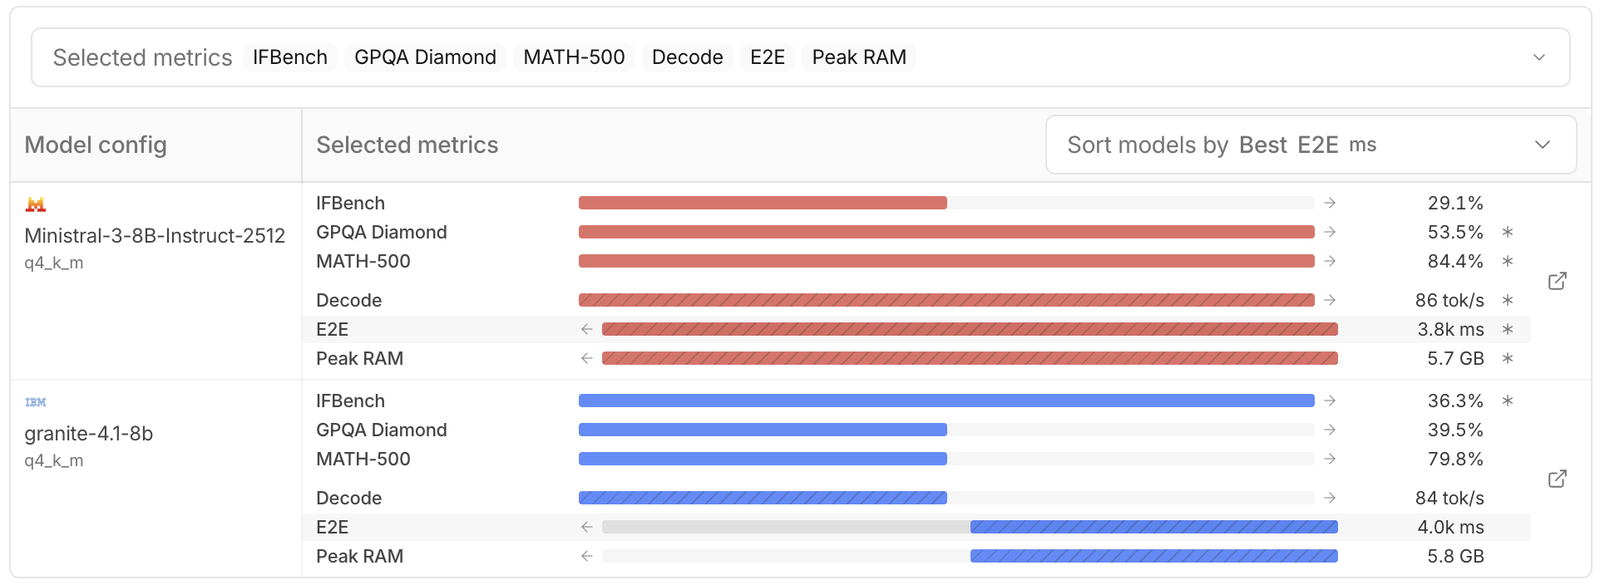
Granite-4.1-8B and Ministral-3-8B-Instruct-2512 differ by 2.4% in decode throughput and 1.2% in peak RAM. On any axis a deployment engineer would sort by, they are interchangeable. On quality evaluations of the very same Q4_K_M artifacts, Granite leads IFBench by 7.3 points and Ministral leads GPQA Diamond by 14.0.
There is no ordering of those two that is correct independent of what you are building. Which means a ranked list is not a lossy compression of the truth — it is a different claim, and a false one. That is the argument for a constraints panel rather than a leaderboard, and it is why Pipette's dashboard makes you supply the constraint: you are the only one who knows it.
The same point holds one size down, and Pipette gives it a clean example.
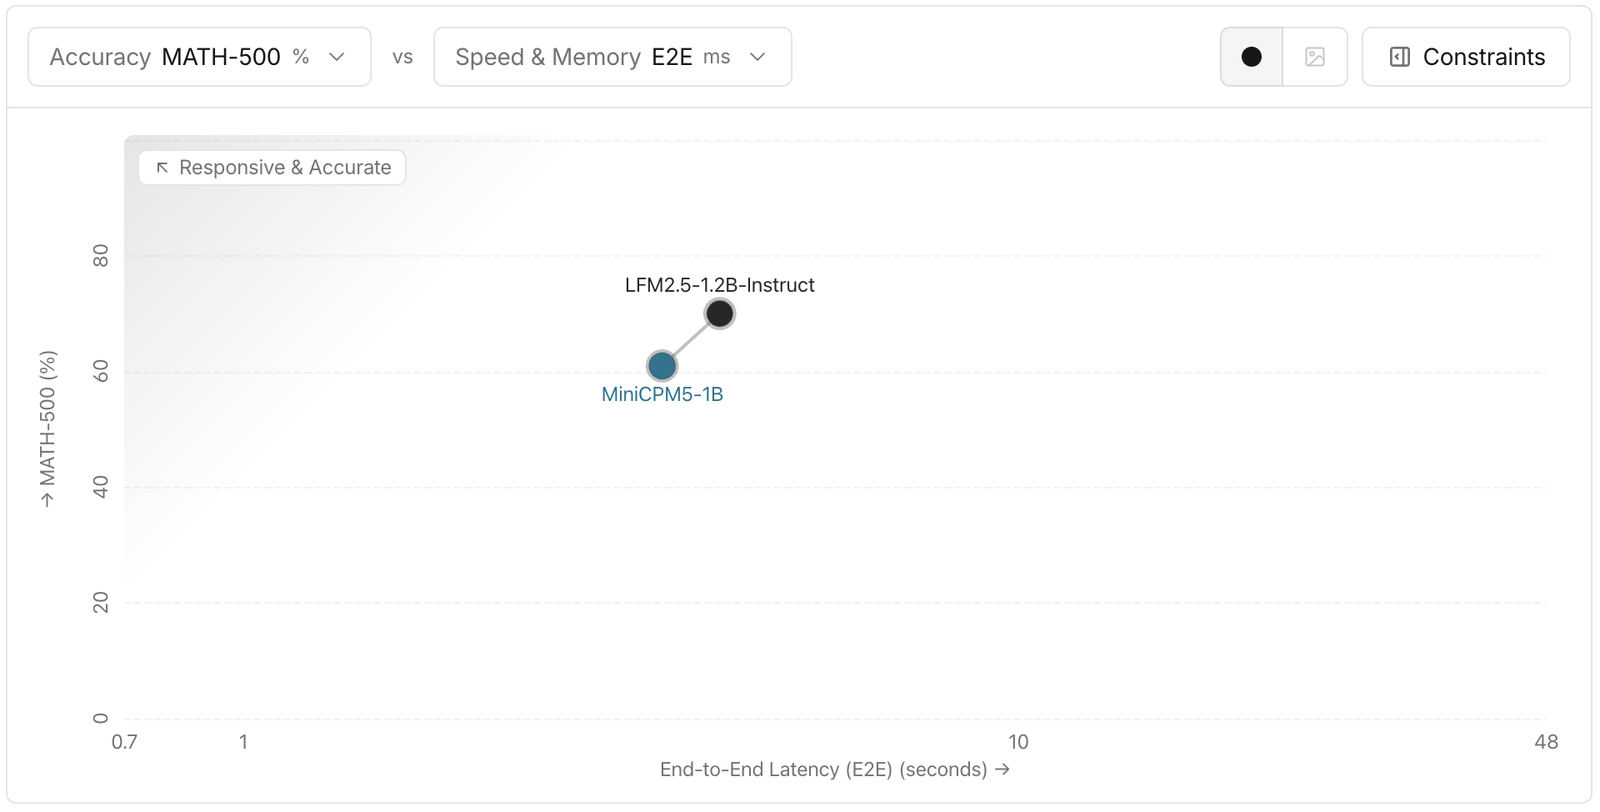
Liquid publishes that one about their own model losing an axis, which is the kind of thing worth noticing when deciding how much to trust a vendor-run benchmark.
How it is actually measured
The methodology is the part that determines whether any of the above means anything, and it is unusually well specified.
Performance. Fixed token shapes, greedy decoding, a discarded warm-up followed by five measured repetitions, and a platform-specific readiness check before each timed repetition that verifies acceptable thermal and load conditions. Results are published only for runs that pass. Power and cooling conditions for phones are documented separately. Anyone who has benchmarked a phone knows why every clause of that sentence is there: an unthrottled first run and a throttled fifth are different machines, and most published mobile numbers are quietly the first one.
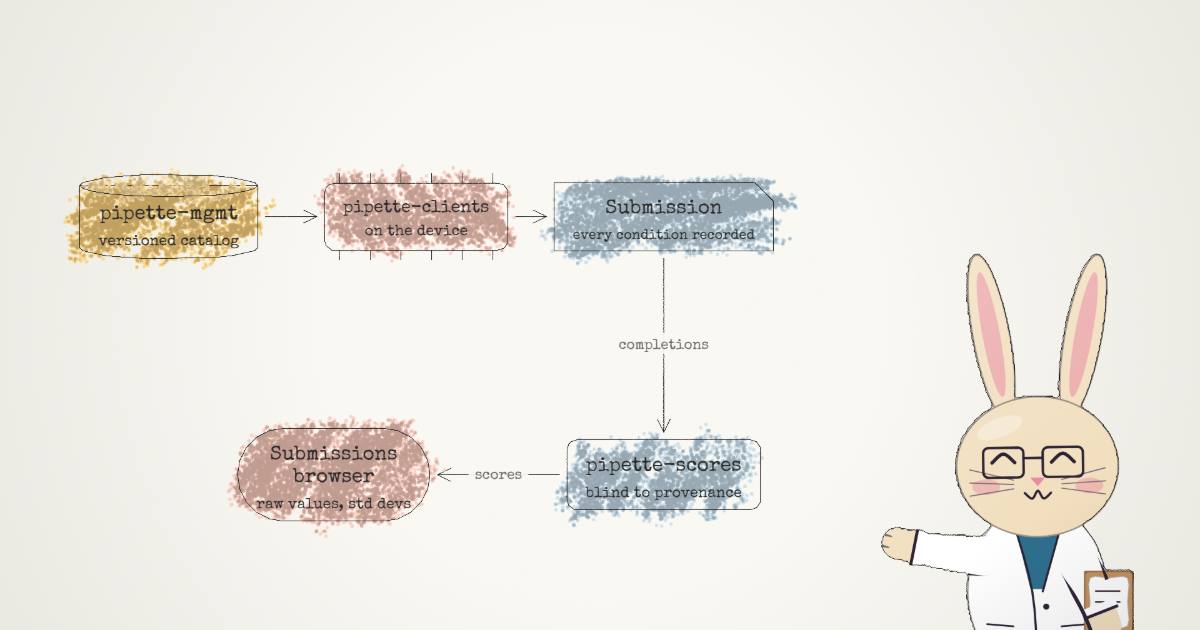
Quality. A separate protocol — standard datasets, completions generated through a reference runner, then deterministic, model-blind scoring. That phrase is load-bearing and the architecture backs it: pipette-scores provides the prompts and scores the completions without access to their generation provenance. It does not know which model produced what. For a benchmark published by a company that makes models, building the scorer so it structurally cannot favour them is the right move, and a rarer one than it should be.
Traceability. Every submission records the benchmark and token shape, model artifact and quantization, runtime version and settings, device hardware and operating system. The submissions browser exposes the raw records including measured values and standard deviations. Which means the claims above are checkable rather than merely stated — you can go find the record.
The three components are separate services, all Apache 2.0: pipette-mgmt serves the versioned benchmark catalog and ingests submissions, pipette-clients runs benchmarks on target devices, pipette-scores scores blind. There are native iOS and Android apps to run it on hardware you own; community submission is in beta.
What Liquid says it cannot do
This section exists in the announcement, is specific, and is the reason to take the rest seriously.
No NPU results. NPU support depends on model-specific kernel and operator coverage, and in this release no NPU path covers enough of the model set for consistent comparison — so rather than publish partial NPU numbers, they published none. This is the biggest hole in the dataset, and the honest framing of it is worth more than a filled-in table would be. The dedicated silicon is the whole promise of on-device inference and it remains unmeasured here.
Android is CPU-only. No stable GPU backend tested on Android consistently beat the selected CPU path across the full model set, so the Android path is CPU while iOS uses Metal.
Do not compare across devices. Stated flatly: Android and iOS runs differ in flash-attention support, thread counts, accelerator use, and execution environment. Results are reliable within a device, not across. That rules out the single most clickable thing you could do with this dataset, and they ruled it out themselves.
The quality suite is narrow. IFBench, GPQA Diamond and MATH-500 cover instruction following, science reasoning and competition maths — and explicitly not agentic behaviour, knowledge-intensive tasks, or multimodal work. For a suite aimed at on-device deployment, that is a real gap: the workloads people actually put on a phone lean toward the missing categories.
One thing not on their list that I would add: no energy or battery measurement. Peak RAM is there, thermal readiness gating is there, but joules per token is absent — and on a battery-powered device that is arguably the metric. A model that decodes 15% faster while drawing 40% more power is not the better deployment, and nothing in the current dataset can tell you that happened.
What to actually do with it
Three uses, in descending order of how much they change a decision.
Check context scaling before you check anything else. If your workload has real input length — and it does — the 256-token number is close to meaningless. The Granite pair is a 4× swing hiding behind identical spec sheets, and hybrid architectures are the reason. This is the highest-value column in the dataset and the one no other source publishes.
Read speed and memory as separate budgets. Sparse models let you buy decode throughput without buying the RAM back. Whether that trade is available to you depends on a ceiling only you know, which is exactly why the dashboard asks rather than ranks.
Compare quality on the artifact you will ship. Evaluating the BF16 model and deploying the Q4_K_M one is standard practice and it is a category error. Pipette runs the quality evals on the same quantized files whose speed it measures, and pairs them with full-precision references where available — which is the only way to see what a quantization actually cost you.
The ledger
Genuinely useful. A thousand-plus configurations with published methodology, thermal gating, five repetitions, and blind scoring — the first on-device dataset I would cite without caveating it. Quality evaluated on the deployed artifact rather than the reference weights. Full traceability down to the raw submission. Open-source clients and apps so you can reproduce it on your own hardware. And a genuinely load-bearing set of stated limitations.
Not covered. NPUs entirely. Android GPU. Cross-device comparison, by their own instruction. Energy. Agentic, knowledge-intensive and multimodal quality. Runtimes other than llama.cpp — no MLX, no ExecuTorch, no ONNX Runtime, no vendor SDKs, which means "runtime" is currently the least-varied of the five axes despite being one where the spread is large.
Worth watching. It is a vendor benchmark. Liquid makes the LFM models that appear throughout it, and the model list is theirs to choose. The structural defences are real — blind scoring that cannot see provenance, a third-party methodology review, published protocols, and at least one headline finding where their own model loses an axis — and they are the right defences. But the thing that would settle it is community-submitted results from people with no stake, and that workflow is in beta.
The framing I keep coming back to is Liquid's own: on-device behaviour is a property of the deployed system, not of the model in isolation. Everyone in the field already knows that and almost nobody has been able to act on it, because the measurements did not exist. Now about a thousand of them do, with their conditions attached — and the most valuable thing in the whole release might be that when you ask it which model is fastest, it asks you five questions back.