2026-09-18 · 22 min · edge-inference · mixture-of-experts · quantization · inference-optimization · model-architecture · explainer
On 8 September 2026 a team at AutoArk pushed two checkpoints and an inference framework to Hugging Face under Apache-2.0, and on the 16th the paper behind them landed as arXiv:2609.18063 — The Other Half of the Memory Wall: Serving 35B MoEs from SSD with Trained Routing Prediction, by Yu Lin, Yiming Wang, Runyuan Cai, Hanze Liu and Xiaodong Zeng. The pitch is one sentence: a 35B sparse MoE that decodes at interactive speed while holding under 3 GiB of memory, because the expert weights never enter RAM at all.
That is the kind of claim this site exists to check, because it is checkable. A quantized checkpoint is a file. Its tensor shapes are in a header. Whether the thing that ships matches the thing the announcement describes is not a matter of opinion.
So I cloned Edge0-AI/Edge0, read every safetensors header in both model repos
by HTTP range request, and rebuilt the memory budget from the bytes. The core
claim holds up better than most: the memory arithmetic is honest, the mechanism
is real, and the paper is noticeably more careful than the README that links to
it. The problem is the release publishes four sets of numbers — a README, a
model card, a paper, and constants pinned in the source — and they do not agree
with each other.
- architecture
- Qwen3_5MoeForConditionalGeneration
- task
- text-generation
- library
- mlx
- license
- apache-2.0
- safetensors
- 6 shards
- largest file
- 5.37 GB
- files
- 20
- downloads
- 52.5K
- likes
- 3.4K
repo last modified 2026-09-17
The Hub's own accounting for that repo — 34.66B parameters, 19.73 GB of storage — is the first hint, and it agrees to the byte with what I get by walking the tensor headers myself: 34,660,610,688 parameters, 19,738,195,814 bytes in the repository. Hold that against the "~23 GB" the README asks you to budget for.
The mechanism, and why it needs a predictor
A 35B MoE activates a few experts per token, which shrinks what you compute and
not one byte of what you store. Edge0's move is to stop storing it: expert
weights stay on SSD as per-layer stacked int4 safetensors, get mmap-ed, and
fault in on demand. Peak memory becomes a function of the active set.
On its own that is too slow to use, for a structural reason. At decode step t, layer N+1's expert selection depends on layer N's output — which does not exist yet. So the read cannot start until the router has run, and the engine stalls on disk latency once per layer per token. Forty layers, forty stalls.
Edge0's answer is a trained prerouter: a small per-layer head that predicts layer N+1's routing from layer N's state at the previous token, so the reads issue early and overlap compute. The part that matters, and that distinguishes this from ordinary pre-gating, is that the prediction is then consumed as the routing — the staged expert set and the routed set are identical by construction, so nothing is dropped and no fallback load is needed. The approximation is paid once, in training, by a recovery LoRA distilled from the fp16 teacher under the student's routing path.
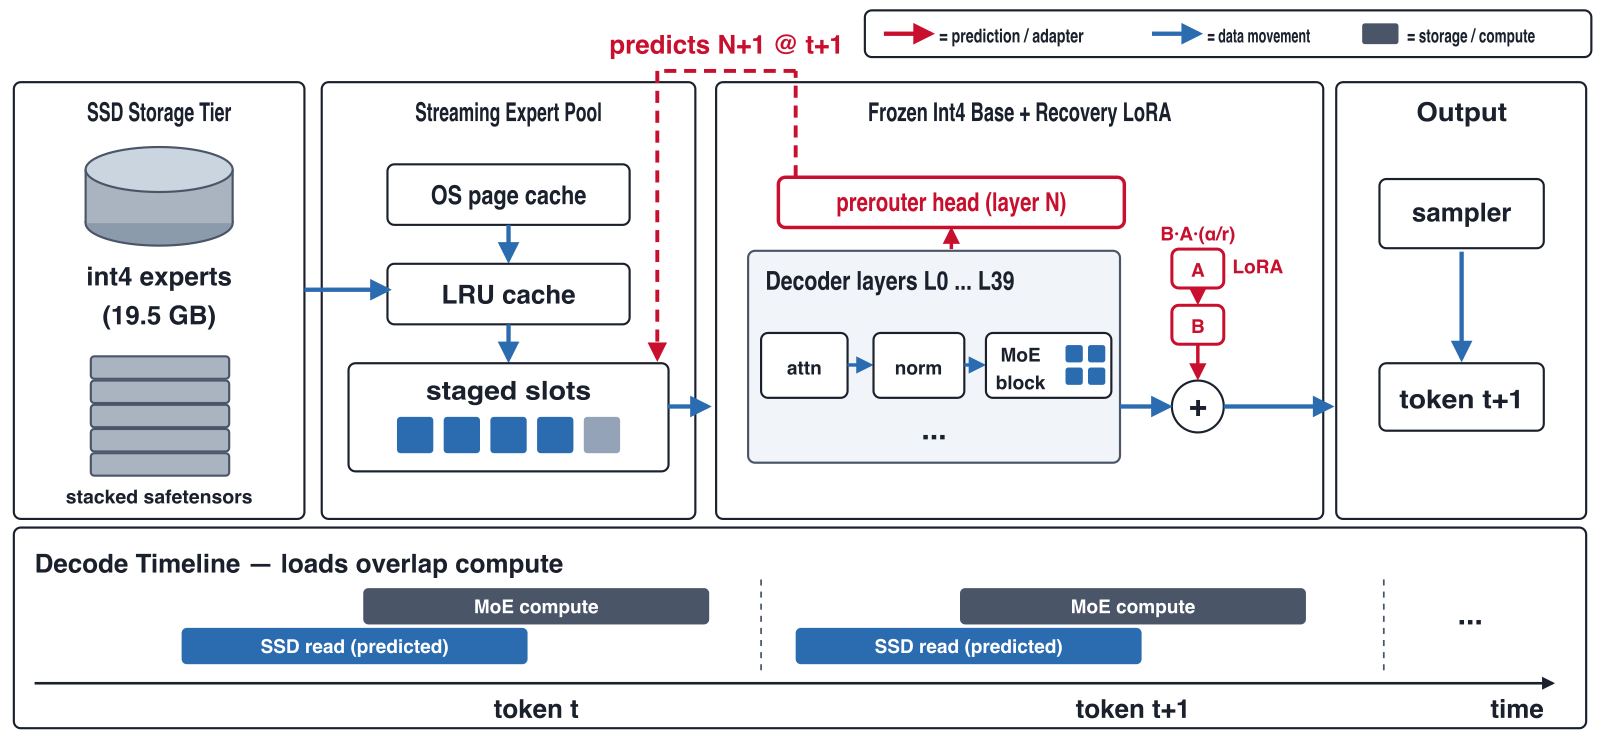
The head itself is three linear layers, and its input is the tell:
# src/edge0/prerouter/heads.py
class PrerouterHead(nn.Module):
    def __init__(self, hidden, num_experts, prerouter_hidden, dtype=core.float16):
        f_in = hidden + 2 * num_experts
        self.fc1 = nn.Linear(f_in, prerouter_hidden, bias=False)
        self.fc2 = nn.Linear(prerouter_hidden, num_experts, bias=False)
        self.linear_init = nn.Linear(f_in, num_experts, bias=False)

    def __call__(self, h, executed_oh, prev_oh):
        feats = core.concatenate([h, executed_oh, prev_oh], axis=-1)
        return self.linear_init(feats) + self.fc2(gelu_erf(self.fc1(feats)))
f_in = hidden + 2 * num_experts — the hidden state, plus one-hot masks of
this token's executed experts and the previous token's. It is a Markov
predictor over routing history, not a re-derivation of the router. For the 35B
tier that is 2048 + 2 × 256 = 2560, and the shipped
prerouter_edge0_35b.safetensors has fc1.weight at exactly [512, 2560]. For
the 8B tier, 1536 + 2 × 128 = 1792, and its fc1.weight is [512, 1792]. The
code and the weights agree.
Counting the bytes without downloading 20 GB
You do not need the weights to audit a checkpoint. A safetensors file starts
with a little-endian u64 header length, then that many bytes of JSON naming
every tensor's dtype and shape. Two range requests per file gets you the whole
inventory:
import json, struct, subprocess

def curl(url, rng):
    return subprocess.run(["curl", "-sSL", "-r", rng, url], capture_output=True).stdout

def header(url):
    n = struct.unpack("<Q", curl(url, "0-7"))[0]
    return json.loads(curl(url, f"8-{8 + n - 1}"))
For an MLX affine-quantized tensor the packed weight is u32, so the logical
width has to be recovered from the .scales group count — in = scales.shape[-1] × group_size — and then checked against the packed width, in × bits / 32. All
512 quantized tensors in the 35B checkpoint pass that assertion, which is itself
a useful result: the quantization block in config.json describes the file
that actually shipped, including the 80 router gates it promotes to 8-bit.
That gives 1,757 tensors across four shards, resolved from about a megabyte of headers:
Edge0's README says the edge0-35b checkpoint is "~23 GB". It is not. Every tensor in Edge0/Edge0-35B-A3B-preview, read out of the four safetensors JSON headers by HTTP range request, totals 19,508,787,456 bytes — 19.51 GB, or 18.17 GiB. The paper says 19.5 GB and its own Figure 1 prints "int4 experts (19.5 GB)", so the README is the one number out of step with both the artifact and the paper. The same headers give the parameter count (34,660,610,688) and the memory floor: 1,389,394,176 bytes of non-expert weights that have to be resident no matter how aggressively the experts stream.
| component | parameters | bytes on disk | MiB | resident at decode? |
|---|---|---|---|---|
| routed experts (40 layers x 256) | 32,212,254,720 | 18,119,393,280 | 17280.00 | no — streamed from SSD |
| attention (40 layers, 30 linear + 10 full) | 1,284,188,800 | 723,784,960 | 690.26 | yes |
| lm_head (untied) | 508,559,360 | 286,064,640 | 272.81 | yes |
| embed_tokens | 508,559,360 | 286,064,640 | 272.81 | yes |
| shared expert (40 layers) | 125,911,040 | 70,865,920 | 67.58 | yes |
| router gates (40 layers, 8-bit) | 20,971,520 | 22,282,240 | 21.25 | yes |
| norms (bf16) | 165,888 | 331,776 | 0.32 | yes |
| = base checkpoint total | 34,660,610,688 | 19,508,787,456 | 18605.03 | — |
| prerouter heads (33 x 2,097,152, fp16) | 69,206,016 | 138,412,032 | 132.00 | yes |
| recovery LoRA (r=16, alpha=32, fp16) | 21,166,080 | 42,332,160 | 40.37 | yes |
| = non-expert resident floor | 2,538,728,064 | 1,570,138,368 | 1497.40 | yes |
| + one K=4 decode step of experts (4 x 40 x 1,769,472 B) | 503,316,480 | 283,115,520 | 270.00 | transient |
| = floor with every layer's K=4 set held at once | 3,042,044,544 | 1,853,253,888 | 1767.40 | — |
Bytes are on-disk safetensors bytes, so a 4-bit affine group-64 tensor costs params/2 for the packed weights plus params/16 for the bf16 scales and biases (0.5625 bytes/param); the 8-bit router gates cost 1.0625. "Parameters" is the unpacked logical count. The vision tower that config.json declares (Qwen3_5MoeForConditionalGeneration, vision_config.depth 27, image_token_id, video_token_id) contributes zero of these bytes: all 1,757 tensors sit under the language_model. prefix and not one visual.* tensor ships. The config's mtp_num_hidden_layers: 1 likewise has no tensors behind it.
Edge0/Edge0-35B-A3B-preview · config.json says num_experts_per_tok: 8 · edge0 ships top_k=4 · 1.69 MiB per expert, 40 MoE layers
iPhone 16 Pro demo video2.9 GiB
README + paper, M4 Pro3.32 GiB
peak_active_mem_mb=3400
- fixed floor
- 1.29 GiB
- non-expert weights
- + adapters
- 1.46 GiB
- prerouter + LoRA
- + experts K=4
- 1.73 GiB
- every layer's set at once
- expert share
- 15.28%
- of the measured total
Only the right-hand segment moves with K. The 35B tier’s floor is 1.46 GiB of weights that have to be resident for the whole forward pass before a single expert is read, and 172 MiB of that is the two adapter files the pipeline needs to work at all — the prerouter alone is 132 MiB, about 4.4% of the 2.9 GiB budget it is there to defend. Hold every layer’s K=4 set simultaneously and you get 1.73 GiB; hold only the four-layer staged window, 1.49. The iPhone demo’s 1.7 GiB peak sits inside that window. The Mac mini’s 2.9 GiB is the same floor plus about 1.2 GiB of expert cache, KV and allocator slack. The 8B tier is the same shape one order down: a 0.61 GiB floor, 0.84 GiB with every layer’s K=8 set held at once, against published peaks of 1.0, 1.37, 1.4 and 1.5 GiB.
Read the widget and the claim resolves cleanly in Edge0's favour. "Peak memory
is bounded by the active set, not the parameter count" is true — 92.9% of the
parameters and 92.9% of the bytes are routed experts, and those genuinely never
need to be resident. But the floor underneath is fixed: 1.29 GiB of attention,
embeddings, the untied lm_head, the shared expert and the router gates, plus
172 MiB of adapters, equals 1.46 GiB before a single expert is read. Add one
decode step of experts at K=4 across all forty layers and you get 1.73 GiB; add
only the four-layer staged window the config actually keeps (hot_window=4) and
you get 1.49 GiB.
Which is a satisfying place to land, because Edge0's own iPhone demo prints 1.7 GiB / 1.8 GB as its session peak. My floor, computed from tensor headers alone with no access to the running process, brackets the number their phone reports. The Mac mini's 2.9 GiB is the same floor plus roughly 1.2 GiB of expert cache, KV growth and MLX allocator slack.
One measurement worth singling out: the 8B tier's per-expert cost comes out of
my headers at 1,327,104 bytes, or 1.2656 MiB. The framework's own source says
"every cached bundle is 1.27 MiB of RAM" in the prod_k8 docstring in
src/edge0/streaming/options.py. Independent derivation, same number. That is
what a codebase looks like when someone actually measured it.
The one number that is simply wrong
The README says the 4-bit checkpoints are "~23 GB (edge0-35b) and ~4.2 GB
(edge0-8b)".
The 8B figure is fine if you read it as GiB: measured 4,508,697,328 bytes, which is 4.51 GB or 4.20 GiB.
The 35B figure is not fine in either unit. The four weight shards total
19,508,787,456 bytes — 19.51 GB, 18.17 GiB — confirmed twice, once from the
Hub API's blob sizes and once from Content-Length on each file after the CDN
redirect. The entire repository, adapters and tokenizer and a 20 MB demo video
included, is 19,738,195,814 bytes. There is no reading of "~23 GB" that gets
within 3.4 GB of the artifact.
The interesting part is who gets it right. The paper's abstract opens with "a
35B-class model is 19.5 GB at 4-bit". The paper's Figure 1 prints int4 experts (19.5 GB) on the storage tier. The framework's own staged_k4 docstring says
"19.7 GB checkpoint", which is the whole-directory figure. Three sources, all
correct, all in the same release. The README is the only place the number is
inflated, and it is the first thing anyone reads.
"A3B" describes a model that isn't the one serving
The repo is called Edge0-35B-A3B-preview. A3B means roughly three billion
active parameters per token, inherited from the Qwen3.6-35B-A3B base.
The base's own config.json — shipped inside the Edge0 checkpoint, unmodified —
says num_experts_per_tok: 8. Edge0 does not serve it that way:
# src/edge0/models/edge0_35b/__init__.py
moe_spec=MoESpec(
    num_experts=256, top_k=4, intermediate_size=512,
    router=RouterKind.SOFTMAX_TOPK, norm_topk_prob=True,
    shared_experts=1,
    quant=QuantSpec(bits=4, group_size=64, mode="affine"),
    ...
),
options=LayerOptions.staged_k4(),
prerouter_top_k=4,
Half the native routed width. From the tensor shapes, the active set is
2,443,115,136 parameters at K=4 against 2,946,431,616 at K=8 — the "3B"
only appears at a width the release does not run. It is an inherited name rather
than a fresh claim, and the model card is honest about it further down the page
(Experts / active per token — 256 / 4 (K=4)), but the paper's own Table 1 puts
Active params / token ≈3B and Routing width K — 4 in the same column, and
those two cells are 0.5B apart.
For contrast, the 8B tier's A1B checks out: measured 1,170,908,064 active
at its native K=8. It only reaches 1.2B because tie_word_embeddings is false
and the 241,434,624-parameter lm_head really is a separate tensor in the file
— had the embeddings been tied, the honest number would have been 0.93B. I
checked, because assuming a tied embedding is exactly how active-parameter
counts go wrong.
The second-order consequence matters more than the naming. Running at K=4 halves the routed compute, and the quality table compares that against an fp16 base running at K=8. More on which direction that cuts below.
Five decode rates, one machine
edge0-35b
edge0-8b
Five figures for the 35B tier spanning 13.0 to 20.4 tok/s, a 57% spread, and two of them — 14.9–17.7 and 20.4 — name the same Mac mini M4 Pro, 24 GB. The 8B tier is the same shape: the README and the framework’s own docstring agree at ~25 tok/s, the paper says 28.0, and the acceptance constant the CLI prints when you run edge0 models says 33.0. None of the four sources says which of the others it supersedes.
Edge0 publishes five different decode rates and four different peak-memory figures for the same 35B tier, and two of the decode figures claim the same machine. Nothing in the release says which supersedes which. The spread on decode is 13.0 to 20.4 tok/s — 57% — and the README's headline prerouter gain ("up to +59%") appears nowhere in the paper it links to.
| quantity | published value | machine | where it is published |
|---|---|---|---|
| edge0-35b decode | 13.0 tok/s | unstated | src/edge0/models/edge0_35b/__init__.py — target_tok_s=13.0 |
| edge0-35b decode | 14.9–17.7 tok/s | Mac mini M4 Pro, 24 GB | README.md Benchmark table; HF card Performance table |
| edge0-35b decode | 15 tok/s | unstated | HF card headline + "Fast enough for interactive use" |
| edge0-35b decode | ~16 tok/s | iPhone 16 Pro, 8 GB | 20260910-105854.mp4 overlay, 0:12 (HF repo) |
| edge0-35b decode | 20.4 tok/s | Mac mini M4 Pro, 24 GB | arXiv 2609.18063v2 Table 1; abstract says "≈20 tok/s" |
| edge0-35b peak memory | 1.7 GiB / 1.8 GB | iPhone 16 Pro, 8 GB | 20260910-105854.mp4 overlay + caption |
| edge0-35b peak memory | 2.9 GiB | Mac mini M4 Pro, 24 GB | README.md; HF card; arXiv Table 1 — all agree |
| edge0-35b peak memory | 3400 MB (3.32 GiB) | unstated | src/edge0/models/edge0_35b/__init__.py — peak_active_mem_mb=3400.0 |
| edge0-8b decode | 23.9–25.3 tok/s | Mac mini M4 Pro, 24 GB | README.md Benchmark table; HF card |
| edge0-8b decode | 25.0 tok/s (40.02 ms/step) | Mac mini M4 Pro, 24 GB | src/edge0/streaming/options.py — prod_k8 docstring |
| edge0-8b decode | 28.0 tok/s | Mac mini M4 Pro, 24 GB | arXiv 2609.18063v2 Table 1 |
| edge0-8b decode | 33.0 tok/s | unstated | src/edge0/models/edge0_8b/__init__.py — target_tok_s=33.0 |
| edge0-8b peak memory | 1.0 GiB | Mac mini M4 Pro, 24 GB | README.md; HF card headline "1 GiB active memory" |
| edge0-8b peak memory | 1.4 GiB | Mac mini M4 Pro, 24 GB | src/edge0/streaming/options.py — prod_k8 docstring |
| edge0-8b peak memory | 1400 MB (1.37 GiB) | unstated | src/edge0/models/edge0_8b/__init__.py — peak_active_mem_mb=1400.0 |
| edge0-8b peak memory | 1.5 GiB | Mac mini M4 Pro, 24 GB | arXiv 2609.18063v2 Table 1 |
| prerouter decode gain | +2.5% (19.9 → 20.4 tok/s) | Mac mini M4 Pro, 24 GB | arXiv 2609.18063v2, Table 1 caption |
| prerouter decode gain | ~5% | Mac mini M4 Pro (8B tier) | src/edge0/streaming/options.py — prod_k8 docstring |
| prerouter decode gain | up to +59% | unstated | README.md and HF card — not reproduced in the paper |
| prerouter decode gain | +80 / +82 / +84% (K=2/4/8) | MacBook M2, 16 GB (checkpoint does not fit) | arXiv 2609.18063v2 Table 3 and Figure 3a |
The 35B tier's routed width is the other thing worth reading twice. The checkpoint's own config.json sets num_experts_per_tok: 8; edge0 serves it with MoESpec(top_k=4). Measured from the tensor headers, the active set is 2,443,115,136 parameters at K=4 against 2,946,431,616 at K=8 — so the "A3B" in Edge0-35B-A3B-preview describes the base model's native width, not the one that ships. The 8B tier's "A1B" does check out: 1,170,908,064 active at its native K=8, and it only reaches 1.2B because tie_word_embeddings is false and the 241,434,624-parameter lm_head really is a separate tensor in the file.
Here is the thing I could not resolve. For edge0-35b, the release publishes:
| Source | Decode | Machine |
|---|---|---|
target_tok_s in models/edge0_35b/__init__.py | 13.0 tok/s | unstated |
| README + model-card Performance table | 14.9–17.7 tok/s | Mac mini M4 Pro, 24 GB |
| Model-card headline | 15 tok/s | unstated |
| Demo video overlay, 0:12 | ~16 tok/s | iPhone 16 Pro, 8 GB |
| arXiv Table 1 (and "≈20 tok/s" in the abstract) | 20.4 tok/s | Mac mini M4 Pro, 24 GB |
Rows 2 and 5 name the same machine and the same harness shape and differ by 15–37%. The paper's Table 1 caption describes a stricter protocol — "each arm in its own process, warm, arm order rotated, medians over 3 rounds" — against the README's "2 runs per tier", so the paper's number is plausibly the better one. Nothing anywhere says so. The two tables also disagree on the 8B tier's warm prefill (1428 against 1102 tok/s) and its peak memory (1.0 against 1.5 GiB), while agreeing exactly on the 35B tier's prefill and peak. That is not a version-drift pattern; it is two measurement campaigns published side by side.
The 8B memory figure is the one I would fix first. The README and the model card
say 1.0 GiB. The paper says 1.5 GiB. The framework's own prod_k8
docstring says peak goes "1.4 → 2.6 GiB" when you grow the LRU, i.e. 1.4 GiB as
shipped. And peak_active_mem_mb=1400.0 is pinned in the source as the
acceptance yardstick. Three of the four cluster at 1.4–1.5 GiB; the one in the
headline is 30% below them.
What the prerouter actually buys
The README and the model card both headline the prerouter as worth "up to +59% decode throughput". I went looking for that number and could not find it.
It is not in the paper. The paper's contributions list says "+80 to +84%
decode". Table 3 and Figure 3a give +80%, +82% and +84% for K=2, 4 and 8. The
appendix prices a different A/B at +34%, and another at 6.8 → 12.5 tok/s, and
explicitly warns those "are not comparable with Table 3". None of them is 59%,
and neither 59 nor any near neighbour appears anywhere in the PDF, the docs,
or the source. It appears in exactly two files: README.md and README_zh.md.
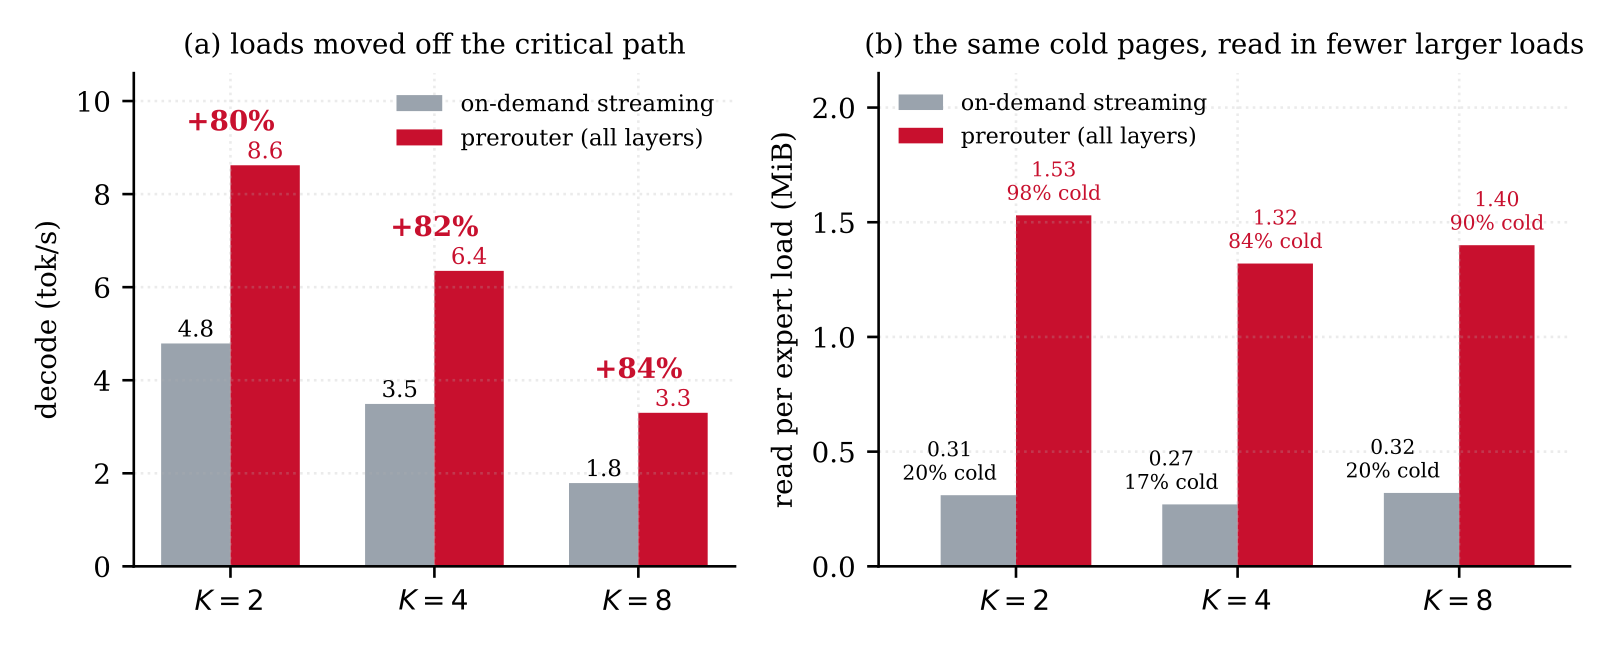
Look at the left axis before the percentages. The machine in Figure 3 decodes at 1.8 to 8.6 tok/s — this is a 16 GB MacBook M2 with an 18.4 GiB checkpoint, a configuration in which the model cannot fit and every step faults from disk. That is the honest setting for the mechanism and the paper says so plainly. It is also not the machine anyone is quoting when they say Edge0 does 15 tok/s.
On the machine the README does benchmark, the same paper gives the A/B in one line of Table 1's caption: "Disabling the prerouter on the 35B tier measures 19.9 tok/s." Against 20.4. That is +2.5%. The 8B tier's own source docstring says the prerouter "routes ~5% faster than gate routing with the same loading path" on the M4 Pro.
solid = step wall time (1000 / tok/s) · hatched = time the main thread spent blocked on expert loads, summed over layers. At K=8 the on-demand sum (575.0 ms) exceeds the step it belongs to (559.1 ms) because different layers’ loads overlap — the bar clamps it to the step.
| arm | loads/step | MiB/step | MiB/load | cold | ms/load |
|---|---|---|---|---|---|
| on-demand streaming | 189.4 | 50.9 | 0.27 | 17% | 1.29 |
| prerouter (all layers) | 44.7 | 58.9 | 1.32 | 84% | 2.28 |
machine that cannot hold the model
+82% at K=4
3.5 → 6.4 tok/s. MacBook M2, 16 GB, no artificial memory limit.
machine in the README’s benchmark table
+2.5%
19.9 → 20.4 tok/s, Mac mini M4 Pro 24 GB, from the paper’s own Table 1 caption. The 8B tier’s code docstring says ~5% on the same box.
The two arms read within a few percent of the same bytes at K=2 and K=8 — 29.5 against 30.4, and 125.1 against 126.9 MiB per step. At K=4, the width that actually ships, the prerouter arm reads 16% more (58.9 against 50.9 MiB). So nothing is saved. What changes is when the bytes are read: 44.7 loads a step of 1.32 MiB each instead of 189.4 loads of 0.27 MiB, at 84% cold instead of 17%. Moving a read off the critical path can hide it; it cannot delete it. Which is exactly why the gain collapses to +2.5% on a box with enough RAM to keep the pages warm — there is no exposed cold-read time left to hide.
So the honest characterisation is: the prerouter is not a speedup, it is a swap-avoidance device, and it pays in proportion to how badly the machine cannot hold the model. Table 4 makes that mechanical rather than rhetorical. Both arms move within a few percent of the same bytes per step at K=2 and K=8; at K=4, the width that actually ships, the prerouter arm reads 16% more (58.9 against 50.9 MiB). Nothing is saved. What changes is that 189 small warm reads become 45 large cold ones, which is a better shape for an SSD and, more importantly, happens off the critical path. When the page cache can hold the working set there is no exposed cold-read time to hide, and the gain goes to zero.
That framing also puts a price on the mechanism. The prerouter costs 138,412,032 bytes of always-resident fp16 — 69,206,016 parameters, 33 heads of exactly 2,097,152 parameters (4 MiB of fp16) each — which is 4.4% of the 2.9 GiB budget it exists to defend, for +2.5% on the flagship machine. That is still a good trade, because the 2.9 GiB budget is the product and the +80% is what makes a 16 GB laptop viable at all. It is just not the trade "up to +59% decode throughput" describes.
The iPhone
The announcement thread said "a 35B language model running on an iPhone using
only 1–2.5 GB of peak memory". The repo's Requirements section says the MLX
backend "runs on macOS with Apple Silicon (M1/M2/M3/M4)". pyproject.toml pins
mlx-metal; platform_system == 'Darwin'. There is no iOS target, no Swift, no
.xcodeproj, and every measurement in the paper is a Mac mini M4 Pro or a
MacBook M2. The model card's own phrasing is the careful one: "phone-class
memory", meaning an amount of memory a phone has.
I expected that to be the end of it. It isn't — the evidence is sitting in the model repo, as an 89-second screen recording nobody links from the README:
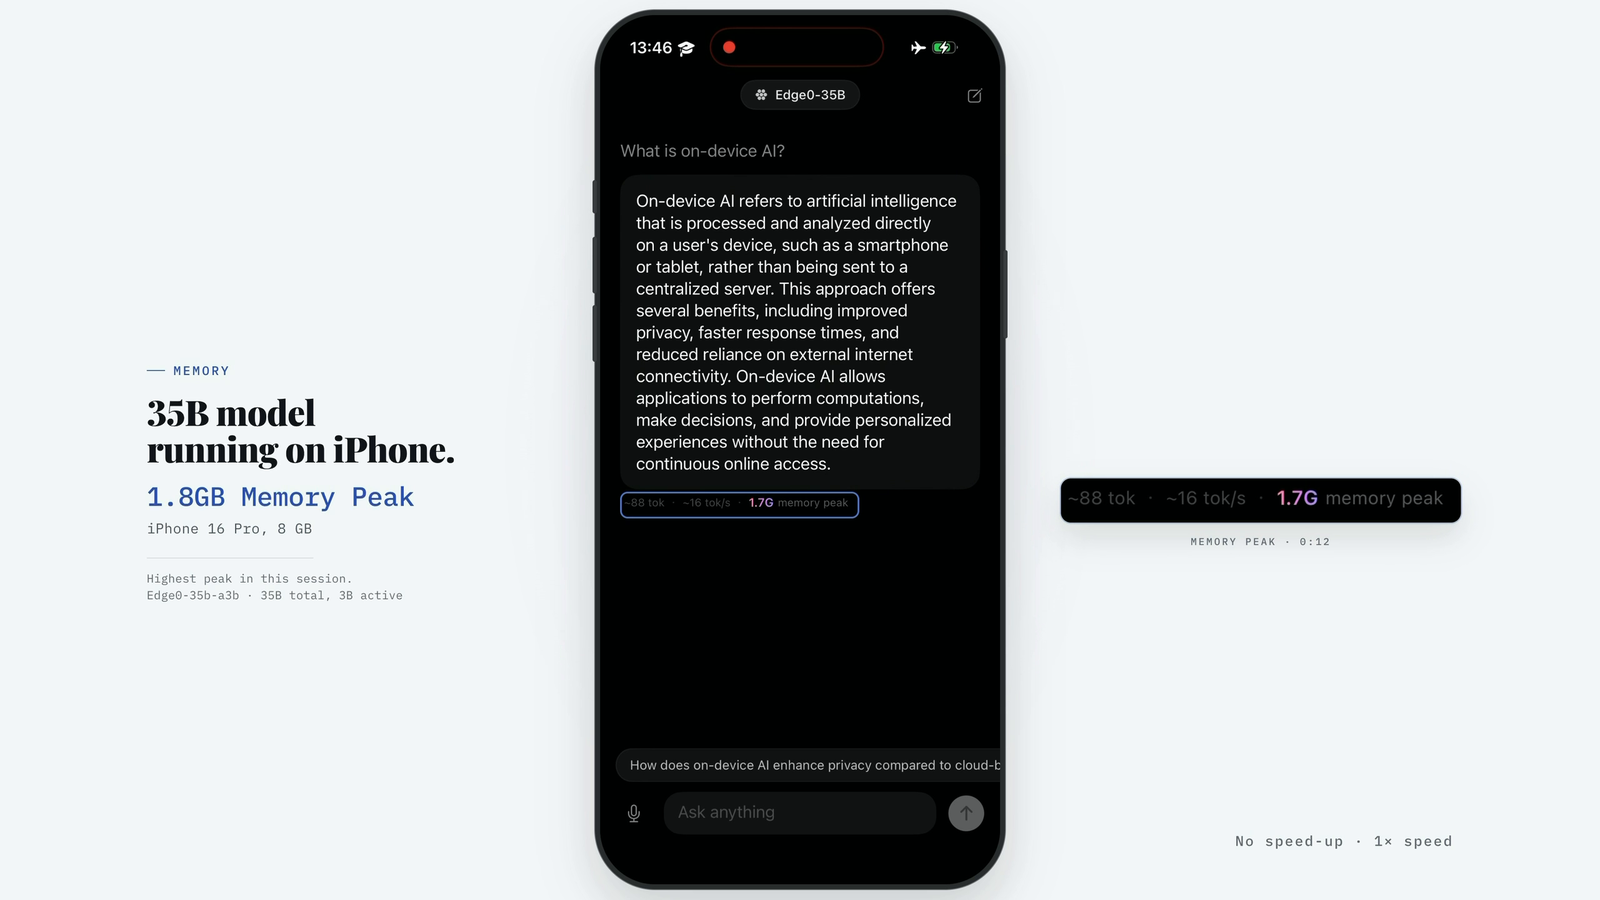
So the iPhone claim is substantiated, by the vendor's own recording, at 1× speed with the no-speed-up label volunteered rather than extracted. ~16 tok/s and 1.7 GiB on an iPhone 16 Pro — and 1.7 GiB is, to within a couple of percent, the floor I derived from the tensor headers. That is the best result in this piece: two completely independent methods, one a byte count and one a running phone, landing on the same number.
What remains unsupported is narrower. There is no per-device table: one phone,
one session, ~88 tokens, no seed, no prompt disclosed, no second run. "1–2.5 GB"
matches neither endpoint of anything published — the 8B is 1.0 GiB, the 35B on
the phone is 1.7, on the Mac mini 2.9. And the one A18-class data point the
repository does contain is a bug report: issue #8, garbled mixed-language output
on Apple A18 / A18 Pro, traced in pyproject.toml to MLX ≤ 0.30.4 mis-gating
the NAX matmul kernels — "silently wrong numbers", fixed upstream in 0.30.5,
which is why the dependency is pinned to an exact version. Nothing about the
phone path is loose, but one recording is one recording.
The quality table cuts the right way
| Benchmark    | edge0-35b (int4) | Qwen3.6-35B-A3B (fp16) | edge0-8b (int4) | Ling 3.0 tiny (fp16) |
| AIME 2026    |             86.6 |                   92.7 |            63.3 |                 73.3 |
| HumanEval    |             90.9 |                   95.1 |            91.5 |                 92.7 |
| GPQA-Diamond |             79.8 |                   81.8 |            70.7 |                 71.2 |
| MMLU-Pro     |             81.0 |                   84.6 |            70.1 |                 65.8 |
| IFBench      |             57.9 |                   61.7 |            53.9 |                 60.6 |
| Average      |             79.2 |                   83.2 |            69.9 |                 72.7 |
The arithmetic checks: 396.2/5 = 79.24 and 415.9/5 = 83.18, a 3.94-point mean gap; 349.5/5 = 69.9 against 363.6/5 = 72.72, a 2.82-point gap. Both round as claimed.
This comparison is asymmetric — int4 plus a LoRA plus predicted routing at K=4, against fp16 with the native gate at K=8 — and it is worth saying which way that cuts. It favours the baseline. The fp16 arm gets more precision and twice the routed compute. So the 3.9 points is the cost of the entire deployment pipeline, not of quantization alone, which is the right thing to measure and the conservative direction to measure it in. I have no complaint about the table's construction.
I have two about its reporting. First, the 8B's "2.8 points on average" is the mean of a set spanning 14.3 points: −10.0 on AIME, −6.7 on IFBench, −1.2, −0.5, and +4.3 on MMLU-Pro. A distilled adapter beating its own teacher by 4.3 points on one benchmark while losing 10.0 on another is not a small residual drift, and "quality-matched" does a lot of work over that spread. The paper's Limitations section does say the loss concentrates in long-chain reasoning, and names both numbers. The README and the model card lead with the average.
Second, the denominator is never stated. There are no sample counts, no seeds,
no avg@k, no temperature — "OpenCompass on a compute server under identical
settings" is the whole protocol description. And the arithmetic gives the
denominator away: 63.3 and 73.3 are exactly 19/30 and 22/30, which is what you
get scoring the 30-problem AIME 2026 set (AIME I + II, fifteen each) once. If
that is right, the 8B tier's headline 10.0-point AIME gap is three problems,
and the 92.7 cell — which is not a multiple of 1/30 — was produced some other
way. Nothing about the conclusion is necessarily wrong. But a 10.0 and a 3 feel
very different, and only one of them is printed.
Things the config says that the checkpoint does not have
Small stuff, found by walking the tensor list, and none of it affects edge0
itself because edge0 never reads these paths. It will bite anything that loads
the directory the way the config describes it.
- A vision tower that isn't there. The 35B
config.jsondeclaresarchitectures: ["Qwen3_5MoeForConditionalGeneration"], a fullvision_config(depth 27, hidden 1152, patch 16),image_token_id,video_token_id,vision_start_token_id, and shipspreprocessor_config.jsonandprocessor_config.json. All 1,757 tensors across the four shards sit under thelanguage_model.prefix. There is not onevisual.*tensor in the release. The repo containsscripts/strip_vision_weights.py; the config was not stripped alongside the weights. - An MTP layer that isn't there. Same config sets
mtp_num_hidden_layers: 1. Zero MTP tensors ship. - Adapters labelled for a tier that doesn't exist. Both 8B adapter files
carry
"model": "edge0-10b"in their safetensors__metadata__, alongside a training-export path on an HPC node. The 35B pair correctly says"model": "edge0-35b", sourced from/Users/linyu/...— which is at least a tidy confirmation that the corresponding author packed them. - A docstring that disagrees with its own file. The module docstring in
src/edge0/models/edge0_8b/__init__.pysays "22 heads (explicit owners 1..22), start_layer 1". The code four lines below saysowners=tuple(range(7, 23)), which is 16. The shippedprerouter_edge0_8b.safetensorscontains 48 tensors, three per head: 16 heads. The docs directory and the__metadata__owners list both say 16 too. The docstring is the outlier.
What I take away
The engineering is good and the paper is careful. Same-session rotated A/B,
medians over repeated runs, an explicit statement that single-shot benchmarks on
this hardware carry ±40% run-to-run spread and up to 2.3× across sessions — and
then a refusal to use any cross-session number as evidence. A limitations
section that names the 10.0-point AIME gap. An appendix that says two of its own
measurements "are not comparable" with the main table. A demo video labelled
1× speed. This is a group that measures things.
The release around the paper is where it falls down, and in a specific way: the marketing surface is not a compression of the technical one, it is a fourth independent set of numbers. "~23 GB" where the artifact is 19.5. "Up to +59%" where the paper says +2.5% here and +84% there. 1.0 GiB where the source, the acceptance constant and the paper all say 1.4–1.5. Five decode rates for one tier. Every one of those is individually small. Together they mean a reader cannot cite Edge0 without first deciding which Edge0 to cite — and the fix costs nothing, because in every single case the correct number already exists inside the same repository.
If you want to use it: it is Apple Silicon only today, mlx==0.30.6 exactly
(0.30.4 is silently wrong on A18, 0.31.2 breaks the streaming pool's threads),
one request at a time, FIFO. edge0 serve edge0-35b gives you an
OpenAI-compatible endpoint backed by 19.5 GB of disk and about 3 GiB of RAM. On
that hardware, that is a thing nothing else does.
What would change my mind
5 claims above, and what would falsify each
The 35B checkpoint is 19.51 GB, not ~23 GB.
Show me a released revision of
Edge0/Edge0-35B-A3B-previewwhose weight shards sum to ~23 GB. The Hub keeps history; if an earlier commit was that size, the README is stale rather than wrong and I will say so. As of the version I measured, the four shards are 19,508,787,456 bytes and the whole repo is 19,738,195,814.The README's 'up to +59%' prerouter gain is unsourced.
A benchmark — in the repo, the paper, an issue, a blog post, anywhere — that produces 59% on some stated machine at some stated K. I searched the PDF, both READMEs, all eight docs pages and the full source tree. If it exists and I missed it, this claim is simply wrong, and the honest version becomes "the README quotes a number whose provenance is not linked".
On a machine that can hold the model, the prerouter is worth about +2.5%.
A paired A/B on an M4 Pro-class box showing a materially larger gap than 19.9 against 20.4 tok/s. I am taking the paper's own Table 1 caption at face value on hardware I do not own; I have not run this. A same-session sweep on any 24 GB Apple Silicon machine would settle it in an afternoon.
The memory floor is 1.46 GiB and the 2.9 GiB peak is honest.
An MLX allocator trace showing the resident set dipping meaningfully below 1.46 GiB during decode, which would mean some of what I counted as always-resident is itself being streamed or recomputed. My figure is derived from tensor headers, not from a running process, and it assumes the non-expert weights stay resident for the whole forward pass.
The 8B AIME gap of 10.0 points is three problems out of thirty.
An OpenCompass config for this run showing a different denominator or an
avg@kover multiple samples. 63.3 and 73.3 being exactly 19/30 and 22/30 is suggestive, not conclusive — and 92.7 is not a multiple of 1/30, so at least one cell in that row was scored differently.