Reflection Beam: a 501B open MoE that spends 23B per token, and what its efficiency chart measures
mdjsonmcp2026-10-06 · 18 min · llm · mixture-of-experts · reinforcement-learning · agentic-coding · open-weights · scaling · explainer
Reflection AI announced Beam on 5 October 2026, with a thread on X that opens: "a highly efficient agentic open model with 501B total parameters and 23B active." It is Reflection's first open-weight model. The pitch has three parts: it was trained end-to-end from scratch, it is "3-4x more efficient than GLM 5.2", and its RL run is "the largest publicly documented RL run we're aware of", 10.5k GB300s for four weeks.
The first thing to say is what is not there. As of today, 6 October, there are no weights. The Hugging Face
API returns an empty list for reflection-ai, ReflectionAI and every spelling I tried. The blog says the
weights, "technical report, model card, and developer artifacts" ship "later this month" under Apache 2.0,
with FP8 and NVFP4 quantizations; the model is "undergoing final red-teaming", and early access is a waitlist
at platform.reflection.ai. So this is a launch announcement with charts, not a release. Nothing below can be
checked against a config file or a safetensors header, because neither exists in public yet.
What can be checked is the internal arithmetic of the announcement, and it turns out there is a lot of it. The blog publishes enough axis labels, footnotes and hardware counts to rebuild its efficiency chart from first principles and to put the training run on a ledger.
Labels, as everywhere on this site. Reported is Reflection's figure, not re-run. Measured is something I computed from a file: here, pixel positions read off Reflection's own published charts. Reasoned is my arithmetic on the other two.
What is disclosed about the architecture
Not much in numbers, quite a lot in recipe. From the blog's "Stable and balanced MoE optimization" section (all reported):
- Sparse mixture-of-experts, 501B total, 23B active per token: 4.6% of the weights do each token's work (reasoned, 23 / 501). That ratio sits between GLM-5.2 (40B of 744B, 5.4%) and Kimi K3 (104B of 2.8T, 3.7%).
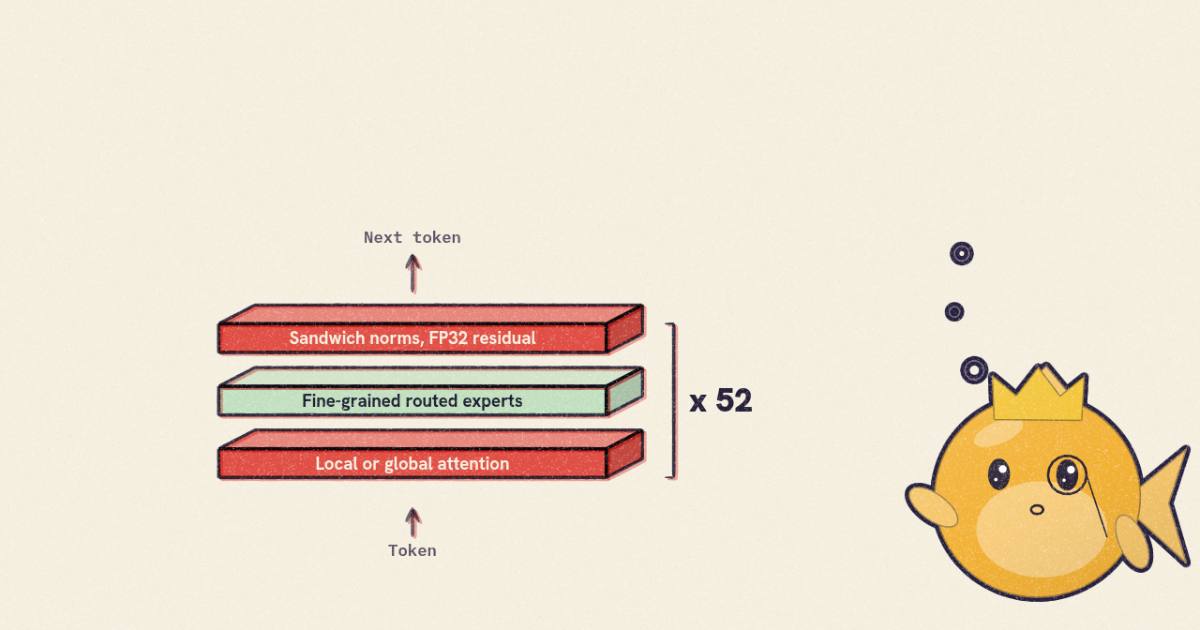
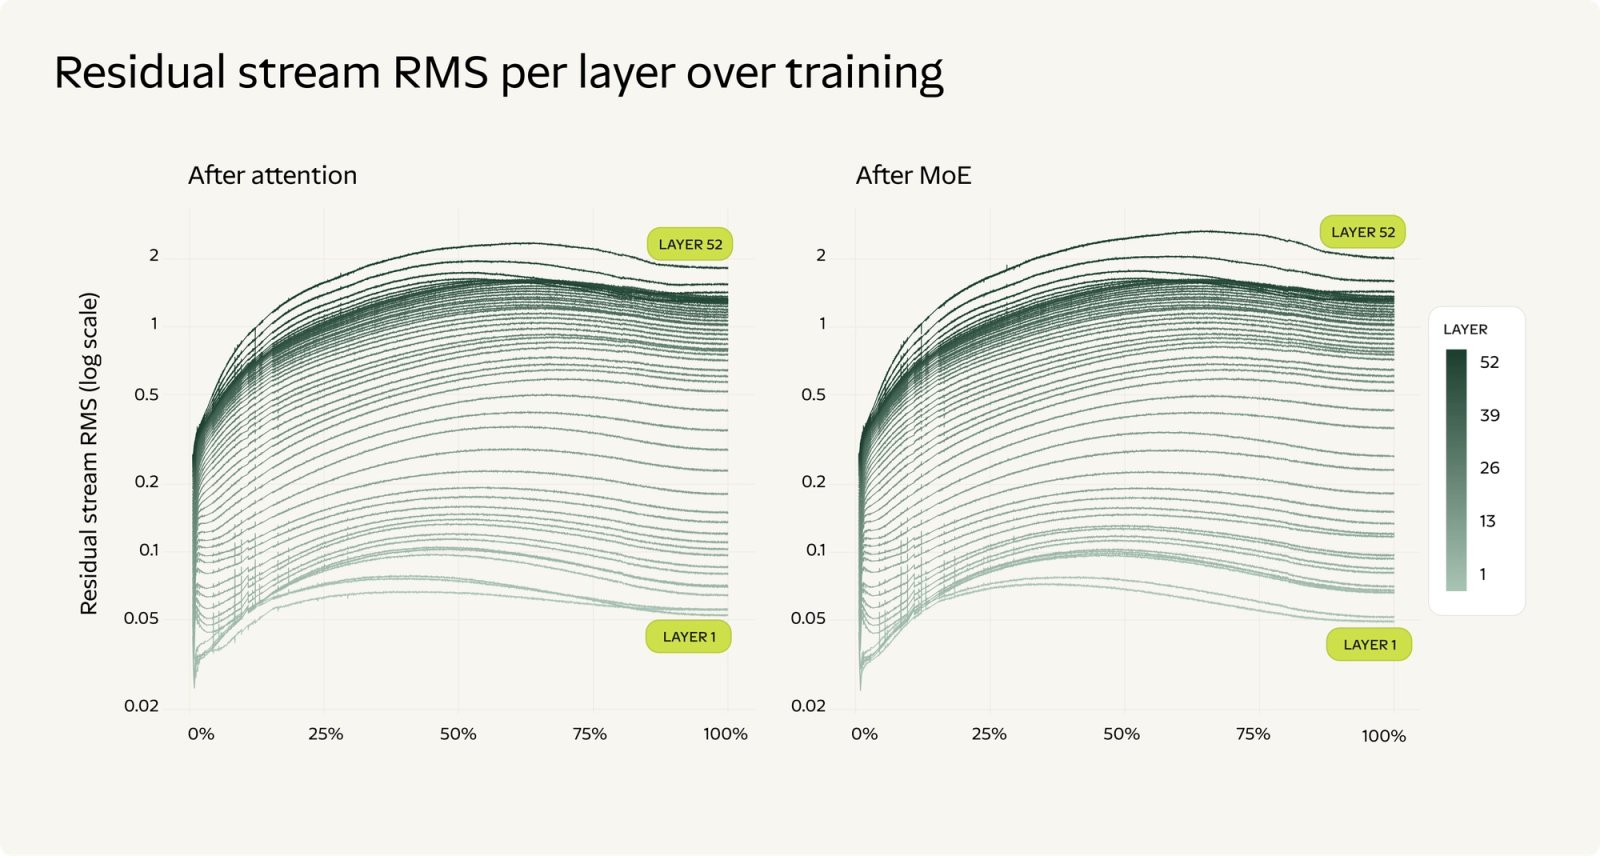
- 52 layers, named in the caption of the residual-stream figure further down.
- "Interleaved local and global attention": some layers see a sliding window, some see everything, the pattern Inkling uses at 5:1 and Kolibri-1 at 4:1. Beam's ratio and window size are not given.
- "Fine-grained routed experts": many small experts rather than a few large ones (the mixture-of-experts explainer covers why). The count, the top-k and whether there is a shared expert are not given.
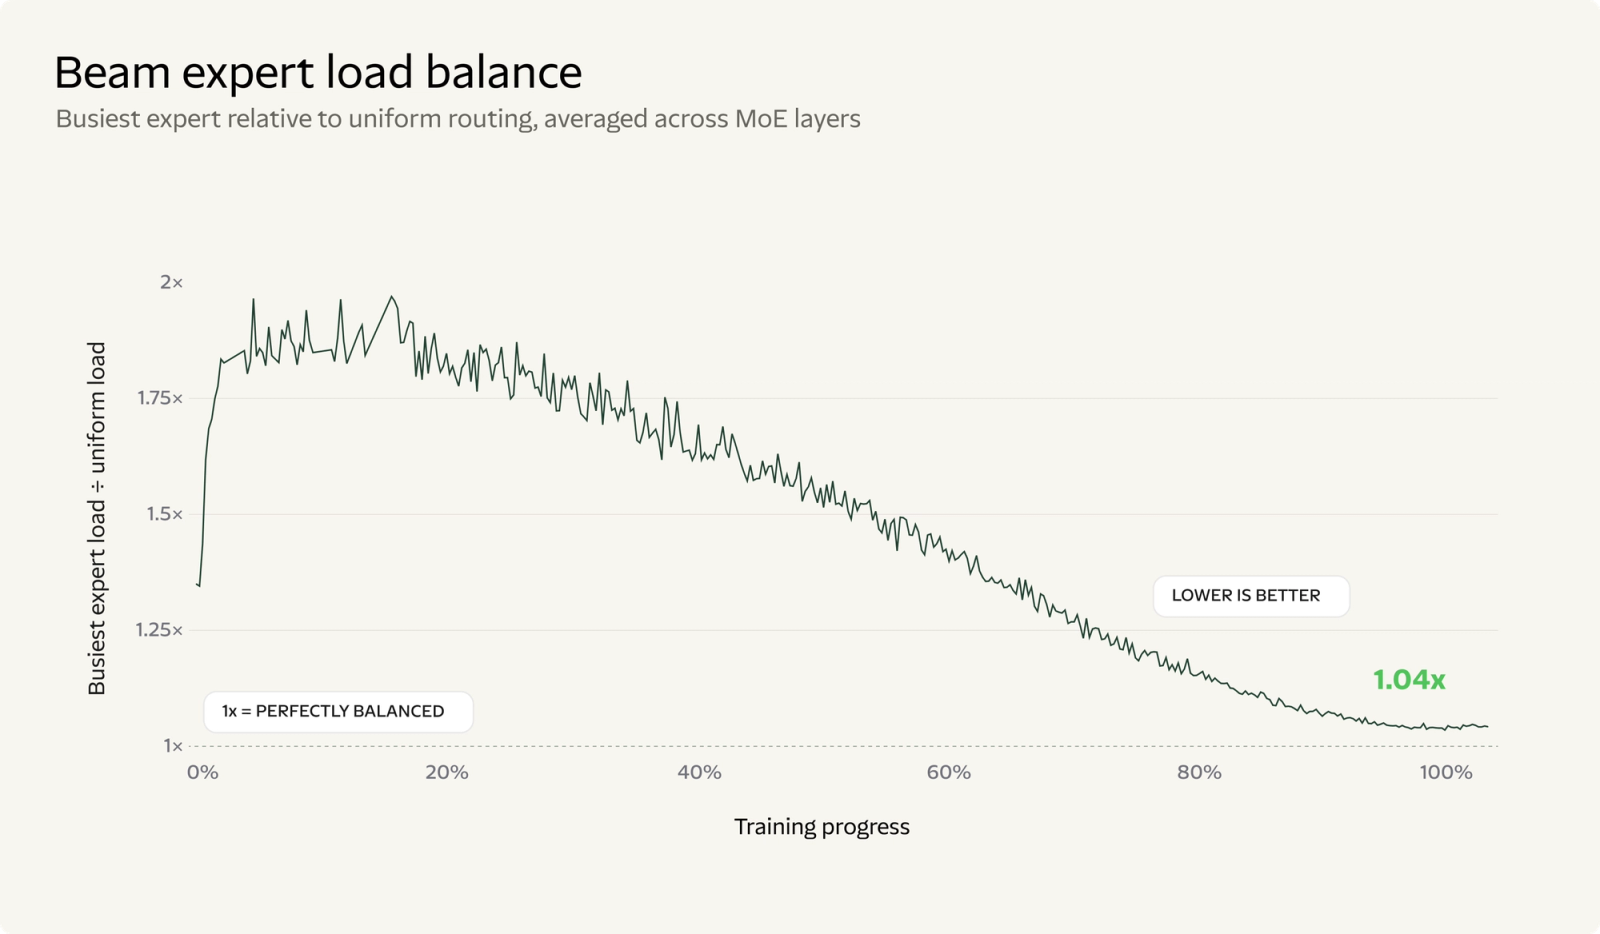
- Auxiliary-loss-free load balancing in the DeepSeek-V3 style, where a per-expert bias nudges the router instead of an extra loss term, with one change: the bias updates decay on a cosine schedule "to reduce routing perturbations later in training". Plus a sequence-level balancing term aimed at data outside the pretraining distribution, which is to say the RL data that comes later.
- A controlled residual stream: a depth-based scaling of sublayer outputs, SandwichNorm (a norm before and after each sublayer), elementwise attention gating, and FP32 residual accumulation, so that adding many small updates to the stream does not lose them to bf16 rounding.
- Context: midtraining extends it to 1M tokens. RL rollouts ran at up to 256K.
- Text only. The blog says so twice.
That is enough to know the shape of the thing and not enough to compute anything about it: no hidden size,
no head counts, no vocabulary, so no KV-cache arithmetic and no parameter recount of the kind I did for
Kolibri-1. That waits for config.json.
Two of the stability claims come with plots, and they are worth looking at because they are the kind of evidence that usually stays internal.
What "efficiency" means here
The headline claim is from the thread: "3-4x more efficient than GLM 5.2 and over 4x more efficient than leading Western open models." The question to ask of any efficiency claim is: per what?
The blog answers it in the caption of its Figure 2, which is unusually explicit (reported):
estimating generation forward-pass compute as FLOPs ≈ 2 × active parameter count × mean generated tokens per attempt ... These estimates exclude prompt prefill, context-dependent attention operations, and serving overhead
So the x-axis is not measured cost, wall-clock or dollars. It is a formula:
where is parameters touched per token and is the mean number of tokens the model generates per attempt, reasoning included. The factor 2 is one multiply and one add per weight per token. The scores for the other models come from Artificial Analysis and DataCurve.
That formula has two inputs, and only one of them is behaviour. To see how much each contributes, I read the dots off both versions of the chart Reflection published: one with a token axis, one with the FLOP axis.
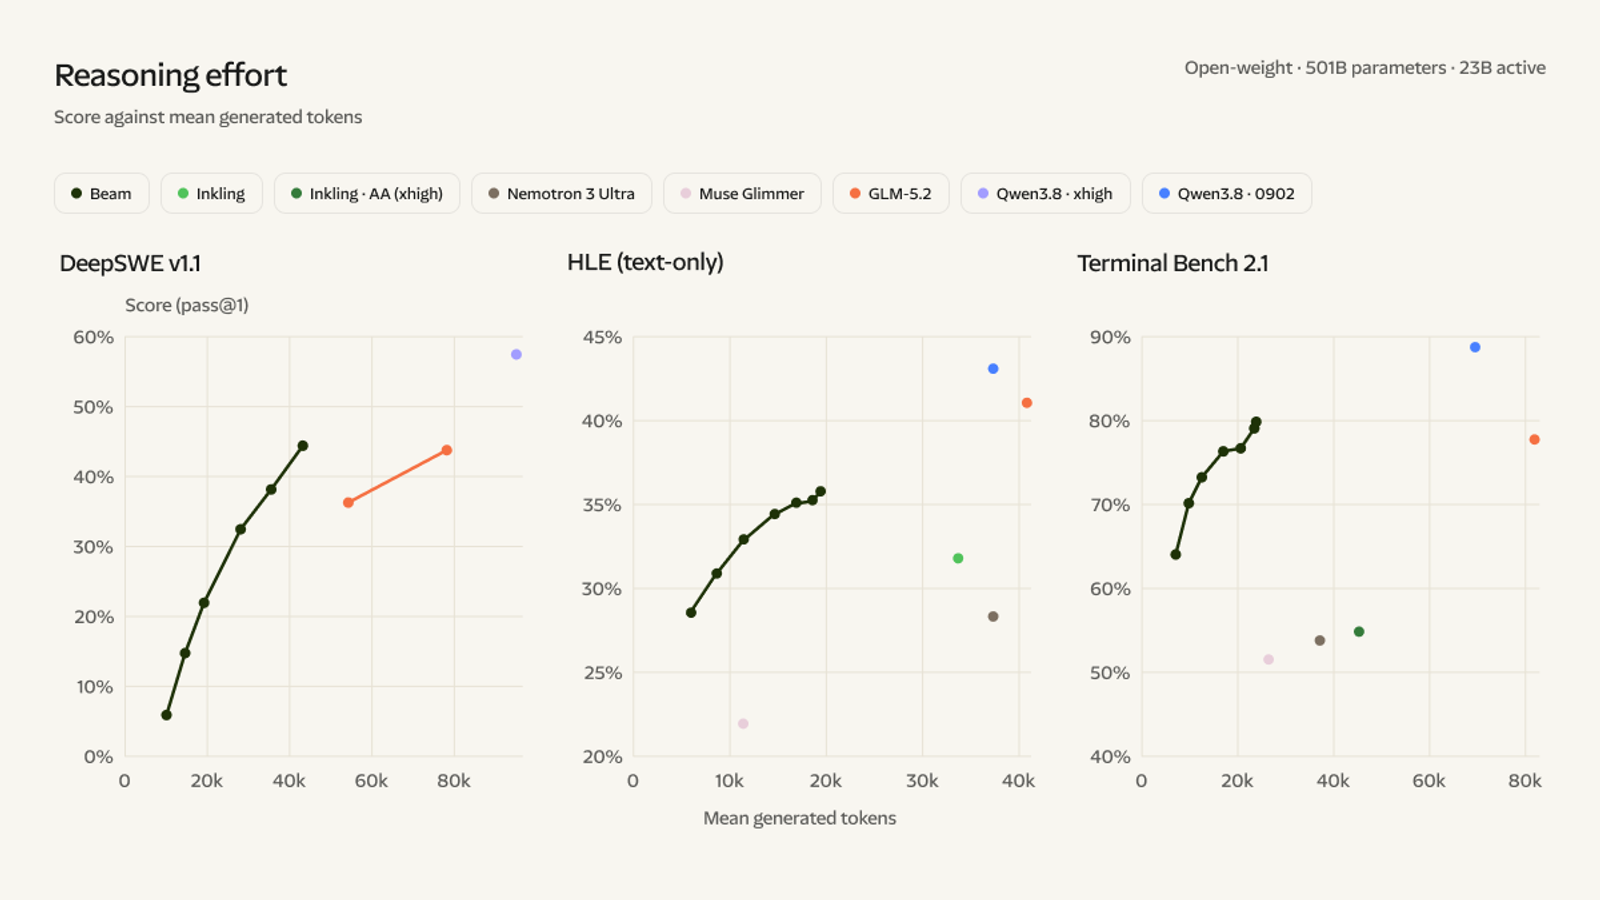
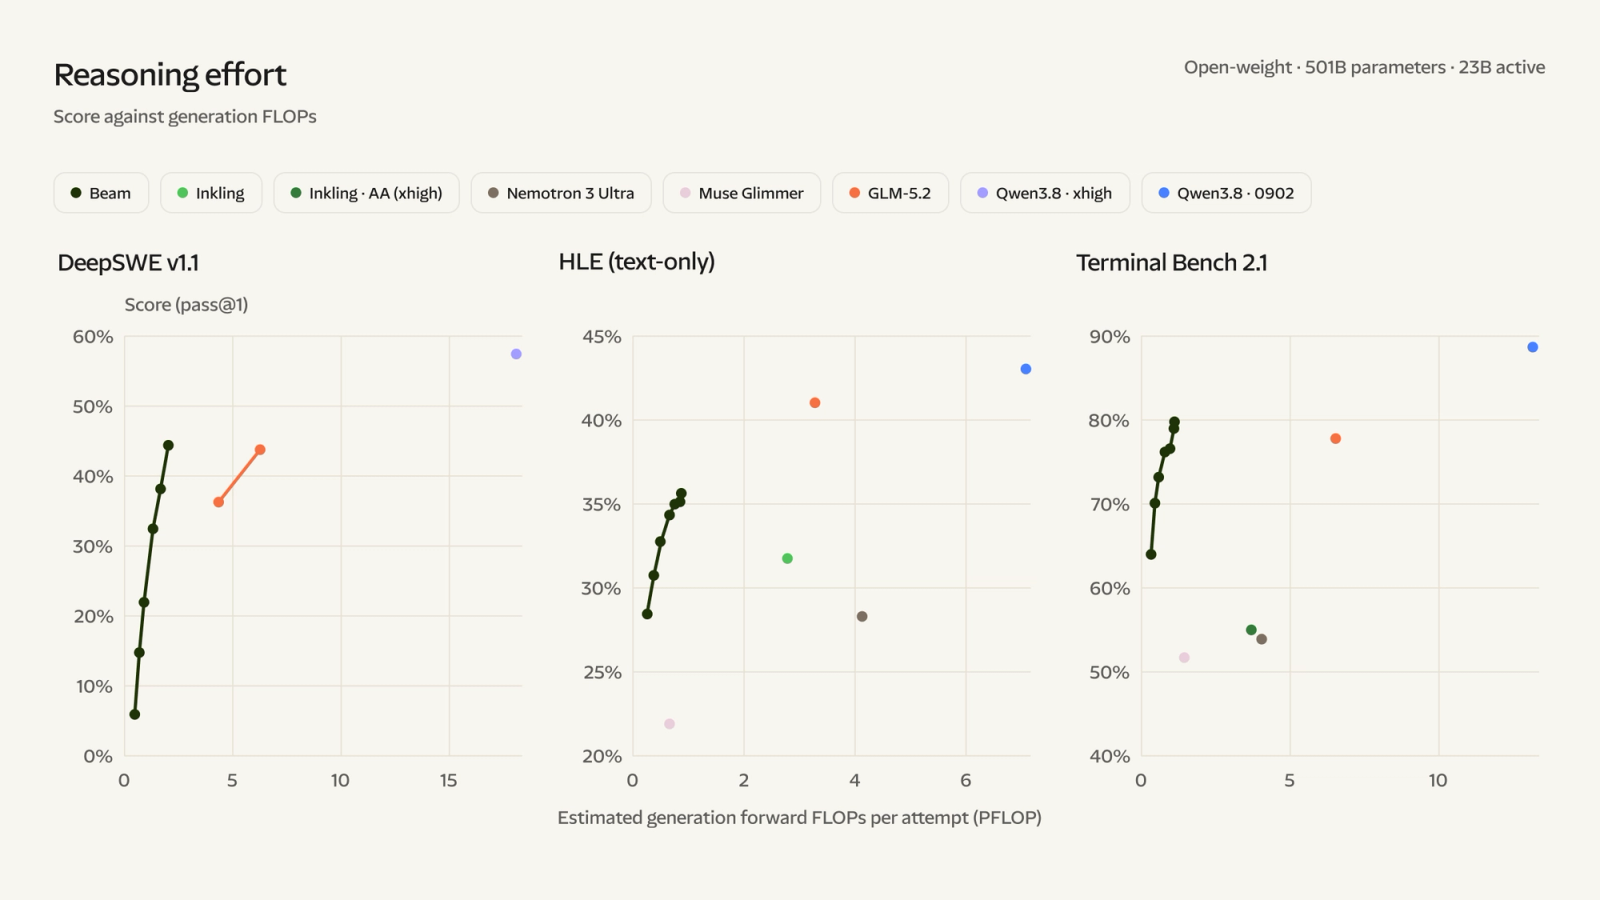
I located each dot's pixel centre and mapped it through the gridlines (measured; good to about half a point and half a thousand tokens). Then I recomputed the FLOP axis myself from the token readings, with 23B for Beam and 40B for GLM-5.2. My recomputed FLOPs land within about 3% of where Reflection drew them: Beam's top DeepSWE point at 1.98 PFLOP against 2.04 read off their chart, GLM-5.2 at 6.22 against 6.30, GLM-5.2 on Terminal Bench at 6.48 against 6.54 (measured). The same back-solve gives 41B for Inkling's Terminal Bench point and 95B for Qwen3.8's HLE point, the active counts this site reports for Inkling and Qwen3.8-Max. The chart is the formula, applied consistently. Nothing hidden.
Now split the ratio. Any FLOP ratio against GLM-5.2 is the token ratio times (reasoned). That 1.74 is fixed by architecture: it is what you get from having fewer active parameters, before the model does anything clever. The rest is how many tokens each model spends:
| Benchmark | GLM-5.2 (top point) | Beam (comparison point) | Token ratio | FLOP ratio |
|---|---|---|---|---|
| DeepSWE v1.1 | 43.7% at 77.8k tokens | 44.3% at 43.1k | 1.8x | 3.1x |
| Terminal Bench 2.1 | 77.6% at 81.0k | 79.4% at 23.5k | 3.4x | 6.0x |
| HLE (text-only) | 41.0% at 40.7k | 35.7% at 19.4k | 2.1x | 3.7x |
Scores and tokens are measured off the chart; the ratios are reasoned. On DeepSWE and Terminal Bench Beam's comparison point scores at least as high as GLM-5.2's, so those are fair like-for-like ratios. On HLE Beam never reaches GLM-5.2's score at any effort level; the 3.7x there buys GLM-5.2 about five more points, which is not the same thing as being 3.7x less efficient.
So "3-4x" is a fair summary of DeepSWE (3.1x) and conservative for Terminal Bench (6.0x), as long as you remember the unit is the formula, and that on DeepSWE about half the ratio, on a log scale, is the 1.74x active-parameter factor rather than shorter reasoning.
The widget plots my readings of the dots. Switch the axis to tokens and the gap shrinks to what the model's behaviour alone accounts for; switch back and every GLM-5.2 point slides right by a factor of 40/23 relative to Beam's. Drag Beam's effort down and the comparison stops being matched: Beam at its lowest Terminal Bench setting is at 64.0% on about 7k tokens.
What the formula leaves out
The caption says it plainly and it matters for agentic work: prefill and attention are excluded. A Terminal Bench or SWE task is mostly prefill. The agent re-reads a growing transcript of file contents and command output on every turn, and attention cost grows with that context. A metric that counts only generated tokens rewards a model for being terse; it says nothing about the cost of the context it reads. With prefix caching that cost shrinks, but not to zero.
It also leaves out memory. The FLOP count uses 23B, but serving Beam means holding all 501B in memory, about 501 GB at FP8 or roughly half that at NVFP4 (reasoned, one byte or half a byte per weight, ignoring scales). GLM-5.2 holds 744B. On a per-node basis Beam's smaller total is a real advantage too, but it is not the advantage the chart measures.
None of this makes the claim wrong. It makes it a claim about tokens per task, scaled by active size, which is a useful thing to know and not the same as "completes tasks faster and cheaper", the thread's wording. That depends on the serving stack, which nobody outside Reflection can run until the weights ship.
Where Beam is and is not ahead
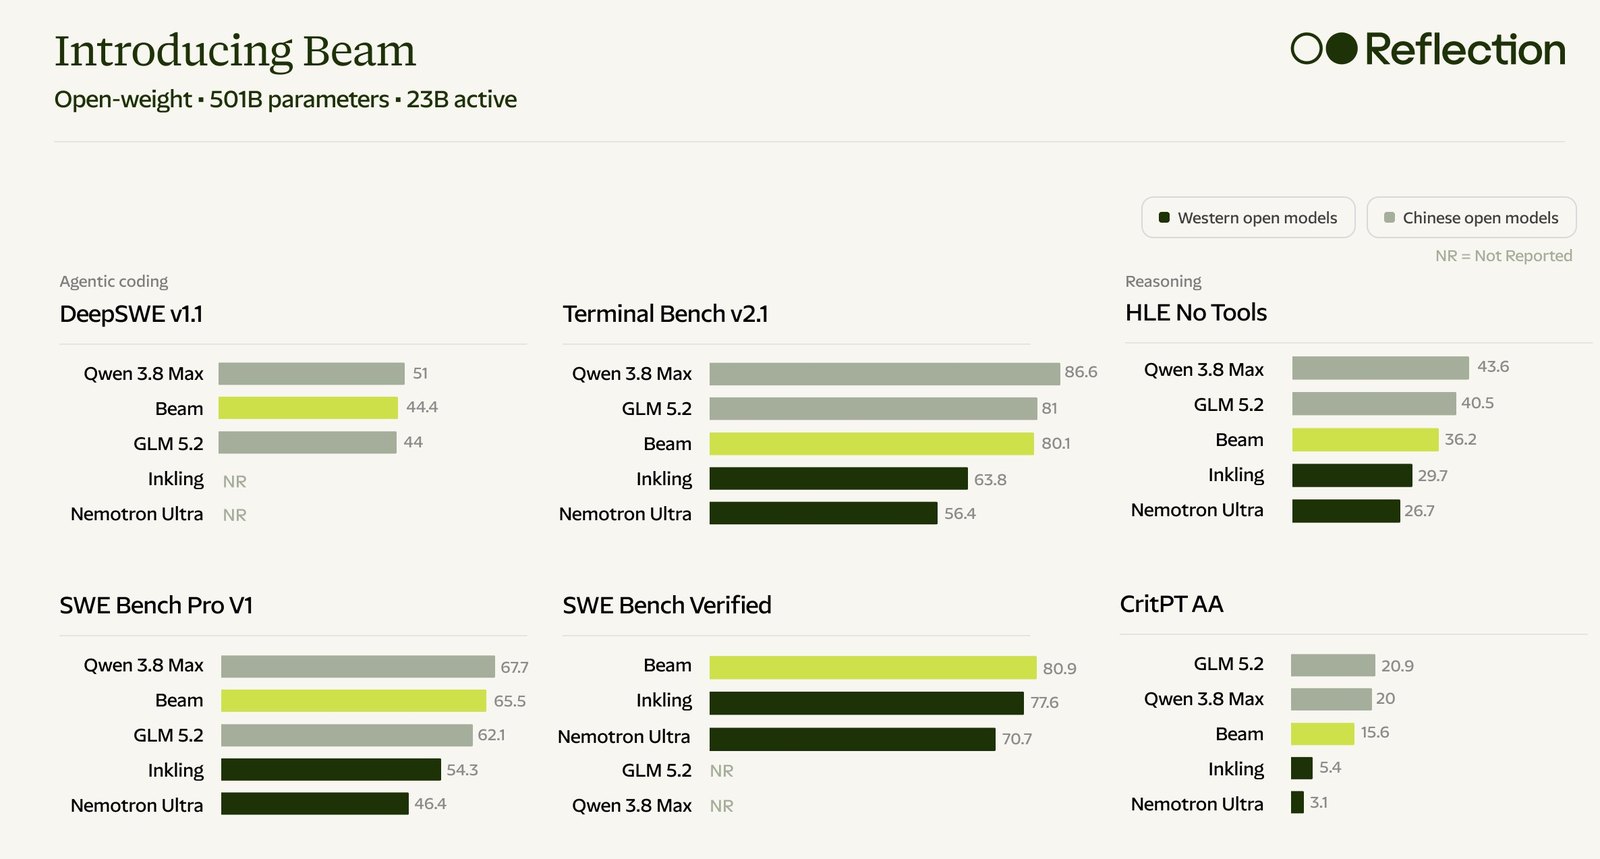
The blog's full table carries more models than the launch image, and it is candid in places. On Terminal Bench v2.1 Beam scores 80.1, against 81.0 for GLM-5.2, 86.6 for Qwen 3.8 Max, 88.3 for Kimi K3 and 90.6 for DeepSeek V4.1 Flash. On DeepSWE v1.1 it is 44.4, against 74.2 for DeepSeek V4.1 Flash. The blog says as much: "Where frontier open models like Kimi K3 remain ahead on raw capability, Beam's advantage is efficiency at inference time." (All reported.)
Two consistency notes. The launch image gives Beam 15.6 on CritPT; the blog's table says 16.3. And the GLM-5.2 Terminal Bench dot on the efficiency chart sits near 77.6%, while the table lists 81.0; the chart's points for other models come from Artificial Analysis, the table's presumably from the model's own report. Neither changes the story. Both are the kind of thing a technical report should settle.
The comparison set is chosen with care, too. "Over 4x more efficient than leading Western open models" compares Beam with Inkling, Nemotron 3 Ultra and Muse Glimmer, which on Terminal Bench also score 16 to 28 points lower (reported for the first two, 63.8 and 56.4 against 80.1; measured off the chart for Muse Glimmer, about 52%). That is a frontier claim more than an efficiency one, and the Pareto picture says it fairly: Beam is up and to the left of all three.
The RL run
The thread's strongest claim is about scale, and here the blog gives numbers I can do arithmetic on (all reported unless marked):
- 10.5K NVIDIA GB300 GPUs for four weeks, over 100 million rollouts, max context 256K tokens.
- About 1.3 billion sandboxes for training and grading; a pool of nearly one million environments.
- An average of 110K concurrent rollouts, up to 170K concurrent sandboxes.
- Inference-to-training GPU ratios between 3.9:1 and 5.4:1, with the trainer resized across five mesh layouts mid-run.
- New weights reached the inference fleet in a median of about 12 seconds.
- 71 inference incidents absorbed without killing the job.
Some things follow directly. 100 million rollouts in 28 days is about 41 rollouts finishing every second. With 110K rollouts in flight on average, Little's law gives a mean rollout lifetime of about 2,660 seconds, roughly 44 minutes (reasoned, an upper bound since "over 100 million"). That is what long-horizon agentic RL looks like at the systems level: most of the fleet is waiting on rollouts that take most of an hour. At a 3.9:1 to 5.4:1 split, the trainer gets roughly 1,640 to 2,140 of the 10,500 GPUs (reasoned), and the rest generate.
Long rollouts are why staleness is the central problem. A rollout that runs for an hour is generated by several successive checkpoints, so its early tokens come from an older policy than its late ones. Reflection tags every token with the weight version that produced it and trains with asynchronous policy gradients that account for that age. Their figure shows the oldest sample in a batch reaching 107 versions behind, about a day old, while the KL between sampling and updated policy stays bounded. 107 versions in a day is one new version about every 13.5 minutes (reasoned).
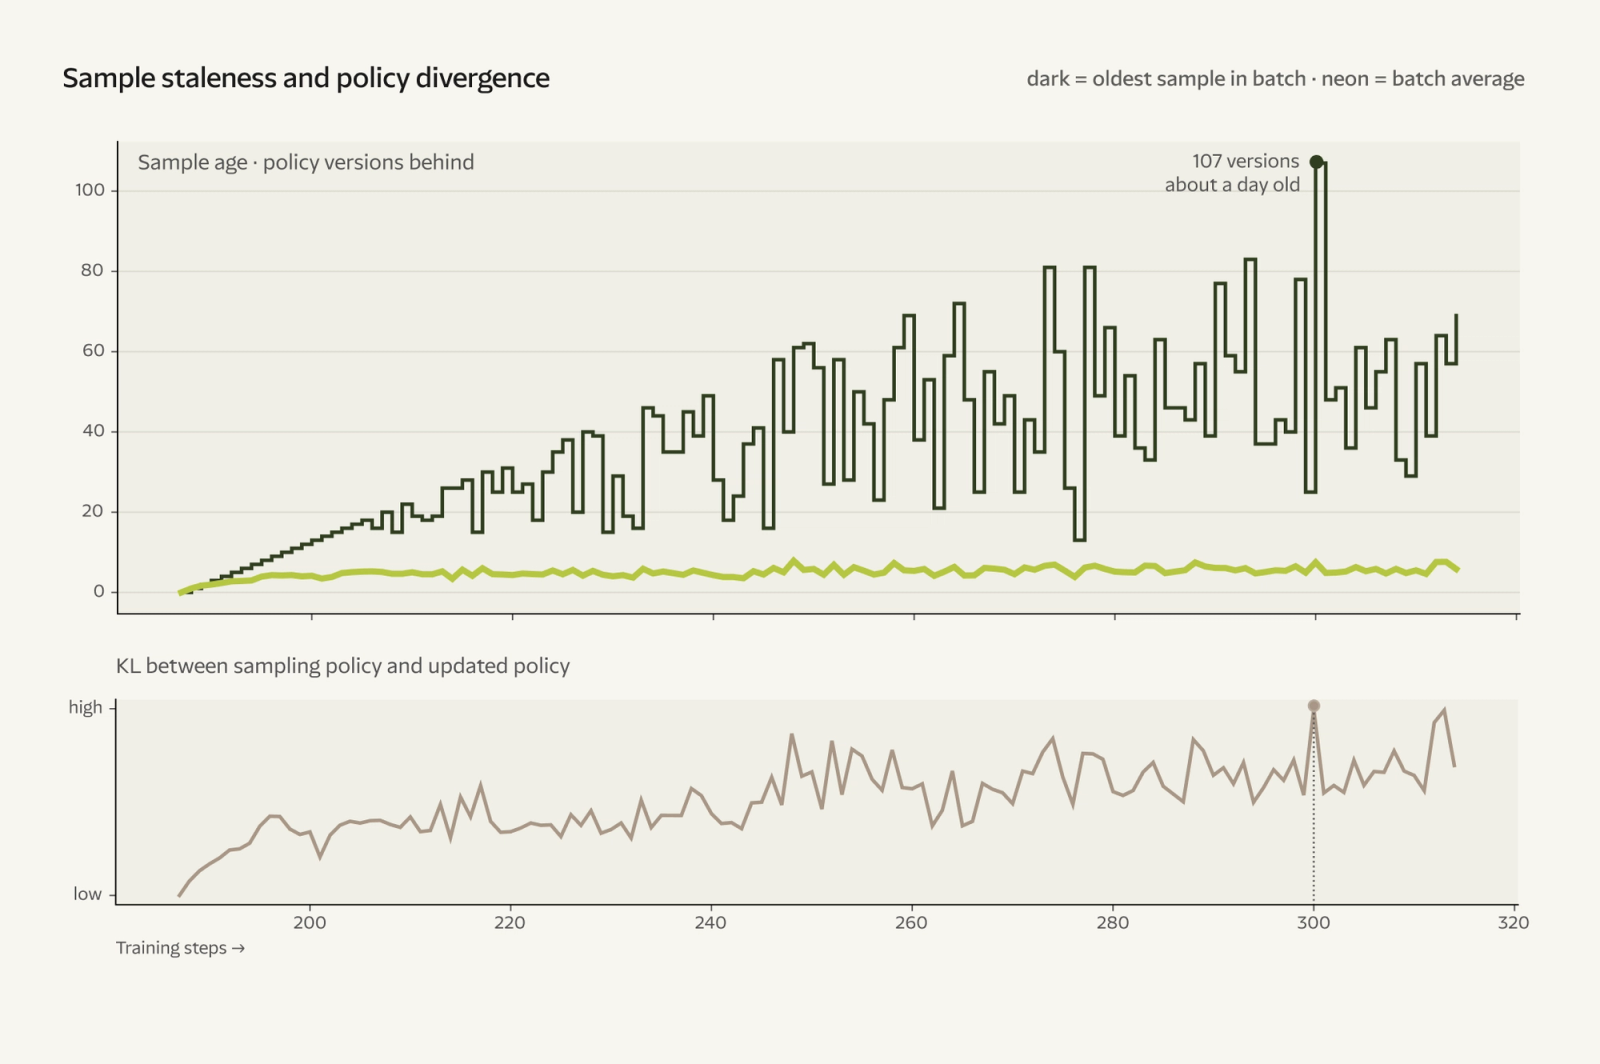
The algorithm itself is not described. That is the main gap in the RL section. The infrastructure ideas, asynchronous rollout fleets, versioned tokens, fast weight broadcast, are the same family I covered in Fireworks' distributed RL and scaling agentic RL; Reflection's contribution is the scale and the claim that it stayed stable.
Does capability keep improving?
"Across our eval suite, capabilities continued to improve as we increased RL - with no signs of plateau." The evidence is this figure, covering the reasoning expert's training (80M of the 100M+ rollouts).
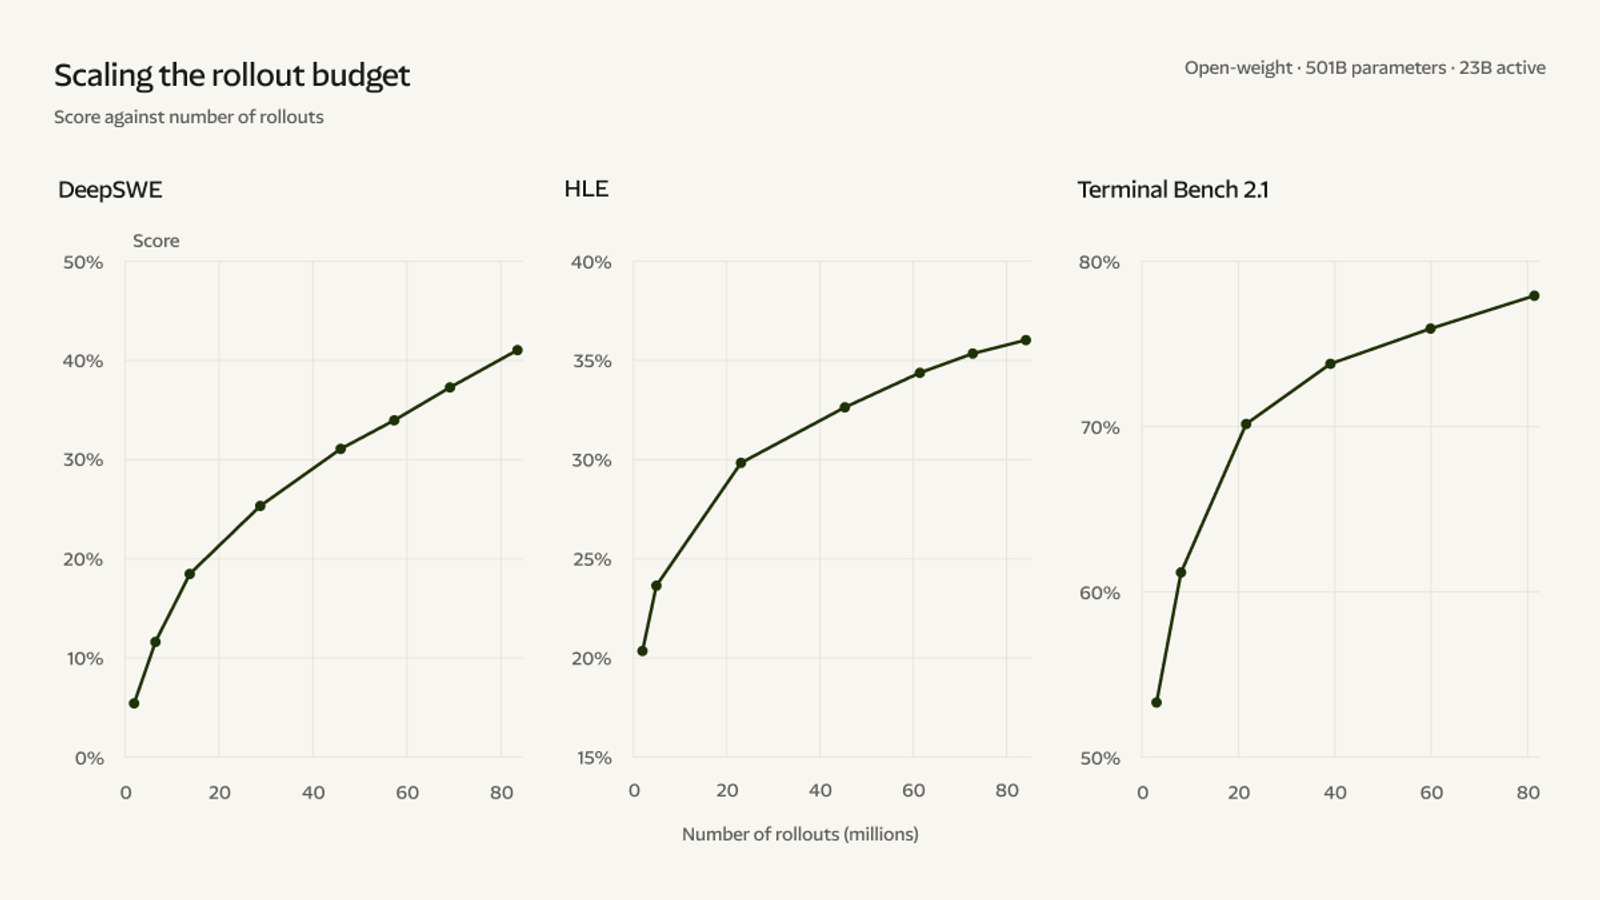
Read it honestly. All three curves are still going up at 80M rollouts, so "no plateau" is true of these curves. They are also clearly concave on a linear axis: DeepSWE gains about 13 points in the first 13M rollouts and about 10 in the last 37M (measured, from the chart). Terminal Bench goes from 70% at about 20M to 78% at 80M. That is the shape of log-linear scaling, the same shape Inkling reported over its 30M rollouts. It is not a plateau; it is a bill that grows exponentially per point.
One more detail is worth noticing. The rollouts plot is for a "reasoning expert", and the safety section explains that the final model was produced by multi-teacher on-policy distillation: one RL teacher for capability, a separate SFT+RL teacher for safety and alignment, merged into Beam. So the 80M-rollout curve is the teacher's, and the released model is a distillation of it. That is a common recipe now; it means the scaling curve and the shipped checkpoint are not the same model.
The compute ledger
Now the cost side. For pretraining, the standard estimate is
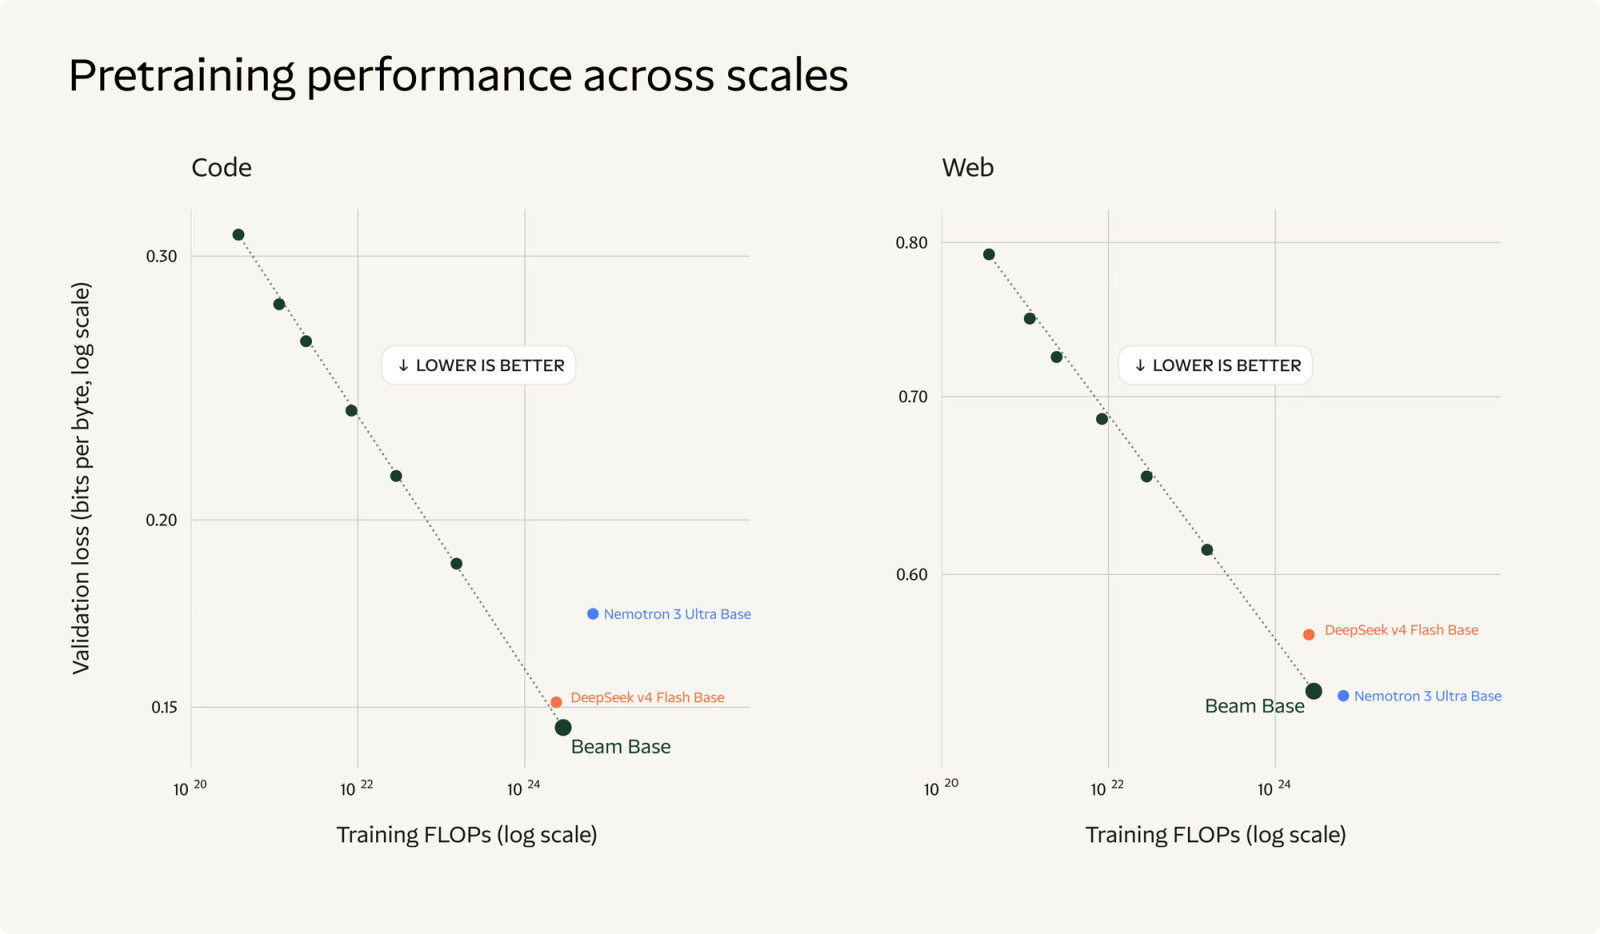
two FLOPs per weight per token forward, four backward. The thread says "24T" tokens; the blog says 23.8 trillion. With 23B active that is FLOPs (reasoned). Reflection's own pretraining-scaling plot gives a check: I located the "Beam Base" dot on its log axis at about , about (measured). My 6ND figure is 0.05 decades, about 12%, above it, which is within what one choice of convention (embeddings, attention FLOPs) moves.
The blog also gives the hardware: "under four weeks on a cluster of 6,144 NVIDIA GB300 NVL72 GPUs", with 92.3% goodput late in the run and nine semi-automatic rewinds. At the full 28 days that is 4.13M GPU-hours, and FLOPs spread over them is about 221 TFLOP/s sustained per GPU (reasoned). Against the 2,250 TFLOP/s dense BF16 peak that Ai2 normalises B300 MFU to in Olmo-core 3, that is under 10%. Even at three weeks it is about 13%.
That number is low, and I do not think it means the cluster idled. It means 6ND undercounts this run, or the run is not what the four-week figure covers. Attention FLOPs at long context are excluded from 6ND; a fine- grained MoE pays communication costs that never show up as FLOPs; "under four weeks" may be for the final run alone, without midtraining or ablations; and some fraction of 6,144 GPUs may have been spare. The technical report should resolve it. For now, the honest reading is: the token count and active size put Beam at about FLOPs, which is a mid-sized frontier pretraining run, and the GPU count is generous for it.
The RL phase is where the hardware went. 10,500 GPUs for 4 weeks is 7.06M GPU-hours, against at most 4.13M for pretraining (reasoned). RL used about 1.7x the GPU-hours of pretraining. For comparison, the whole Kolibri-1 training run was reported at 392k GPU-hours.
The ledger puts Beam's 6ND figure beside the other open MoEs on this site that report both active size and token count: Kolibri-1 at about , GLM-5.2 at , Inkling at (all reasoned from their reported numbers). Beam's pretraining is the cheapest of the three frontier-class models by this measure. The GPU-hour view shows the inversion: for Beam, RL is the larger line item.
That inversion is the most interesting thing in the announcement. For years the rule of thumb was that post-training is a rounding error on pretraining. Here a lab reports spending more GPU time on RL than on pretraining, and a capability curve that has not flattened at the end. The RL GPU-hours are not the same as RL FLOPs, since most of those GPUs ran inference at low utilisation waiting on sandboxes, but as a budget line it is the right comparison.
What cannot be checked yet
Everything that matters for using the model:
- The architecture numbers. Expert count, top-k, attention window, head layout, vocabulary. Without them no KV-cache sizing, no memory plan, no independent active-parameter count.
- The efficiency claim in practice. Tokens per task can be re-measured by anyone with the weights and a harness. Serving cost per solved task, including prefill, cannot until someone runs it.
- The benchmarks. Every score here is Reflection's or a third party's that Reflection quoted. The harnesses, effort settings and pass@1 sampling are not documented in the blog.
- The quantizations. FP8 and NVFP4 are promised. How much score each gives up is a number that should be in the model card.
- The RL algorithm. "New algorithms" for staleness and training-inference mismatch are claimed, not described.
Reflection has said the technical report comes with the weights. If it carries the config and the stability recipe in the detail the blog's charts suggest exists, Beam will be one of the better documented open models. Until then it is a well-made set of charts, and the efficiency chart, at least, says exactly what it measures.
Sources
- Reflection AI, Introducing Beam: Reflection's 501B open-weight model, 5 October 2026. All figures in this article except the first are from this post.
- Reflection AI, launch thread on X, source of the benchmark image and the "3-4x" and "largest publicly documented RL run" wording.
- Hugging Face model search for
reflection-aiand variants, checked 6 October 2026: no repositories.