2026-08-10 · 12 min · agents · on-device · attention
Why read this
Notabletop 60%Closes Muse Glimmer's 24 GB claim from config and file sizes (21.6 GB at 131K), shows sliding windows make it fit, and re-tallies a table Meta loses a third of.
- Original analysis
- Runs on a consumer GPU
- Widely used
LLM architectureApache-2.0Practitioner model
How this was scored
- Is it new?
- 1 of 3: An incremental tweak
- Can I trust it?
- 2 of 3: Measures key facts from files, code or configs
- Can I run it?
- 2 of 3: Open code or weights with real limits
- Will I understand it?
- 2 of 3: Mechanism from first principles with figures
- Can I act on it?
- 2 of 3: A concrete recipe, numbers or comparison
- Will it last?
- 1 of 3: Relevant for months
- Does it affect many?
- 2 of 3: A widely used model, tool or lab release
- Only here?
- 2 of 3: A teardown or measurement few others did
Score 62 of 100, ranked 212 of 445 rated articles. Each question is answered 0–3 by hand, and a 3 is rare. How articles are scored
Most model releases describe an architecture and then mention, near the end, what hardware it runs on. Muse Glimmer — released by Meta Superintelligence Labs on 2026-08-09 under Apache 2.0 — reads the other way round. Nearly every structural choice in it is answering the same question, which is how do we fit a competent agent, its KV cache at 131K tokens, a vision encoder and a speculative-decoding drafter inside 24 GB at once?
That is a good question to design against, and the interesting thing is that you can check the
answer. Every number below comes from config.json, the safetensors index, and the file sizes in
the four repositories Meta actually shipped. The 24 GB claim is not a vibe; it is arithmetic, and it
closes with 2.4 GB to spare.
- architecture
- MuseGlimmerForConditionalGeneration
- task
- image-text-to-text
- library
- transformers
- license
- apache-2.0
- safetensors
- 2 shards
- largest file
- 49.95 GB
- files
- 13
- downloads
- 307.4K
- likes
- 1.9K
repo last modified 2026-08-11
The budget, and what makes it work
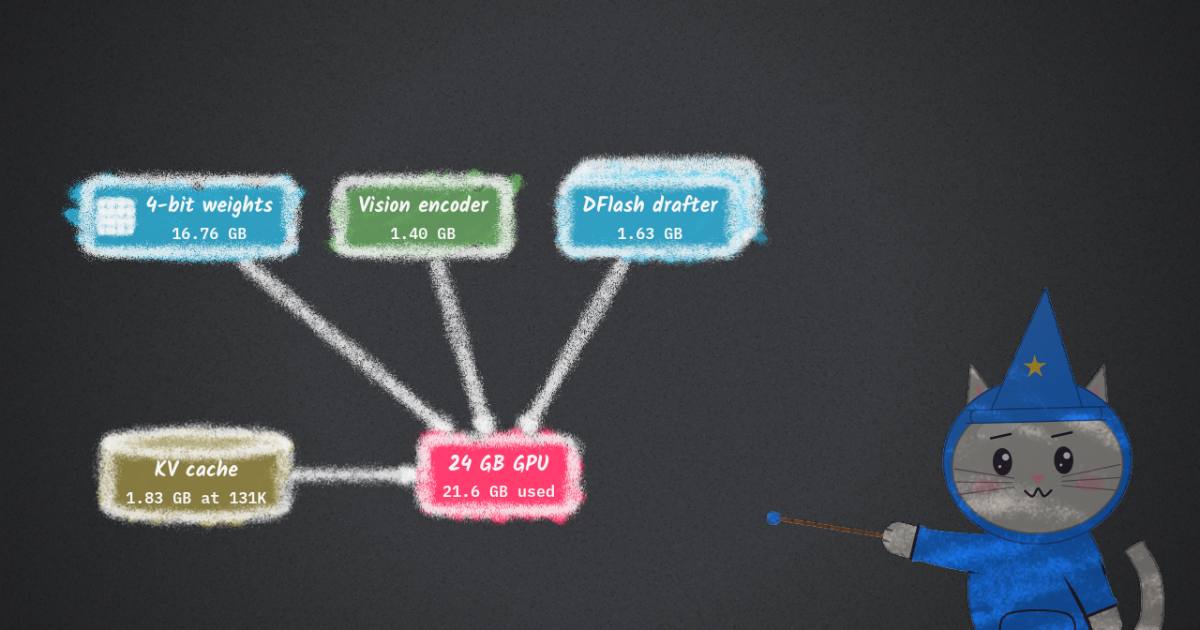
Start at the end. The card says 4-bit quantization shrinks the language model to "under 20 GB," leaving headroom for the KV cache, the perception encoder and the drafter within a 24 GB envelope. Here are the measured artifact sizes from the GGUF repository, plus a KV cache computed from the config rather than quoted:
As shipped, at the full 131K context, the whole system lands at 21.6 GB — inside a 24 GB card with 2.4 GB to spare. Now turn off the sliding-window pattern. The KV cache goes from 1.83 GB to 6.98 GB, the total becomes 26.8 GB, and the headline claim fails. That is the point worth taking away: the 3-local-1-global stack is not a nicety bolted onto a model that already fit, it is the reason it fits. Turn off GQA as well and the KV cache alone is 112 GB, which is roughly the distance between designing for a datacenter and designing for a laptop.
The KV arithmetic is simple enough to do in one line. With 2 KV heads at head dimension 128 in
bf16, each token costs 2 × 2 × 128 × 2 = 1024 bytes per layer. Thirteen of the fifty-two layers
are global and hold the whole context; the other thirty-nine are capped at a 2048-token window. At
the full 131,072-token context that is 1.83 GB — and 16.76 + 1.63 + 1.40 + 1.83 = 21.6 GB.
Now take away the sliding-window pattern and make all 52 layers global. The KV cache becomes 6.98 GB, the total becomes 26.8 GB, and it no longer fits on the card the release is named after. That is the sentence worth keeping: the 3-local-1-global stack isn't an efficiency refinement applied to a model that already fit, it is the reason the model fits at all. Take away the 16:1 GQA as well and the KV cache alone is 112 GB.
The attention stack, verified line by line
The card describes the attention as "[Local, Local, Local, Global] repeating" with "RoPE
(θ = 500,000), local layers only." Both claims are checkable per layer, because config.json
carries two 52-element arrays.
Two arrays in config.json line up perfectly, and the coincidence is the design. layer_types gives L L L G thirteen times over; layer_rope_theta is 500,000 on every local layer and exactly 0 on every global one — I checked all 52 and there are no exceptions. So the layers that see the whole context carry no positional encoding at all, and order information reaches them only through what the sliding layers below already encoded. That is the same NoPE-on-global-attention arrangement in Kimi K3 and Maple-Preview, arrived at independently by three labs in the same year, and the usual argument for it is length extrapolation: a layer with no notion of absolute distance has nothing to be surprised by when the context grows.
layer_types gives L L L G thirteen times exactly. layer_rope_theta is 500,000 on every local
layer and 0 on every global one, with zero mismatches across all 52. So the layers that see the
entire context run with no positional encoding at all.
That is worth pausing on, because this site has now covered three independent labs converging on it
inside a year: Kimi K3 applies NoPE to its full-attention layers, and
Maple-Preview sets nope_on_global_attention: true on the same 3:1
pattern at 24 layers. Muse Glimmer makes it explicit per layer rather than as a flag. The shared
argument is length extrapolation: a layer carrying no notion of absolute distance has nothing to be
surprised by when the context gets longer than anything it saw in training, and the local layers
underneath have already encoded order well enough to reconstruct it.
A few things the config says that the card does not:
final_logit_softcapping: 20.0— logits are squashed through a bounded function before the softmax, a Gemma-style stabilizer that the model card never mentions.qk_scale_factor: 3.87— the attention scale is not the textbook . At head dimension 128 that would be 0.0884; this multiplies it by 3.87.output_multiplier: 0.19611613513818404— which is exactly , a residual-stream rescale tied to the hidden size.post_norm_eps: 1e-08, separate fromrms_norm_eps: 1e-05— implying a post-norm alongside the pre-norm rather than one or the other.
None of these is exotic on its own. Together they're a reminder that the published table of hyperparameters is a summary, and the config is the document.
It is a distillation, and the blog says so
The model card describes what Muse Glimmer is. The blog post describes where it came from, and this is the part that most changes how you should read the benchmark numbers:
Pre-Training. We trained Muse Glimmer on Muse Spark's outputs using logit distillation, leveraging a similar data mix as the teacher. Mid-Training. We trained the model on longer-context, more agent-heavy data with richer reasoning traces, alongside organic data. Post-Training. We combined supervised fine-tuning with a mix of on-policy distillation and reinforcement learning across general, reasoning, coding, and agentic domains.
Distillation from Muse Spark at both ends — logit distillation during pretraining, on-policy distillation during post-training. Muse Glimmer is not a small model trained well; it is a large model compressed, twice, with RL in between. That framing explains the shape of the results better than "30B punches above its weight" does: what transferred is the teacher's behaviour on agentic trajectories, which is exactly where the model is strongest.
It also sets up the safety argument later on, which leans on Muse Glimmer being "broadly weaker than Muse Spark 1.0" — a claim that is much easier to make about a distilled student than about an independently trained model.
Speculative decoding, and why the same drafter is worth 3.1× or 1.5×
The second optimization is a companion "drafter" based on DFlash that proposes an entire block of 16 tokens in a single forward pass, which the main model then verifies in parallel. The shipped drafter is a 5-layer model at the target's full 6656 width — 2.56B parameters, 5.1 GB in bf16, 1.63 GB quantized. Calling it "lightweight" is fair relative to 30B, but it is 8.6% of the model and it has to be resident.
Speculative decoding does not make a model faster; it converts a memory-bandwidth problem into an arithmetic one. Single-stream decoding is bandwidth-bound — you read 17 GB of weights to emit one token — so proposing a block of 16 and verifying them in one pass amortizes that read across all 16. How much you gain therefore depends entirely on how much spare arithmetic the device has once the weights are moving, which is why the identical drafter is worth 3.1× on a 5090 and 1.5× on an M4 Max. Worth noting too that the card reports one average per device while the blog’s chart carries error bars: on the 5090 the DFlash result spans roughly 132 to 340 tok/s across seven prompt categories, so the real range is about 1.8× to 4.5× and the single “3.1×” is the midpoint of a wide distribution.
The headline is 3.1× on an RTX 5090 and 1.5× on an M4 Max, and the gap between those two numbers is the whole mechanism. Single-stream decoding is memory-bandwidth-bound: you read the entire 17 GB of weights to emit one token. Proposing sixteen and verifying them together amortizes that read across all sixteen, so the gain depends on how much spare arithmetic the device has once the weights are already moving. A 5090 has an enormous compute-to-bandwidth ratio and converts nearly the whole block size into speedup; Apple's unified memory narrows that ratio, so verification stops being nearly free.
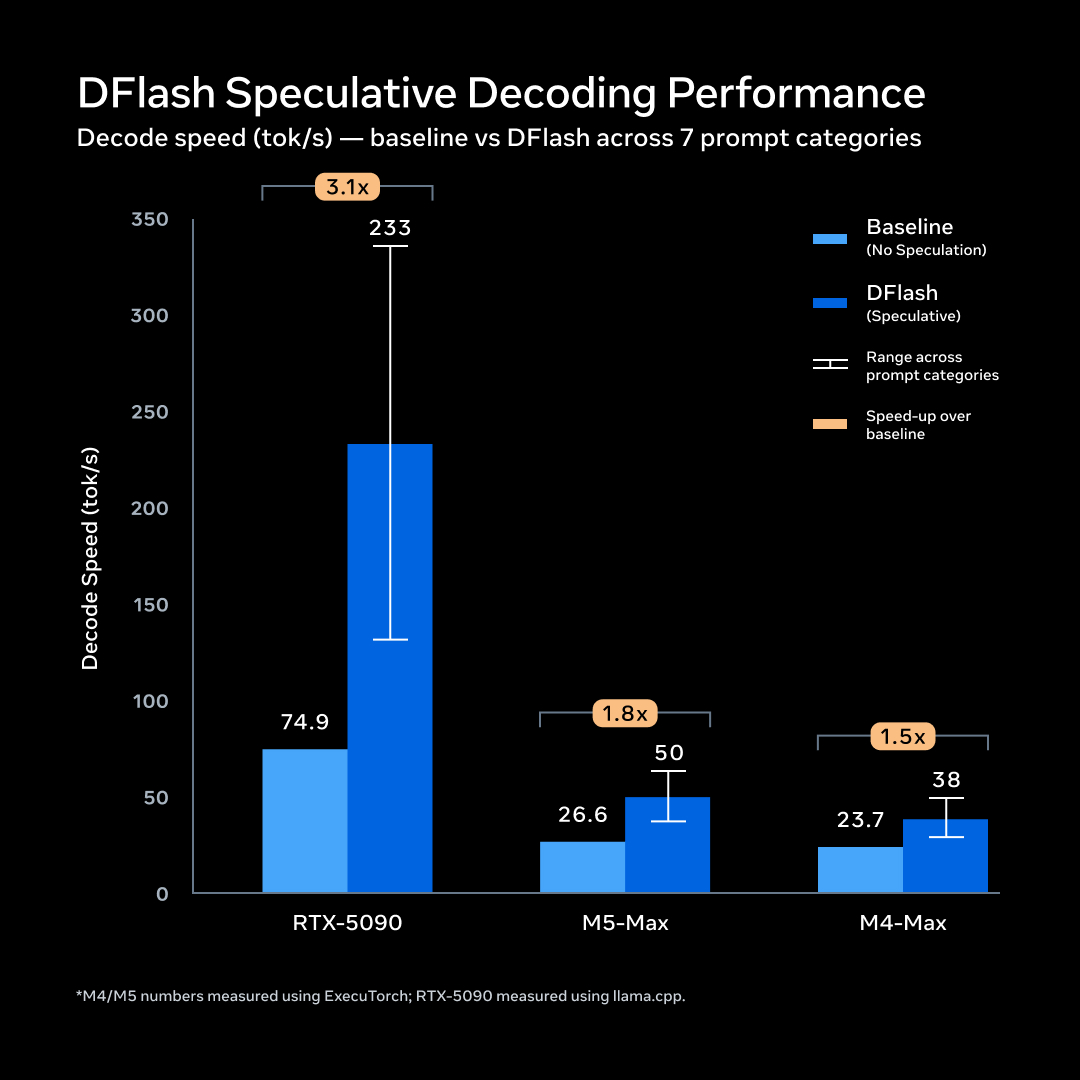
The chart carries information the card's table drops. Those error bars span seven prompt categories, and on the 5090 the DFlash result runs from roughly 132 to 340 tok/s. So the honest statement is that speculation is worth somewhere between 1.8× and 4.5× depending on what you ask, and 3.1× is the midpoint of a wide distribution rather than a number you should expect on your workload.
The benchmark table Meta loses a third of
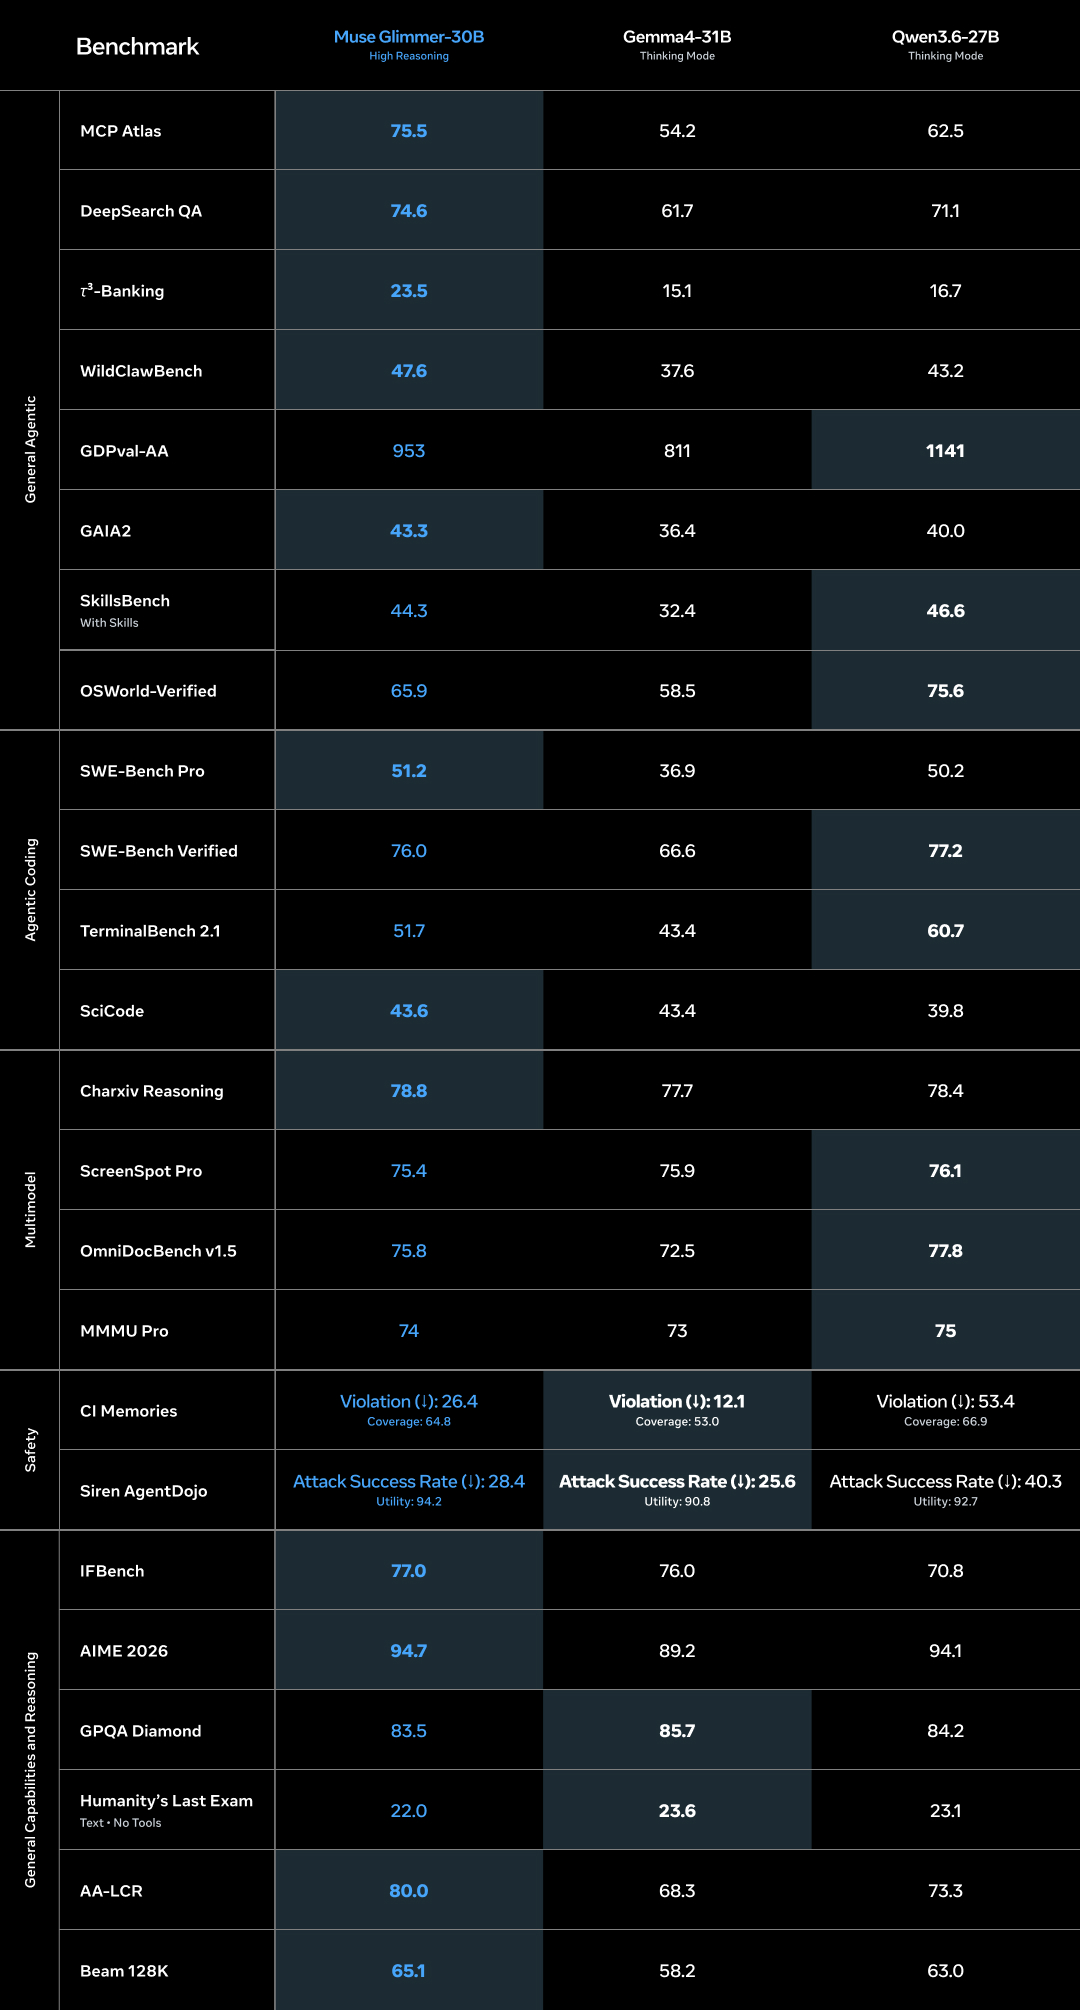
Re-tallied against the better of the two rivals in each row:
Meta publishes a comparison in which its own model loses 10 of 22 scored rows, and the losses are not rounding — OSWorld-Verified by 9.7 points and TerminalBench by 9.0, both to Qwen3.6-27B. Filter to agentic and the shape appears: the rows Muse Glimmer wins by a distance are the ones measuring tool schemas and multi-turn task completion, and the rows it loses are computer-use and long-horizon terminal work. That is a coherent, legible profile rather than a uniform win, and publishing it in that form is the least common thing about this release.
Muse Glimmer leads 12 of the 22 scored rows. Qwen3.6-27B takes 8, Gemma4-31B takes 2, and the losses are not decorative: OSWorld-Verified by 9.7 points and TerminalBench 2.1 by 9.0, both to a model three billion parameters smaller.
Filter that ledger to agentic and the profile becomes legible. The rows Muse Glimmer wins by a distance — MCP Atlas by 21 points over Gemma, τ³-Banking by 41% relative, DeepSearch QA, Gaia2 — are the ones measuring tool schemas and multi-turn task completion inside a scaffold. The rows it loses are computer-use (OSWorld) and long-horizon terminal work (TerminalBench). For a model distilled specifically on agentic trajectories, that is exactly the shape you would predict, and it is more informative than a uniform win would have been.
Publishing it in that form is the least common thing about this release. A comparison table where your own model is beaten in a third of the rows, by a competitor, in your own launch material, is not the norm.
The table where losing is the point
The chem/bio section inverts the usual reading of a benchmark, and it is worth explaining because the presentation is initially confusing. Meta bolds the most performant model in each row — and Muse Glimmer is deliberately not it in four of six:
| Muse Glimmer-30B | Gemma4-31B | Qwen3.6-27B | Kimi K3 | |
|---|---|---|---|---|
| MBCT | 41.5% | 50.6% | 45.9% | 58.9% |
| HPCT | 52.3% | 54.0% | 48.7% | 59.6% |
| VCT | 37.0% | 43.5% | 33.7% | 48.0% |
| WMDP (Bio) | 86.5% | 85.9% | 84.8% | 89.1% |
| WMDP (Chem) | 75.2% | 80.5% | 74.8% | 84.2% |
| Lab Bench (ProtocolQA) | 80.2% | 75.8% | 69.1% | 81.9% |
The argument is that Muse Glimmer sits "approximately in line with other models in its size class, while showing strictly lower capabilities than larger open-weight models, suggesting that it is unlikely to materially enable new threats upon release." Including Kimi K3 as an uncontested upper bound on every row is doing real work here: it establishes that whatever Muse Glimmer can tell you about wet-lab protocols, an already-open model tells you more.
The same inversion runs through the safety rows of the main table, and there Muse Glimmer genuinely loses. Gemma4-31B has less than half its contextual-integrity violation rate (12.1 vs 26.4) and a lower prompt-injection attack success rate (25.6 vs 28.4). Muse Glimmer's compensation is utility — 94.2 on AgentDojo against Gemma's 90.8 — which is the familiar helpfulness/safety trade stated in numbers instead of prose. Whether 26.4% is an acceptable violation rate for a model explicitly recommended for agents with "deep access to personal context" is a judgment the card leaves to you, and it does at least give you the number to judge with.
What actually shipped
I checked the "Released Artifacts" table against Hugging Face, because promised artifacts and present artifacts are frequently different things. All four exist, in three sibling repositories the card does not link:
| Artifact | Where | Size |
|---|---|---|
| BF16 weights | Muse-Glimmer-30B | 59.55 GB, 2 shards |
| 4-bit, 24 GB target | -GGUF / muse-glimmer-30B-kquant-17gb.gguf | 16.76 GB |
| 4-bit, 32 GB target | -GGUF / muse-glimmer-30B-kquant-dynamic.gguf | 19.65 GB |
| DFlash drafter | -GGUF / dflash-kquant.gguf, -assistant | 1.63 GB / 5.11 GB bf16 |
| Vision projector | -GGUF / mmproj-kquant.gguf | 1.40 GB |
| ExecuTorch builds | -ExecuTorch-PTE | metal + sm80, text and text-image |
The drafter's own config.json confirms the card's spec exactly — 5 layers, block_size: 16,
sliding window 2048 on all five, 32 query heads and 8 KV heads. The ExecuTorch repository ships
separate .pte files for Apple Metal and NVIDIA sm80, in text-only and text-plus-image variants,
which is how the M4/M5 numbers were produced.
One small correction to the card while I'm counting: it states total parameters as "~29.6B" twice. The safetensors index says 29,776,626,688 — 29.78B. A 0.6% understatement, and I mention it only because everything else in that table matched the config to the digit.
The take
The reason this release is worth reading closely is not the benchmark line, which is good but contested by a smaller competitor. It is that Muse Glimmer is a clean worked example of designing an architecture against a deployment constraint and then publishing enough for someone outside the lab to check the constraint was met.
The three decisions that matter — 16:1 GQA, three sliding layers per global one, and 4-bit quantization validated at 1.0% degradation — are not independent optimizations. They are one budget, allocated. Remove any of them and the model stops being the thing the announcement describes. That is a more useful artifact than a leaderboard position, because the budget is the part that generalizes: the next person trying to fit an agent on a laptop has a worked example with all its numbers exposed.
What is missing is the same thing that is always missing on day one. There is no third-party evaluation of any of these numbers, the methodology report is a link rather than a paper, and the quantization degradation figure — 1.0% averaged across 15 benchmarks — is exactly the kind of average that can hide a specific capability falling over. The card says the compression was validated on agentic tasks; it does not show that table.
Sources: the Muse Glimmer announcement
(Meta AI Research, 2026-08-10) and the Muse-Glimmer-30B model card,
plus config.json, model.safetensors.index.json and the file trees of the -GGUF, -assistant
and -ExecuTorch-PTE repositories, all as of 2026-08-10. Benchmark numbers are Meta's own, with no
third-party replication. The two figures are Meta's, flattened onto white. The KV-cache arithmetic,
the 24 GB budget reconciliation and its counterfactuals, the per-layer verification of the attention
and RoPE arrays, and the re-tally of the comparison table are mine and are computed from the
published config and file sizes. All four interactives are mine.