2026-09-22 · 18 min · kv-cache · quantization · inference-optimization · long-context · sglang · llm · explainer
The KV cache decides how many requests fit on a GPU, so every byte you take out of it is concurrency you get back. FP8 is settled practice. Four bits is not, because the quantization error roughly quadruples and the cache is the one tensor you cannot calibrate — new tokens arrive at serving time and there is no sample set.
The SGLang, Qwen and NVIDIA teams
shipped it anyway, behind --kv-cache-dtype nvfp4, with four claims:
- NVFP4 KV stores in ~56% of FP8's per-token footprint,
- which is ~1.78× more context in the same memory,
- decode throughput +37% / +58% / +78% at 32K / 160K / 1M,
- and accuracy near-lossless, matching FP8 on GPQA-Diamond and AIME 2025.
One thing to fix before anything else: those are not all about the same model. The throughput numbers are Qwen3.8-27B on one RTX PRO 6000 Blackwell at TP1. The accuracy headline is Qwen3.5-397B-A17B on eight of them at TP8 — and the 27B, measured on the same benchmarks in the same post, does slightly worse.
The first claim is exact and better than it looks. The second is arithmetic that the published experiment does not test. The third is two effects added together and the post separates them itself. The fourth is a claim about two benchmarks with 60 and 396 samples.
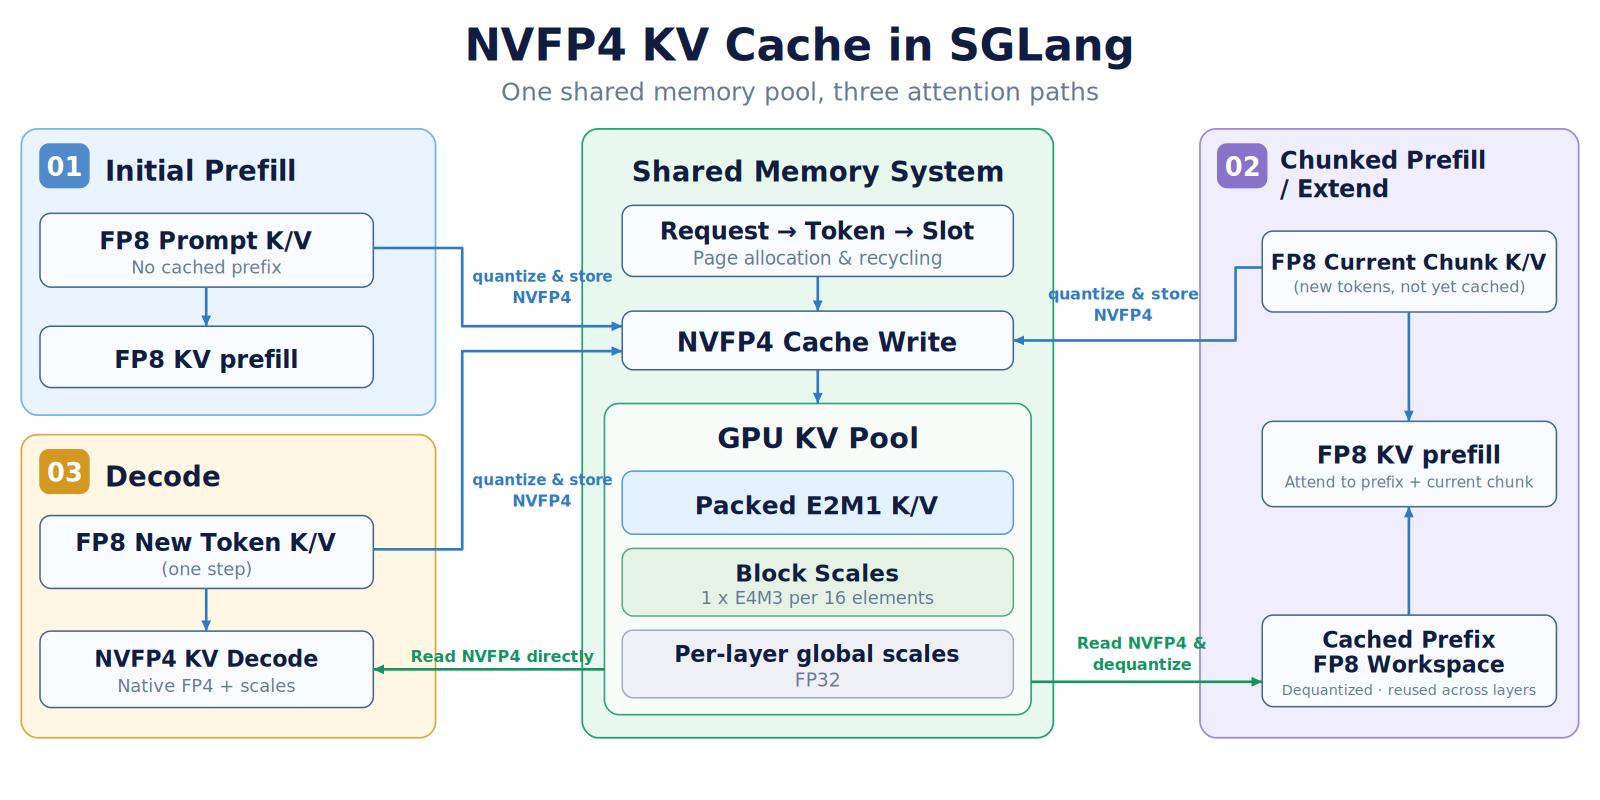
The 56% survives its own scale, and names the block size
NVFP4 is the format Nemotron trains in: a 4-bit E2M1 element, an FP8 E4M3 scale shared across a block, and an FP32 scale for the whole tensor. The post's arithmetic is written as — nine bytes of packed data and block scale per sixteen values, against FP8's sixteen.
Per element that is
for a block size . Which means the ratio is not a number you have to accept on faith. Set it equal to 0.5625 and solve, and falls out. The published figure is tight enough to identify the block geometry that produced it.
(4 + 8/B) / 8 = 0.5625 and you get B = 16, with no need to take it on trust. What the number genuinely excludes, in the post’s own words, is “the small global-scale metadata and other pool or workspace overheads”, and it assumes the FP8 baseline carries no per-block scale of its own.So: the block-scale overhead is counted. It is half a bit per element, it is
inside the 0.5625, and there is nothing hidden. What the number does exclude, in
the post's own sentence, is "the small global-scale metadata and other pool or
workspace overheads" — and one thing the post does not say, which matters if you
are comparing against your own stack: it assumes the FP8 baseline is per-tensor
scaled. If your FP8 KV carries its own per-block scale, the denominator moves and
NVFP4's advantage shrinks. As far as the flag and the kernel description go,
SGLang's fp8_e4m3 KV is per-tensor scaled, which makes the comparison here a fair
one.
For the model actually benchmarked, Qwen3.8-27B, that is 32 KiB a token down to 18, so 14 KiB a token back:
| Per token, Qwen3.8-27B | bytes |
|---|---|
| 16 full-attention layers × 4 KV heads × head dim 256 × (K and V) | 32,768 elements |
| FP8 | 32,768 B = 32.00 KiB |
| NVFP4, block 16 | 18,432 B = 18.00 KiB |
Note the first row. Qwen3.8-27B has 64 layers, of which 16 are full attention and 48 are gated DeltaNet. The linear layers hold a fixed-size recurrent state, not a cache that grows per token, and NVFP4 KV does not touch them. Three quarters of this model's layers are outside the scope of the flag entirely — which is worth knowing before you extrapolate the result to a dense model, where the same flag would shrink four times as much state. Those same linear layers bite from the other direction on the 2.4T sibling, where their fixed state sets the page size for the attention layers and takes 37.5% of every request regardless of prompt length.
The 1.78× is arithmetic, and the experiment does not reach it
1 / 0.5625 = 1.7778. That step is unarguable as a statement about the cache pool. The interesting question is what happens when the pool is a fraction of a GPU with weights, workspace and page rounding in the way — and the post publishes three points that look like an answer.
They are not an answer, and the reason is in the table's own first column.
At 32K the benchmark requested 70 concurrent requests and NVFP4 achieved exactly 70. The run admitted every request it was offered; it never met the cache limit. At 160K it requested 16 and NVFP4 achieved 15. At 1M the choice was between one resident request and two.
So the iso-capacity experiment measures how far short FP8 falls of the offered load, which is a real and useful thing to know, and it does not measure NVFP4's ceiling anywhere. The 1.59× and 1.50× are lower bounds set by the client, not upper bounds set by the memory. The 2.00× at 1M is granularity.
The post is not claiming otherwise — it says plainly that "actual usable capacity is workload- and configuration-dependent" and calls 1.78× "an idealized capacity ratio". The number that gets quoted will be 1.78× regardless, so it is worth saying where it has and has not been checked.
One real cost the post does record: at the 1M point, NVFP4 had to run with
--mem-fraction-static 0.75 against FP8's 0.90, "to leave room for temporary
prefill workspace". That is 15% of the GPU handed back at the extreme, and it
comes out of the same budget the format was supposed to free.
The decode gain, separated
Two numbers are doing different jobs and the post is careful to split them, which is more than most:
| Qwen3.8-27B, 1× RTX PRO 6000 Blackwell, TP1, OSL 1,024 | 32K | 160K | 1M |
|---|---|---|---|
| Iso-concurrency — same batch, fewer bytes read | +26–30% | +26–30% | +26–30% |
| Iso-capacity — bigger batch as well | +37.37% | +57.75% | +78.46% |
| Achieved concurrency, FP8 → NVFP4 | 44 → 70 | 10 → 15 | 1 → 2 |
The iso-concurrency row is the clean measurement. Same peak batch, same work, 44% fewer KV bytes to read per decode step, 26–30% more throughput. That is a mechanism, and it is the one that transfers to your deployment.
The iso-capacity row adds "and we also ran a bigger batch", which is only available if your offered load has requests waiting. At 1M, +78.46% is one request becoming two.
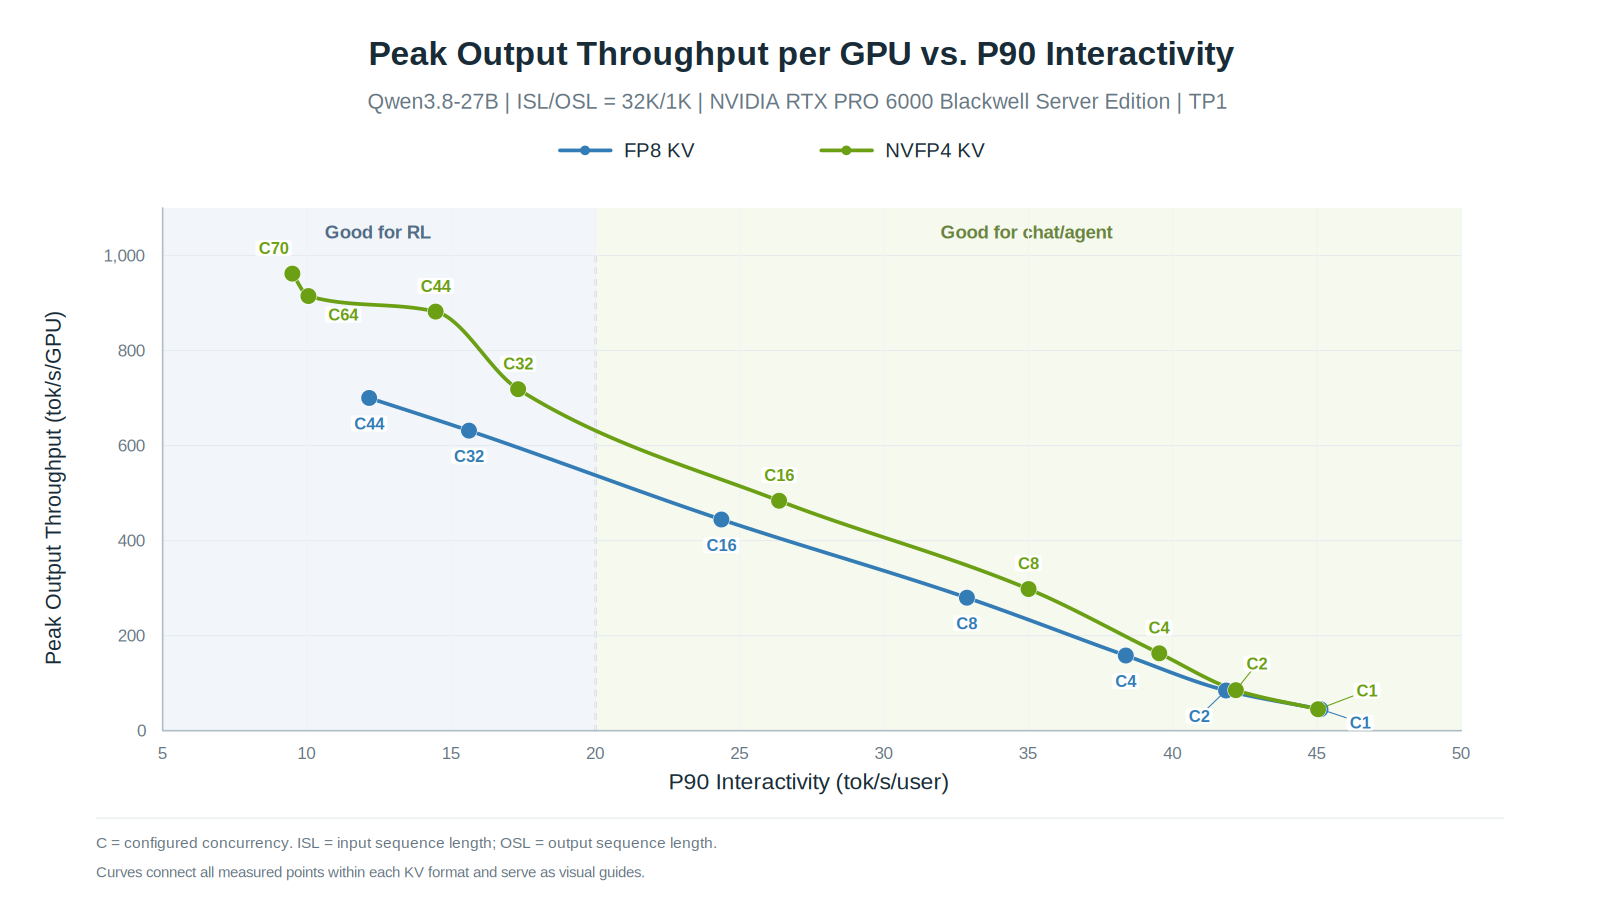
That figure is worth more than the percentage table, because it makes the denominator visible: a 27B model on one Blackwell card decodes at about 45 tokens a second for a single user, and about 960 tokens a second in total at 70 users. Both numbers are true, neither is the other, and any quoted "TPS" belongs to one of the two regimes.
Prefill gets nothing, as it must — the compute dtype does not change, and both prefill paths route through an FP8 workspace. TTFT rose 0.20–0.40% at matched concurrency. The post then adds the sentence that should travel with every decode benchmark:
"Near-lossless" is narrower than it sounds, in both directions
The accuracy claim in the brief — matching FP8 on GPQA-Diamond and AIME 2025 for Qwen3.5-397B-A17B — is accurate. It is also two benchmarks with 396 and 60 samples, and the post runs two models, not one.
For two runs scoring the same items at roughly rate , the gap's standard deviation under "no difference" is . Run that on each benchmark in the post and every measured gap lands inside its own noise band, the largest being SWE-bench Verified at 0.60σ.
That cuts both ways and the second way is the one people miss. Identical AIME counts over 60 samples is exactly what you would see if 4-bit KV cost two full points; the benchmark cannot resolve it. The only benchmark here with sub-point resolution is GSM8K at n = 1,311, and GSM8K at 96% is close to saturated.
The larger model was less sensitive. The post declines to generalise from that, correctly: "two models and a small set of tasks do not establish a general relationship between model size and quantization tolerance."
And one caveat runs the other way — this is a deliberately weakened NVFP4:
The global scale is the outer term in NVFP4's two-level scheme, and dropping it means the E4M3 block scale carries the whole dynamic range on its own three mantissa bits. So the measured accuracy is a floor, not a ceiling, and the post lists calibration as ongoing work.
The agentic result is the one with a mechanism
The long-context throughput numbers are a bandwidth story. The agentic result is a cache-hit story, and it is more interesting because the failure it prevents is recomputation rather than slow reading.
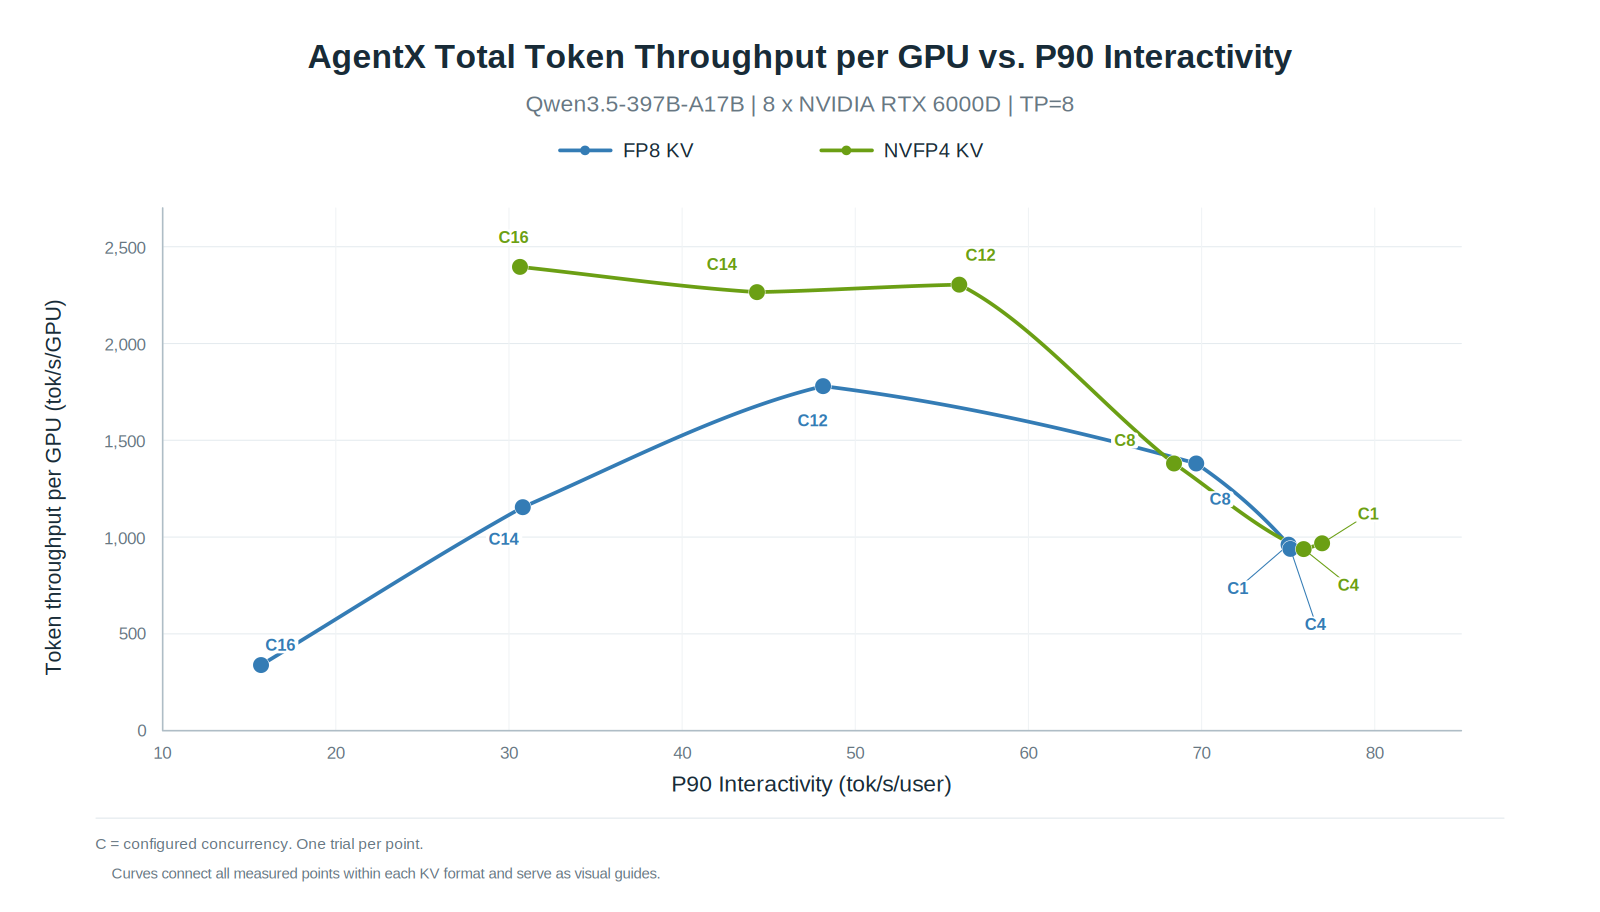
This is the argument for 4-bit KV that does not depend on bandwidth at all. An agent session's value is its history; if the history gets evicted, the next turn pays a full prefill for context the GPU had a moment ago. Halving the footprint keeps more prefixes resident, and the post's cache-rate figure shows FP8's hit rate falling away exactly where its throughput does.
The measurement is one trial per concurrency point on a single harness
(SemiAnalysis AgentX, the semianalysis_cc_traces_weka_062126_256k trace set), so
the shape is the finding and the numbers are not repeats. It is still the most
decision-relevant result in the post, because it is the one where a 1.78×
capacity ratio — even an unverified one — buys a discrete outcome rather than a
percentage.
Against what this site already established
Two earlier pieces set up the space this lands in, and it disagrees with one of them in an interesting way.
Nemotron in NVFP4 established the format: E2M1 elements, an E4M3 scale per 16, an FP32 tensor scale, and the observation that two-level scaling gives a 4-bit element roughly ten bits of effective dynamic range. That was NVFP4 applied to weights, which are static, calibrated once, and quantized offline. This is the same format applied to the cache, where every block is written once at serving time from data nobody has seen. Same bits, completely different problem.
TurboQuant argued that the online problem has a specific answer: rotate every vector by an orthogonal matrix before you quantize it, because that provably spreads its energy across all coordinates and leaves no outliers to clip, with no calibration set required.
SGLang's recipe does not rotate. It relies on a small block — 16 elements with their own scale — to localise outliers instead. That is a legitimate alternative: a per-16 scale bounds the damage an outlier does to its own block, where a per-tensor scale would let it wreck the whole layer.
What makes this worth noting is that the other 4-bit KV cache shipped this
month does rotate. Cinference's k8v4 — FP8 keys, 4-bit
values, on one RTX 5090 — states it in its kernel header: "Both operands receive
the fixed FP32 D256 Hadamard rotation." Two production engines, the same month,
the same 4-bit target, opposite answers to TurboQuant's question. And a second
disagreement underneath it: SGLang quantizes keys and values alike, cinference
spends twice the bits on keys.
Neither project has published the head-to-head, and neither could easily — they run different models on different cards. But this is the cleanest natural experiment in 4-bit KV that anyone has set up, and it is one afternoon's work for someone with both.
What I would take away
- When a compression ratio is quoted to four digits, solve for the geometry. 0.5625 identifies a block size of 16 uniquely. Ratios that do not pin down their own parameters are usually hiding an uncounted scale.
- "1.78× more context" is a property of the pool, not of the GPU. Weights do not shrink, workspace does not shrink, and at the 1M point the NVFP4 run had to hand 15% of the card back to prefill scratch.
- Check whether the benchmark hit its own ceiling. Requested 70, achieved 70 is not a capacity measurement. This is the single most common way a serving benchmark quietly measures the client.
- Compute the resolving power before you believe "lossless". Sixty AIME samples cannot see a two-point regression. Publishing the count rather than the percentage — as this post does for SWE-bench, 381 against 389 — is what makes that check possible at all, and more posts should.
Related reading: the format; why you rotate before you quantize; the other 4-bit KV cache that shipped this month; SGLang's radix tree, which is the prefix cache whose hit rate the agentic result turns on; and what prefill and decode actually cost.
What would change my mind
6 claims above, and what would falsify each
The 56.25% ratio already includes the block scale, and it identifies a block size of 16.
Solve ; the only root is , and the post's own is the same statement in bytes. This breaks if the scale is not 8 bits — a 16-bit block scale at gives 4.5 bits per element too, and would read as the same ratio. The post says E4M3 explicitly and the kernel section names
cvt.rn.bf16x2.e2m1x2and E4M3 block scales, so I am confident, but the ratio alone does not exclude that alias.None of the three iso-capacity points measures the 1.78x capacity ratio, because the NVFP4 run hit the offered concurrency instead.
The post's own table: requested 70 / 16 / 2, NVFP4 achieved 70 / 15 / 2. Rerun the 32K point with the client asking for 128 and see where NVFP4 tops out. If it stops at 70 anyway, it was cache-limited and I have misread "requested" as offered load rather than as a scheduler cap — in which case 1.59× is a real measurement and the shortfall against 1.78× needs the explanation I did not give.
Every accuracy gap in the post is inside its own benchmark's sampling noise.
on the post's stated sample sizes: 0.77 points for GSM8K at n = 1,311, 2.84 for GPQA-Diamond at 396, 2.36 for AIME at 60, 2.66 for SWE-bench Verified at 500. The largest observed gap, SWE-bench's 1.60, is 0.60σ. This treats the two runs as independent binomials, which understates precision when the same items are scored by both — a paired test on per-item outcomes would be tighter, possibly a lot tighter, and the post does not publish per-item results. If someone releases them, the paired analysis is the right one and could well turn the SWE-bench gap significant.
NVFP4 KV only shrinks 16 of Qwen3.8-27B's 64 layers, because 48 are gated DeltaNet.
The geometry is published in NInfer's
docs/maintainer/qwen3_5-model.md(64 text layers, 16 full attention / 48 GDN, 4 KV heads, head dim 256) for the same Qwen3.8-27B artifact. SGLang's own limitation note says it supports "GQA models and Sparse MLA models", which is consistent. If SGLang stores the GDN recurrent state in the same quantized pool — it does not, as far as I can tell from the flag's description — then the flag's reach is wider than I have said and the per-token figures here are too small.SGLang's NVFP4 KV does not rotate before quantizing, while cinference's k8v4 does.
The post's kernel section describes loading packed tiles and E4M3 block scales, unpacking with
cvt.rn.bf16x2.e2m1x2, and applying scales — no rotation anywhere, and a Hadamard would have to appear on the write path too. Cinference states its rotation insrc/ops/kv_cache/append/k8v4_kernel.cuh:3. If SGLang's write path applies a transform the blog does not mention, this comparison collapses; the way to check is the quantization kernel in the SGLang tree at commitc8b56b1, which I read the blog's description of rather than the source.The agentic throughput cliff is a prefix-cache eviction effect rather than a bandwidth effect.
The post pairs the throughput figure with a cache-hit-rate figure showing FP8's input-token cache rate collapsing at the same concurrency. That is strong circumstantial evidence and it is one trial per point. Re-run the sweep with
--disable-radix-cacheon both formats: if FP8 still falls off a cliff at C > 12 with no prefix cache to lose, the mechanism is something else — scheduler thrashing or memory pressure on the prefill workspace — and the "keep more prefixes resident" story is the wrong one.
Read from the LMSYS post of 16 September 2026, its appendix reproduction commands
and the four figures published with it. The benchmarks pin
sgl-project/sglang at commit
c8b56b1f44d5c5370f47470ee490da3b04375e1c and the SemiAnalysis AgentX harness at
56a0cf7. The per-token byte counts and the noise bands are computed here from the
published geometry and sample sizes; I have no Blackwell card and ran nothing.