2026-10-06 · 46 min · webgpu · systems · gpu · explainer
A video went round this week of someone playing Grand Theft Auto V in Chrome on an M3 Pro, at playgta5.com. The replies split three ways: it is cloud gaming, it is an Xbox 360 emulator, or it cannot be real. The most common follow-up was how a game of 100 GB or more fits in the "700 MB" the tab downloaded.
It is real, it is none of the first two, and nothing was compressed to 700 MB. I opened the site, downloaded every file it serves, read all of its JavaScript, pulled sample game files apart byte by byte, and ran the game headless on a 16-core server with no GPU. This is what is in the tab, piece by piece, with the code.
| What runs | Rockstar's RAGE engine and GTA V's game code, compiled to WebAssembly (wasm64, shared memory, 75 threads) |
| Engine binary | game.wasm, 63,201,802 bytes; about 91,000 functions, all still named |
| Graphics | Direct3D 11 calls recorded into a 32 MB ring as 48 opcodes, replayed on WebGPU by a worker |
| Shaders | 4,919 compiled DXBC shaders translated offline to WGSL; 4,808 usable; 72 MB in 18 packs |
| Game data | 5,814 files, 20.9 GB, of which 1,528 .rpf archives are 20.3 GB; streamed, never downloaded whole |
| Storage | HTTP Range requests in 4 KB blocks into an append-only store in the Origin Private File System |
| What a session downloads | a recorded 582 MB boot set, then the blocks the world needs: 743 MB in all, in my run |
| My run (measured) | world on screen at 188 s, 0.3 fps on SwiftShader (a CPU), 2,736 draw calls per frame |
One caveat before the engineering, because it shapes everything else: the binary was built from GTA V's own C++ source, and the 20.9 GB the site serves is Rockstar's game data. Neither is licensed for this. I come back to where they almost certainly came from near the end.
What you see
The page opens on GTA V's loading screen: the character art, the logo, sliding in on a tilted 3D plane. This is not a video. It is the game's Scaleform loading movie, LOADINGSCREEN_STARTUP, decompiled from its ActionScript and rebuilt in HTML and CSS: the same 55-degree camera, the same six random orders of 17 screens, a new screen every 14 seconds. The page says so in a comment, down to the font ($Font2 = Chalet London 1960). The art, logo and font are the game's own, extracted by a script the comments call phase3/make_title.py.
Bottom right, a menu offers Story Mode (continue the newest savegame, or the Prologue with ?newgame=1) and Sandbox Mode, which asks for a map: GTA V Map (free roam at a random spot with every weapon) or a second map the page labels "GTA VI Map". That one is the env_test level in the data. You can change your mind until the engine reads its -level argument, about 62% of the way into the load. If you have not chosen by then, the engine waits and the key caps pulse.
![The GTA V loading screen in a browser: Michael counting money in front of the Vinewood hills, the GTA V logo bottom left, and at the bottom right the buttons 'Sandbox Mode SPACE', 'Story Mode ENTER' and 'Mounting archives 24%'. A small log line at the bottom reads '[file] Root folder /game/'.](/articles/gta5-in-the-browser/mode-chooser.jpg)
Under the art, the progress bar is fed by the engine's own log. The port does not modify the engine to report progress. It matches nine regular expressions against the lines RAGE always printed, in prejs.js (the porter's code at the top of game.js):
const stages = [
  [/^Audio rpf =/, 24, "Mounting archives"],
  [/Using Settings/, 38, "Reading settings"],
  [/created D3D11/, 45, "Starting graphics"],
  [/CShaderLib::Init/, 50, "Loading shaders"],
  [/LOAD_ADDITIONAL_TEXT - finished/, 56, "Loading text"],
  [/Starting audio thread/, 62, "Starting audio"],
  [/Loading singleplayer metadata/, 66, "Loading audio metadata"],
  [/^Loading SRL file/, 72, "Starting scripts"],
  [/Removing prologue IPL light groups/, 84, "Loading the world"],
];
The first 20% is the engine download, 76% is the first frame the GPU worker presents, and 72-98% follows the game data that arrives. The title screen drops only when 1.5 s of frames go by with no draw call waiting for a pipeline to compile. "Loaded" is defined by the shader compiler, not the engine.
I ran it with ?mode=sandbox. The timeline, from my log (measured, on a server in a data centre, through a Cloudflare edge in Mumbai, with eight other jobs on the machine):
| Time | Stage | Game data fetched |
|---|---|---|
| 24.6 s | engine downloaded and compiled, main() starts | 0 |
| 39.5 s | mounting archives | (boot set prefetch running) |
| 54.6 s | starting graphics | 223 MB |
| 69.7 s | first frame | 454 MB |
| 176.2 s | preparing shaders | 743 MB |
| 188.1 s | world shown | 743 MB |
Your laptop will compile faster and render far faster. It will not fetch much faster, for a reason the storage section explains.
What the site actually ships
Before reading any of it, the inventory. Everything is served from one host behind Cloudflare. The engine files live under a build-specific prefix (/b/8b0b5899ed/) and are cached for a year; the game data lives under /data/ with ?v=<manifest version> on every URL, so the same URL always means the same bytes.
| File | Size | What it is |
|---|---|---|
index.html | 44 KB | the page: title screen, start menu, input, audio start-up, low-memory profile, engine command line |
loader.js | 9 KB | a worker that becomes the engine's "main thread"; starts the GPU and IO workers; streams and compiles the wasm |
game.js | 124 KB | Emscripten's glue plus the porter's prejs.js (logging, progress, crash reports) and 13 JS imports; runs in every thread |
game.wasm | 63 MB | the engine: RAGE and GTA V, compiled to wasm64 |
wgpu_worker.js | 194 KB | the GPU worker: replays Direct3D 11 commands on WebGPU |
io_worker.js | 41 KB | the IO worker: serves every engine file read from HTTP and a disk store |
audio-worklet.js | 1.5 KB | plays the engine's mixer output |
shaders/index.json | 686 KB | 4,919 shaders: hash to stage, effect, program, pack and offset |
shaders/pack0..17.*.bin | 18 × ~4.2 MB | the translated WGSL, bundled by effect |
shaders/pipelines.json | 359 KB | 720 render-pipeline recipes to compile ahead (223 KB, 425 recipes, for the low profile) |
data/manifest.json | 393 KB | the game folder: 5,814 paths, sizes and dates |
data/bootset.json | 193 KB | the byte ranges the engine reads while booting: 2,918 files, 582 MB |
data/** | 20.9 GB | the game files themselves |
The JavaScript is unminified (except game.js) and commented like a lab notebook. Comments name the porter's own tools (phase3/make_shader_pack.py, pipeline_seed.py, record_bootset.py, a PHP host at phase3/host/index.php), the C++ files on the other side of each interface (wgpu_backend.cpp, httpfs_wasm.cpp, userdata_wasm.cpp, browser_input_wasm.cpp), and measurements with dates. Several are dated 6 October, the day 10,000 visitors overloaded the host. The GPU worker even runs unchanged under Node with Google's Dawn, which is how the porter takes headless screenshots on a Windows dev box (D:/wasm_build/... in a default path).
It is the real engine, not an emulator
An emulator would ship a console's CPU interpreter and a disc image. Cloud gaming would ship a video decoder and a WebRTC connection. This site ships neither. I parsed game.wasm's sections without running it:
| Section | Size |
|---|---|
| code | 48.2 MB |
| data | 7.8 MB |
name (function names) | 6.8 MB |
| functions defined | 91,026 |
| imports | 86 |
The name section is the giveaway. It was left in, and it lists 91,111 function names. 41,286 of them contain rage::, the namespace of Rockstar's RAGE engine. The rest read like a tour of the game: 1,865 handlers in network_commands, 1,606 in vehicle_commands, 1,392 in ped_commands, 1,162 in hud_commands. Those are the native functions GTA V's mission scripts call. The audio code includes rage::audDecoderPcm, rage::audDecoderAdpcm and rage::audDecoderOpus. A namespace called wasm_null_d3d is the port's own, and comes up in the graphics section.
The strings agree. Assertion messages carry the build machine's source paths, for example E:/P1/GTA5/SRC/DEV_NG\RAGE\BASE\SRC\net/status.h. DEV_NG is the next-gen branch, the one the PC version came from.
So the port was built from C++ source, by a compiler, not by translating machine code. And it was a development build:
- the engine starts a thread called
BugstarAssertLogging(Bugstar is Rockstar's internal bug tracker); - the page notes that "this build has debug key bindings", and in the
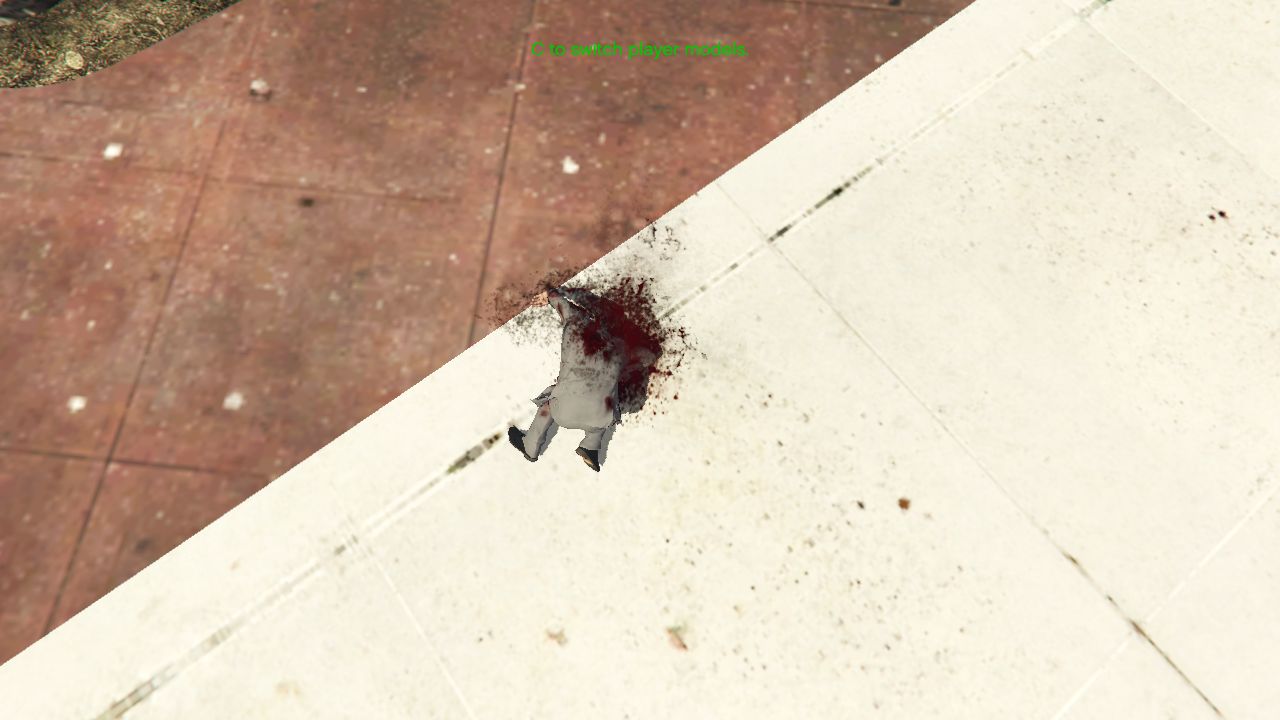
env_testmap a green debug prompt reads "C to switch player models"; - it passes
-fastscriptcore, because without it "this build runs the debugging core, which looks up two breakpoint tables for every script instruction (scrThread::Run was ~8 % of the main thread)".
The memory is the other tell. The module imports one memory with flags 0x7: it has a maximum, it is shared between threads, and it is 64-bit. Minimum 49,152 pages, maximum 262,144; at 64 KB a page, that is a 3 GB starting heap and a 16 GB ceiling. game.js creates it like this:
var INITIAL_MEMORY = 3221225472;
wasmMemory = new WebAssembly.Memory({ initial: BigInt(INITIAL_MEMORY / 65536), maximum: 262144n,
                                      shared: true, address: "i64" });
Classic 32-bit WebAssembly stops at 4 GB, and a 2013 PC game sized for 8 GB machines does not fit in that. In my run, once the world was up, the engine reported a 2,444 MB malloc arena with 2,405 MB of it in use. Every pointer crosses into JavaScript as a BigInt, and every address is above 3 GB, which caused one of the port's best bugs (see "Graphics").
The game folder
The manifest is a complete listing of the folder the engine sees as /game/. Explore it: the bar is each folder's share of its parent, and the green part is what the recorded boot set reads before the world appears.
data/manifest.json and data/bootset.json. Grey: the folder's share of its parent. Green: the part the boot read set fetches before the world is up. Below the ten largest entries of a folder, the rest are lumped into one row.The prose version of the tree:
| Folder | Size | Files | What it holds |
|---|---|---|---|
x64/levels/gta5 | 8.68 GB | 1,383 | the GTA V map: _hills 3.95 GB, _citye 1.16 GB, _cityw 0.93 GB, _prologue 0.44 GB, scripts 0.43 GB, vehicles 0.34 GB, interiors, props, navmeshes |
x64/levels/env_test | 5.49 GB | 259 | the second map the page calls "GTA VI Map": countryside, co1, sb, sn, nb, dn and 30-odd more blocks |
x64/models/cdimages | 2.50 GB | 40 | characters: streamedpeds_players.rpf alone is 532 MB |
x64/audio/sfx | 1.88 GB | 54 | sound banks: interactive music 472 MB, cutscene audio 153 MB, 19 radio station banks at 7-52 MB each |
x64/anim | 0.84 GB | cutscene and in-game animation | |
x64/dlcPacks | 0.58 GB | 11 packs (see below) | |
common/shaders | 0.32 GB | 1,134 | compiled effects in three variants: win32_40, win32_40_lq, win32_nvstereo |
common/data | 0.22 GB | XML and metadata: AI, timecycles, glass, scripts, paths | |
common/non_final | 0.04 GB | cutscene lighting tunes (.lightxml) and animation data |
By type, 1,528 .rpf archives are 20.30 GB of the 20.94 GB. Then come 1,134 .fxc shader effects (316 MB), 990 .xml files (174 MB, one of them a 145 MB paths.xml), 493 .lightxml, 470 .ymt, 376 .meta, 146 .dat and 65 .ytd texture dictionaries.
What the files are, from samples
I fetched a few sample files with Range requests and read their headers. Nothing was decrypted.
.rpfarchives are encrypted.x64/levels/gta5/vehicles.rpfstarts37 46 50 52(RPF7): 953 entries, encryption tag0x0FFFFFF9. That tag marks a table of contents encrypted with Rockstar's AES key, exactly as on a retail PC install. The archives are served byte for byte as Rockstar packed them. The browser engine decrypts them itself, with the keys compiled into it. The port did not repack or recompress anything.- Loose resources are deflate-compressed.
x64/models/skydome.ydd(a drawable dictionary) startsRSC7, resource version 165. Its 10,941 bytes inflate with raw deflate to 32,768 bytes, exactly the virtual size its page flags declare.x64/textures/graphics.ytdisRSC7version 13, a texture dictionary. - Shaders are Rage effects.
common/shaders/win32_40/postfx.fxcstartsrgxeand lists its programs by name (VS_Passthrough,dofProj,dofShear...). The DXBC bytecode inside is what the port translated to WGSL. - Metadata is binary PSO.
x64/data/metadata/statsmgr.ymtstartsPSIN. - Audio is Opus-class.
x64/audio/tracks/admin_gun.awcstartsADAT, a multichannel stream: two channels at 48,000 Hz, 4,713,599 samples each (98.2 s), in 16 blocks of 32,768 bytes, with codec id 12. That is 98 seconds of stereo music in 512 KB, about 43 kb/s. 16-bit PCM would be 1,536 kb/s and ADPCM about 384 kb/s. The engine carries an Opus decoder (rage::audDecoderOpus), and the bitrate is Opus territory. I have not confirmed the codec id mapping, so treat "Opus" as very likely, not proven. - The data is dated.
x64/metadata.datbeginsMETA2015-02-06T19:40:44: a build from February 2015, two months before the PC release. And the 145 MBcommon/data/levels/gta5/paths.xmlis a raw export from 3ds Max, with the artist'sx:/gta5/art/...source path and a timestamp of 31 July 2014. That is not the kind of file a retail game ships.
How 100 GB becomes "700 MB"
It does not. Two separate questions are folded into that number.
Why 20.9 GB, not 100 GB? The PC version shipped at 65 GB in 2015 (reported, seven discs) and has grown since with years of GTA Online updates. This folder is a development snapshot from February 2015, and the manifest shows what it leaves out:
- DLC: 11 packs, 0.58 GB in all:
mpBeach,mpBusiness,mpBusiness2,mpChristmas,mpHipster,mpIndependence,mpLTS,mpPilot,mpValentines,spUpgradeandverityRadio. That is roughly the content through mid-2014, and none of the GTA Online updates that followed. - Video: zero
.bikfiles. The engine's Bink video thread is one of the threads the port does not start. - Audio: the whole
x64/audiotree is 1.93 GB, and the one music track I decoded runs at about 43 kb/s. - Extra: the folder adds
env_test, 5.49 GB that retail does not have, so GTA V's own content here is about 15.4 GB.
I have not diffed it against a retail install, so I cannot say file by file what is smaller and why. What is clear is that this is not the retail game repacked.
Why "700 MB"? Because a session never downloads the 20.9 GB. It downloads the blocks the engine reads, 4 KB at a time. In my run that was 743 MB before the world appeared: 3.5% of the folder (reasoned from the two measured numbers). Most of it is the boot set, which I could break down from bootset.json:
| Part of the boot set | Bytes | Why |
|---|---|---|
.rpf archives | 433 MB | 997 of the 1,192 archives it touches are read for under 64 KB each: their headers and tables of contents |
.fxc shader effects | 100 MB | 349 of the 379 win32_40 effects, fetched whole in compressed batches |
x64/levels/gta5 | 258 MB | the map's archive headers and the start-up area |
x64/models/cdimages | 112 MB | character model archives |
| everything else | the rest | texture dictionaries, metadata, AI data, timecycles |
(The rows overlap: the level and model bytes are mostly .rpf bytes.) The engine mounts about 1,200 archives at boot and reads only each one's table of contents, "median 3 KB, 4.9 MB for all of them" according to the IO worker's comments. After the boot set, the world needs "about 1.2-1.4 GB the first time" per the page's comments. In my run, at the spawn point I got, it needed far less. Walk or drive somewhere new and more streams in.
Start-up: who runs where
A game engine assumes it owns its threads. It blocks on mutexes, sleeps, spins and waits for the GPU. A browser's main thread may do none of that. So the page does almost nothing, and the engine runs entirely in workers.
- The page (
index.html) transfers the canvas to anOffscreenCanvas, decides on the low-memory profile, builds the engine's command line, and startsloader.jsin a worker. It keeps only input, audio start-up and the title screen. loader.jscreates the GPU worker and the IO worker first, because "Chrome fetches the script of a worker nested in a worker through the parent's event loop", and this worker's event loop is about to be blocked forever. The IO worker starts prefetching the boot set at once, in parallel with the engine download.loader.jsstreams and compilesgame.wasmwhile it downloads, then callsimportScripts('game.js'). Static constructors andmain()run right there, and the game loop blocks this worker for good, which is fine because nothing else lives on it.- Emscripten pre-spawns a pool of pthread workers:
min(160, 36 + 4 × cores), or 28 at two cores or fewer. Each runs the samegame.jsagainst the same shared memory.
The engine download, from loader.js:
const streaming = async () => {
  const res = await fetchWasm();             // retries 503/500/429 eight times
  const counter = res.clone().body.getReader();  // count bytes on a clone for the progress bar
  ...
  return WebAssembly.instantiateStreaming(res, imports);
};
Streaming compilation means no wait after the download, no second 63 MB copy, and Chrome can cache the compiled code for the next visit.
The command line the page builds, trimmed:
args: ['-rootdir=/game/', '-wgpu', '-nodisplaycalibration', '-noSocialClub', '-pc:nosocialclub',
       '-nonetwork', '-output', '-width=' + w, '-height=' + h, '-forceResolution',
       '-Script_all=warning', '-replay_all=warning', '-fastscriptcore', '-frameLimit=1', ...]
-nonetwork and -noSocialClub remove the online layer. The two log-level flags exist because scripts and replay produce "~87 % of all log lines in play". -frameLimit=1 is a 60 fps cap.
Because the "main" thread is a worker, Emscripten's glue sets can_block = !ENVIRONMENT_IS_WEB, which is true. The engine's main loop can Atomics.wait like any other thread and never returns to an event loop.
Threads it does not start. Of the engine's threads, 75 started in my run and 18 were skipped by the port's thread wrapper: the hang-detect watchdog, Bink video, the TCP and netThrPool network workers, HttpQuery, Bugstar logging, Fwd Thread, Back Thread and six replay-recording threads. ?keep=replay,net,bink,idle brings groups back, as a bit mask the C++ side reads through one of the port's JS imports. The port also has its own hang detector, which prints which thread waits on which semaphore when the engine goes quiet; my logs have several.
The low-memory profile. Devices reporting 4 GB or less (navigator.deviceMemory, which browsers cap at reporting 4 for 4 GB and less) get a lighter game. Every engine thread is a worker of about 20 MB and RAGE sizes its pools from the core count, so the profile tells the engine there are 2 cores, which the page says gives 54 threads instead of 80 to 116. It also quarters texture memory, drops ped and vehicle variety, city density and LOD to minimum, and turns shadows off:
const LOW_ARGS = ['-textureQuality=0', '-pedVariety=0', '-vehicleVariety=0',
  '-shadowQuality=' + (q.get('shadows') === '1' ? 0 : -1), '-reflectionQuality=0',
  '-particleQuality=0', '-grassQuality=0', '-cityDensity=0', '-lodScale=0',
  '-pedLodBias=0', '-vehicleLodBias=0'];
The porter measured it in a Node run: "GPU memory 1.16 GB -> 0.5 GB and streamed assets 1.38 GB -> 0.95 GB". Shadows went because the cascade shadow pass was "a third of all draws (Node, 1366x600: 600-900 of 1,300-2,900 per frame), and a 4-core Chromebook spent ~110 us per draw".
Shared memory: the one rule
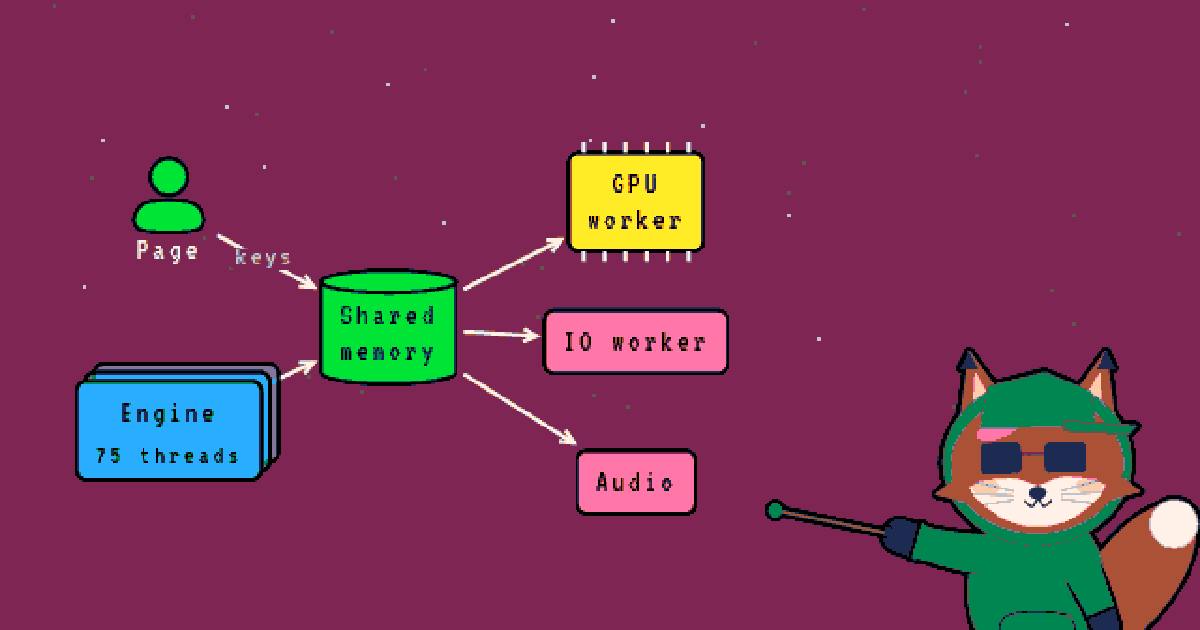
The rule that makes the rest work: engine threads never call a browser API that has to yield. fetch, WebGPU and audio are all asynchronous, and a C++ thread blocked in Atomics.wait never returns to an event loop to receive their callbacks. So JavaScript workers with normal event loops do the asynchronous work, and the engine talks to them only through structures in shared memory.
The engine still talks Direct3D 11, to a null device that records each call as an opcode plus payload words. The GPU worker drains the ring and replays it on WebGPU with shaders translated offline from DXBC to WGSL. Readbacks and fences wait on a word in the ring.
The four handoffs, with their layouts:
- Input: 256 key bytes indexed by Windows virtual-key codes, then int32 words for mouse x and y, deltas, wheel, buttons, focus, pointer lock and a 64-entry text ring. The page writes them with
Atomics.store; the engine reads them like a keyboard driver. - Graphics: a 32 MB ring of commands, a header of 16 words (head, tail, state, counters, a "sleeping" flag), and fence words the engine waits on.
- Files: a table with a doorbell, one 16-word slot per engine thread, and a ring of read hints.
- Audio: a ring of interleaved float stereo samples with write, read, capacity and heartbeat words.
Each worker is the only owner of its browser API, and each handoff is a word in shared memory flipped atomically. The JS imports the port adds to the engine are tiny for that reason. They mostly hand an address to a worker:
function wasm_httpfs_io_start_js(table) {
  if (ENVIRONMENT_IS_PTHREAD || !Module["ioWorker"] || Module["__ioStarted"]) return;
  Module["__ioStarted"] = true;
  Module["ioWorker"].postMessage({ memory: wasmMemory, table: Number(table) });
}
Streaming: a file system made of HTTP requests
The engine's file layer was redirected (platform/file/httpfs_wasm.cpp) so that every read of a file under /game/ becomes a request to the IO worker. First the engine fetches the manifest with a synchronous XMLHttpRequest, so it knows every path and size. Then each read goes through the slot table. Here is one read, end to end, with the IO worker's real code:
The C++ file layer (httpfs_wasm.cpp) owns one 16-word slot per thread in a table in shared memory. It writes the file id, the 64-bit offset, the destination address in the wasm heap and the length, sets the state word to 1 (requested), bumps the doorbell and blocks in Atomics.wait on its slot. It never touches fetch.
// slot i (16 words at 16 + 16*i): [0] state 0 idle / 1 requested /
//   3 taken by this worker / 2 done, [1] file id, [2..3] offset,
//   [4..5] destination address, [6] length, [7] result (bytes or -1)
In prose: the C++ thread fills its slot (file id, 64-bit offset, destination address, length), sets the state to 1, bumps the doorbell and blocks. The IO worker, parked on the doorbell with Atomics.waitAsync, claims the slot with a compare-and-swap from 1 to 3. It works out which 4 KB blocks of the file are missing, fetches only those with Range requests, writes the bytes into its disk store as they arrive, copies them straight into the engine's buffer in the wasm heap, writes the byte count, flips the state to 2 and calls Atomics.notify. The C++ thread wakes up inside what it thinks was an ordinary read().
The store
The store is two files in the Origin Private File System, opened with synchronous access handles, the one storage API in the browser that reads and writes like a file descriptor:
store.binis append-only. A fetch reserves room at the end and streams the body into it.journal.binrecords, after the data has been flushed, where each block went: 16-byte entries of file id, block number and a 64-bit offset. Its header carries the manifest version, so a new game build starts an empty store.
const root = await navigator.storage.getDirectory();
const dir = await root.getDirectoryHandle('gamedata', { create: true });
const s = await (await dir.getFileHandle('store.bin', { create: true })).createSyncAccessHandle();
...
sh.flush();        // the data first, then the entries that point at it
jh.write(new Uint8Array(buf.buffer), { at: journalEnd });
On the next visit, blocks already stored cost nothing. Sync access handles are exclusive, so a second tab runs without the store, on a 48 MB in-memory cache.
The comments record how the IO worker got here, and the dead ends are the useful part:
- Synchronous XHR from each engine thread, behind a service worker that cached blocks. Each response is a fresh
ArrayBuffer, freed only when that worker's garbage collector runs. A worker that lives inside wasm or inAtomics.waitalmost never runs it, so the bytes piled up as "~1.5 GB of renderer memory", and the service worker added "another ~0.9 GB of its own". - 256 KB blocks, then 16 KB blocks with a growing read-ahead. At boot the engine reads only each archive's table of contents (median 3 KB). Big blocks made "the boot download 25x larger for those files".
- Now: 4 KB blocks, streamed into the store with no JavaScript buffers kept, read-ahead only for large sequential reads, and every copy going straight from the store into the shared heap (
sh.read(HEAPU8.subarray(...))).
Why so many requests at once
The host answers a Range request at a few hundred KB/s per stream, whatever the visitor's link: "one stream through the host moves ~0.15 MB/s after its round trip of ~0.6 s (a 512 KB read took 2-5 s, measured)". Throughput tracks the number of streams in flight, not bandwidth. The porter's measurements:
At 128 in flight that is 14.1 MB/s, and the boot set takes about 41 s; at 6 in flight it is 3.4 MB/s and nearly three minutes (reported numbers, my arithmetic). That is why your fibre connection does not make the first load much faster, and why every fetch path in the IO worker is built for parallelism:
- The boot set is fetched in 32 lanes of Range requests plus 4 lanes of compressed batches. Small compressible files (
.fxc,.meta,.xml,.dat,.ymt...) up to 8 MB go whole, up to 300 per POST to/data/batch, and come back gzipped throughDecompressionStream. Because the boot set is the same for every visitor, the host saves each batch as a static file named after the SHA-1 of its request, which Cloudflare can cache. Ranges within 64 blocks of each other are merged. - A blocking read is cut into 128 KB slices fetched side by side at
priority: 'high', so eight slices in parallel finish in about a second where one stream took 2-5 s for 512 KB. - Speculative reads (the boot set, read-ahead, hints) run at
priority: 'low', because "engine reads waited up to 6.6 s behind 32 prefetch streams" before that. - Hints. RAGE's streamer queues reads and performs them one at a time on one thread, which at one round trip each was "~3 reads/s". The port makes it announce queued reads in a ring in shared memory, and the IO worker fetches up to 96 of them ahead (48 more for look-ahead at objects it has requested but not queued yet), so a demand read usually finds its blocks stored or in flight.
- Radio. Radio streams are read as ~33 KB blocks one after another, each a round trip with nothing queued behind it, so
RADIO_*.rpfreads count as sequential and get read-ahead regardless of size.
Failure handling matters at 10,000 visitors a day. Every fetch retries 503, 500 and 429 answers up to 8 times with jittered backoff over about 20 s, because "the engine quits when a data file cannot be read". A file that turns out shorter on the server than the manifest says is shrunk in place, because "the engine retries a failed read forever".
Savegames are separate. When the engine settles a file under /userdata/Documents, the IO worker stores it in IndexedDB (gta5-userdata), not in the OPFS store, which is exclusive to one tab and thrown away when the game data changes. loader.js puts the saves back into the engine's in-memory /userdata before main(), and gives up after 8 s "so a broken IndexedDB cannot keep the game from starting". A failed save is always logged: "a lost save is worth a line".
Graphics: Direct3D 11, replayed on WebGPU
The engine was not rewritten for WebGPU. It still creates a Direct3D 11 device. In this build that device is fake: the function names show wasm_null_d3d::NullDevice, NullContext, NullSwapChain, NullResource and friends implementing D3D11's COM interfaces. Every call becomes an opcode plus payload words in a 32 MB ring in shared memory. wgpu_worker.js is the other end, and its header explains the split:
// Why a separate worker and not calls from the game's render pthread:
//  - WebGPU objects cannot cross threads, but D3D11 resources are created by any engine thread
//    (streaming, main, render). The game threads only emit commands; every WebGPU object lives here.
//  - WebGPU is asynchronous (device creation, mapAsync, onSubmittedWorkDone); this worker has a normal
//    event loop, the game's blocking C++ threads never have to yield to JS. They wait on a futex/fence
//    word in the ring when they need a result (readback, occlusion query).
The ring
Each command is two header words (opcode, payload length) and the payload. There are 48 opcodes, and they are D3D11 almost one for one: CREATE_TEXTURE, CREATE_BUFFER, UPLOAD_BUFFER, UPLOAD_TEXTURE (with the bytes inline in the ring), CREATE_SHADER, CREATE_LAYOUT, CREATE_STATE, CREATE_SRV, CREATE_UAV, SET_SHADER, SET_VERTEX_BUFFERS, SET_INDEX_BUFFER, SET_CBUFFERS, SET_SRVS, SET_SAMPLERS, SET_RENDER_TARGETS, SET_BLEND, SET_DEPTH_STENCIL, SET_RASTER, SET_VIEWPORTS, SET_SCISSORS, DRAW, DISPATCH, CLEAR_RT, CLEAR_DS, CLEAR_UAV, COPY_REGION, COPY_RESOURCE, RESOLVE, GENERATE_MIPS, READBACK, CREATE_QUERY, BEGIN_QUERY, END_QUERY, FENCE, PRESENT, plus WRAP, NOP and a few more. The consumer loop:
async function runCommands(tail, head) {
  while (tail !== head) {
    const base = ringW + (tail >> 2);
    const op = u32[base], n = u32[base + 1];
    if (op === OP.WRAP) { tail = RING_DATA; continue; }
    switch (op) {   // numeric labels: V8 compiles constant Smi cases to a jump table
      ...
    }
    tail += n * 4 + 8;
    if (++sinceYield >= 512) {
      Atomics.store(i32, ringW + 1, tail);   // let the producers reuse the ring space already consumed
      Atomics.notify(i32, ringW + 1);
      if (performance.now() - lastYieldT >= 2) { await yieldTask(); refreshViews(); ... }
    }
  }
  return tail;
}
When the ring is empty the worker sets a "sleeping" flag (header word 5), re-reads the head so a command published in between is not missed, and sleeps on Atomics.waitAsync(head, tail, 100). Producers notify only while that flag is set. When the ring is full, the engine threads block on the tail word, and the C++ side counts that time as "ring full".
Two bugs from this loop are worth retelling:
- The 25 fps ceiling. WebGPU's completion callbacks (
onSubmittedWorkDone,mapAsync) arrive as macrotasks. The command loop only awaited already-resolved promises, so under load the event loop never ran and fences completed late: "the engine polled them for ~25 ms per frame (a flat 25 fps with the worker half idle)". The fix,yieldTask(), is aMessageChannelround trip, a cheap macrotask boundary, at most every 2 ms. - Addresses above 2 GB. The heap starts at 3 GB, so every address the engine hands over is above 2 GB, and JavaScript's
>>is a signed 32-bit shift: "every address at or above 2 GB ... became a negative index; event queries (the engine's GPU fences), occlusion queries and readback flags then never completed". Every index is nowMath.floor(addr / 4).
Resources
Objects live in a plain array indexed by id, because ids come from one counter and are never reused, and "a draw looks up ~15 objects, and an element load is several times cheaper than Map.get". Never-reused ids also make every cache below safe: a key that contains an id can never alias a different object.
Formats are mapped from DXGI numbers to WebGPU formats in a table. Block-compressed textures map directly (bc1 through bc7, which needs the texture-compression-bc feature), depth formats map to depth24plus-stencil8 or depth32float(-stencil8), and typeless formats pick what the game most plausibly views them as, with sRGB view formats added. One format has no WebGPU equivalent: A8_UNORM, an alpha-only texture, which is expanded to RGBA8 on upload because "there is no texture swizzle in WebGPU".
Constant buffers never become GPU buffers. They live in a CPU-side shadow array and are copied per draw (below). Uploads to other buffers keep D3D11's semantics: if a draw already recorded in the open encoder still reads a buffer, the encoder is submitted before the write, so "the earlier draw sees the old data". A Map with NO_OVERWRITE, where the game promises those bytes are unused, skips that flush.
Shaders
Rockstar ships compiled DXBC bytecode, not HLSL source. The port translated every shader offline to WGSL and serves them from shaders/index.json, keyed by the FNV-1a 64 hash of the DXBC, bundled into packs by effect so that a browser makes "~20 requests instead of one or two per shader (~6,000 in a session, each a round trip: minutes against a distant host)". I counted the index:
| Stage | Shaders | Translated |
|---|---|---|
| pixel | 3,667 | 3,667 |
| vertex | 1,112 | 1,112 |
| compute | 31 | 29 |
| domain | 71 | 0 |
| geometry | 20 | 0 |
| hull | 18 | 0 |
| total | 4,919 | 4,808 |
That is 72 MB of WGSL in 18 packs, about 4.2 MB each. The zeros are not failures of effort. WebGPU has no geometry, hull or domain stage. The 109 shaders in those stages are tessellation and the geometry-shader paths of instanced shadows (GS_ShadowInstPassThrough in the cloth effects, for example), so those effects fall back to the engine's other paths or go without.
Here is a real one, fetched from pack0 by its offset in the index: the vertex shader VS_PassthroughComposite of the adaptiveDof effect.
diagnostic(off, derivative_uniformity);

var<private> r0 : vec4<f32>;

struct cb10_struct {
  tint_symbol : array<vec4<f32>, 10u>,
}

@group(0u) @binding(7u) var<uniform> cb7_7 : cb10_struct;

var<private> o0 : vec4<f32>;
var<private> o1 : vec4<f32>;

fn main_inner(v0 : vec2<f32>) {
  let v = (v0 * cb7_7.tint_symbol[9u].xy);
  r0 = vec4<f32>(v.xy, r0.zw);
  let v_1 = fma(r0.xy, cb7_7.tint_symbol[7u].xy, cb7_7.tint_symbol[7u].zw);
  o0 = vec4<f32>(v_1.xy, o0.zw);
  o0 = vec4<f32>(o0.xy, vec2<f32>(0.0f, 1.0f));
  o1 = fma(v0, cb7_7.tint_symbol[8u].xy, cb7_7.tint_symbol[8u].zw).xyxy;
}
...
@vertex
fn main(@location(0u) v0 : vec2<f32>) -> tint_symbol_1 {
  main_inner(v0);
  return tint_symbol_1(o0, o1);
}
You can read the translation off it. r0, o0 and o1 are DXBC's temporary and output registers, kept as private variables. The constant buffer is register b7 as an array of vec4s, exactly how DXBC addresses constants. The tint_symbol names are what Tint, the WGSL compiler in Chrome's Dawn, emits, so the WGSL was written out by Tint. The bindings follow a fixed scheme: constant buffers by register, samplers at 16 plus the register, textures at 32 plus the register, UAVs at 160 plus, and their hidden counters at 176 plus. The vertex shader's resources go in group 0 and the pixel shader's in group 1.
At load time the worker rewrites that WGSL once more. D3D11 shaders use up to 7 constant buffers per stage, and WebGPU allows 10 dynamic-offset uniform bindings per pipeline layout across all stages. So every stage's constant buffers are merged into one struct at binding 0:
// Every stage's constant buffers ... are therefore merged into ONE struct bound at binding 0 with
// one dynamic offset: `cbN_x` -> `cbpack_v.cbN_x`. The runtime copies the bound D3D constant buffers
// back to back into the uniform ring, in binding order, one 16-byte aligned block per member.
for (const m of members) out = out.replace(new RegExp('\\b' + m.name + '\\b', 'g'), 'cbpack_v.' + m.name);
const struct = 'struct cbpack_t {\n' + members.map((m) => '  ' + m.name + ' : ' + m.type + ',').join('\n')
  + '\n}\n@group(' + group + 'u) @binding(0u) var<uniform> cbpack_v : cbpack_t;\n';
Each draw then copies the bound constant buffers' shadows into a uniform ring. The copies go into a JavaScript mirror of the ring and reach the GPU as one writeBuffer per 8 MB chunk at the next submit, because "a queue.writeBuffer per draw was ~10 % of the worker's time at 1,700 draws per frame". The ring has three frame slots, so two frames can be in flight; with fewer, Chrome's round trip to the GPU process, "not the work, capped the frame rate".
Where the two APIs disagree
The interesting part of a translation layer is never the happy path. These are the D3D11 behaviours the worker emulates, each with a comment explaining what broke:
- Depth read as colour. D3D11 lets a shader
Loada depth texture as a float texture. WebGPU only binds it asdepth. The worker keeps anr32floatproxy of each such depth texture (orr8uintfor stencil) and refreshes it with a render pass whenever the depth was drawn into. The reverse also exists:SampleCmpon a float texture gets adepth32floatcopy, drawn by a full-screen triangle that writesfrag_depth. - Alpha-to-coverage. GTA's grass shaders rely on D3D's alpha-to-coverage on single-sample targets instead of
clip(). WebGPU only honours it with MSAA, so the worker compiles a variant that insertsif (o0.w < 0.5f) { discard; }. - Occlusion queries. Dawn's D3D12 backend reports occlusion as 0 or 1, but the engine compares the sample count with pixel thresholds like
> 100. A visible query is therefore reported as 65,536 samples: "visibility tests work, partial-visibility fades (flares) saturate". - Reading past a buffer. D3D11 returns zeros past the end of a vertex or index buffer. WebGPU rejects the draw, and "an invalid draw invalidates the whole command buffer: every draw of that submit is lost (seen in play: a frame's 3D vanished while the UI, submitted later, kept drawing over the stale image)". Counts are clamped to what the bound buffers hold. Unbound vertex slots get a 4 KB buffer of zeros.
- Base vertex. D3D's
SV_VertexIDexcludes the draw's base vertex; WebGPU'svertex_indexincludes it. The offset is folded into the vertex buffer binding only for the shaders that read the IDs: 6 read the vertex ID and 93 the instance ID, of about 4,800. - Inter-stage limits. Some GPUs (the comment names a Chromebook's Intel GPU) allow only 16 inter-stage variables, and Dawn's Vulkan backend counts clip distances against them. Shaders for "cables, particles, clouds, the _DOF variants, vehicle parts" wrote location 15 next to a clip distance and failed, so outputs at or above the limit are moved to free low locations in both stages.
nointerpolation. HLSL declares it only on the pixel shader's input; WebGPU requires both stages to agree, so vertex shaders get a variant with@interpolate(flat).- Samplers. Border addressing does not exist in WebGPU and becomes clamp-to-edge; MipLODBias is ignored. Both are counted in an "approximations" report.
Pipelines without holes
A render pipeline compiles on first use, and a synchronous compile makes everything submitted after it wait "tens of ms per pipeline, hundreds of new pipelines when a new area streams in: the hitches". So the worker compiles with createRenderPipelineAsync and skips the draws that need a pipeline still compiling. On a slow machine that showed as white holes: "a 4-core Chromebook: ~250 pipelines for the first view of the world took seconds, 28,000 draws skipped in one second".
The fix is to know the pipelines in advance. Every pipeline is also keyed by a recipe: shader hashes, input layout, strides, topology, the raw blend, depth and raster state words, target formats. The site ships a seed of 720 recipes recorded by the porter's Node harness (pipelines.json). Each browser adds the recipes it meets to IndexedDB (gta-pipelines, up to 6,000). While the game loads and the worker is idle, recipes whose shaders have arrived are compiled ahead, a few at a time. My cold run's log line: "title screen held 19.3 s for compiling pipelines ... compiled ahead 719, used 159, compiled when first drawn 37".
Looking a pipeline up has to be cheap, because it happens whenever any pipeline state changes, which is most draws. The key is a tuple of small integers hashed to a 30-bit number:
let h = n * 0x9e3779b1;
for (let i = 0; i < n; i++) { h = Math.imul(h ^ T[i], 0x85ebca6b); h ^= h >>> 13; }
h &= 0x3fffffff;   // a small integer (Smi): a full 32-bit key would be a heap number,
                   // allocated and hashed as a double on every lookup
The string key it replaced "took ~15 % of the worker". The same treatment went to bind groups, cached by an FNV hash of the resource ids in binding order. String keys "were ~40 % of stageBindGroup", and a fast path revalidates the previous group by comparing a few ids instead of rebuilding. The cache is trimmed to 24,000 groups, because "in a long session that exhausted the descriptor heaps (CreateDescriptorHeap failed with E_OUTOFMEMORY, device lost, black screen)": dead groups whose textures streaming had destroyed were held alive by the cache.
Presenting a frame
Render passes begin only when the set of render targets changes, with loadOp: 'load' everywhere (D3D clears are separate passes). At PRESENT, the game's back buffer is copied onto the canvas by a full-screen triangle, the encoder is submitted, and the worker waits for the frame slot it is about to reuse. Readbacks are submitted immediately rather than at present ("deferring the submit to the present made it wait 50-300 ms") and land directly in the engine's staging memory in the heap, followed by an Atomics.notify.
Input, audio and a 1 ms timer
The smaller pieces are each a place where browser behaviour leaks into a game that never expected a browser.
Input. The page maps DOM key codes to the Windows virtual-key codes the engine expects and writes them into the input block:
addEventListener('keydown', (e) => {
  ...
  const vk = VK[e.code];
  if (vk) Atomics.store(keys, vk, 0x80);
  ...
});
It also aliases I/K/J/L/U/O to the numpad keys GTA uses for aircraft pitch, roll and targeting, because most laptops have no numpad. The mouse uses pointer lock with unadjustedMovement, and wheel deltas are converted to notches because "Chrome reports ~100 px per notch on Windows".
Audio. The engine's mixer writes into a ring; an AudioWorklet copies 128 frames per callback and plays silence on underrun. The whole processor:
process(inputs, outputs) {
  const out = outputs[0], left = out[0], right = out[1] || out[0], n = left.length;
  const read = Atomics.load(this.hdr, 1), write = Atomics.load(this.hdr, 0);
  const avail = (write - read) >>> 0, take = Math.min(avail, n);
  for (let i = 0; i < take; i++) {
    const at = ((read + i) & this.mask) * 2;
    left[i] = this.data[at];
    right[i] = this.data[at + 1];
  }
  for (let i = take; i < n; i++) { left[i] = 0; right[i] = 0; }   // underrun: silence
  Atomics.store(this.hdr, 1, (read + take) | 0);
  return true;
}
It starts only after the first click or key press, because browsers do not allow audio before a gesture.
Timers were the strangest bug. Chrome on Windows rounds every wait with a timeout up to the OS timer tick, 15.6 ms, unless the renderer has a timer under 16 ms pending. The engine's sleeps, its 1 ms event waits and its frame limiter all use Atomics.wait with timeouts. Measured by the porter: "a 1 ms wait takes 15.5 ms; with this timer 2.1 ms", and the limiter "held a 60 fps cap to 37 fps". The fix is one line on the page:
setInterval(() => {}, 1);It does nothing except keep Windows on a fine tick.
Every optimisation, with the porter's numbers
The comments quote a measurement for most changes. Collected in one place:
| Change | What it replaced | Number quoted |
|---|---|---|
uniform copies into a JS mirror, one writeBuffer per chunk | writeBuffer per draw | ~10% of the GPU worker at 1,700 draws per frame |
| pipeline key as an integer tuple, 30-bit hash | string key per lookup | ~15% of the GPU worker |
| bind-group cache by numeric hash | string keys | ~40% of stageBindGroup |
| recycling constant-pack entries in place | ~6 short-lived objects per draw | ~14% of the GPU worker (garbage collection) |
caching GPUBuffer.size in JS | a native getter per draw | ~5% of the GPU worker |
MessageChannel yield in the command loop | awaiting resolved promises only | a flat 25 fps with the worker half idle |
| executed-command counter published every 512 commands | an atomic add per command | measurable at ~25,000 commands per frame |
| recipe compile-ahead | compile at first draw | 28,000 draws skipped in one second on a Chromebook |
| shader packs | one request per shader | ~20 requests instead of ~6,000 |
| 4 KB blocks into OPFS, no JS buffers | sync XHR + service worker cache | ~1.5 GB + ~0.9 GB of renderer memory |
| table-of-contents-sized blocks | 256 KB / 16 KB blocks | boot download 25x larger for those files |
| parallel slices for blocking reads | one stream per read | a 512 KB read took 2-5 s |
| low fetch priority for speculation | equal priority | engine reads waited up to 6.6 s |
| 96 hinted reads in flight | the streamer's one-at-a-time reads | ~3 reads/s |
-fastscriptcore | the debugging script core | ~8% of the main thread |
| script and replay logs at warning level | full logging | ~87% of all log lines |
setInterval(() => {}, 1) on the page | Windows' 15.6 ms timer tick | 60 fps cap held to 37 fps |
| low-memory profile | default settings | GPU memory 1.16 → 0.5 GB |
Read together they say where the time goes in a port like this: not in the GPU, but in JavaScript's per-call overheads, the garbage collector and the event loop. Almost every fix replaces an allocation or a string with an integer, or a round trip with a batch.
The control panel in the URL
The port is debugged in production through query parameters, and they are a good index of what the porter had to measure. The useful ones:
| Parameter | Effect |
|---|---|
mode=story, mode=sandbox, map=env_test, newgame=1 | skip the start menu, start from the Prologue |
low=1 / low=0, shadows=1, cores=N | force or forbid the low-memory profile, keep shadows, fake the core count |
res=WxH, scale=0.75, fixed=1, fps=30 | back-buffer size, render scale, ignore resizes, 30 fps cap |
keep=replay,net,bink,idle | start engine thread groups that are normally skipped |
slots=N, syncpipelines=1, nopack=1, limits=... | frames in flight, synchronous pipelines, one request per shader, a smaller GPU device |
dbg=1 | draw isolation: run only the first N draws of each frame to find the one that paints an artifact |
shot=N, shotrt=1 | screenshots, and a dump of every render target hunting for NaNs |
log=1, console=1, verbose=1, mem=1, trace=1, record=1 | logging, memory reports, a trace of every file read, recording a new boot set |
nocache=1, nohints=1 | no disk store, no read hints |
shotrt=1 has a story of its own: it was built for a Chromebook that rendered the world white, where "the lighting buffer was ~95 % NaN, which displays as white". It scans one frame draw by draw and logs the first shader that introduces a NaN.
What it costs
- Memory. Every engine thread is a Web Worker of about 20 MB, and the heap starts at 3 GB. When a tab runs out it dies with "Aw, Snap!" and cannot say why, so the page runs a watchdog that reports "the device may be out of memory" after 30 s with no progress.
- Draw calls. Every WebGPU call costs "a few microseconds of validation + serialisation", which is why so much of the GPU worker exists to avoid calls. My CPU-rendered frame had 2,736 draws.
- What is missing. Tessellation and geometry shaders, border sampling, partial occlusion, network play, video. Every gap has a comment.
- The host. Comments dated 6 October say 10,000 visitors in a day produced thousands of error responses (503, 500, 429). My second run crashed at "Mounting archives" with
RuntimeError: unreachable, reported by the page's crash handler. The third, reusing the blocks the second had stored, reached theenv_testworld.
Where the source came from
The site does not say, and I cannot prove it. What I can show is what the binary needs: a full C++ source tree for RAGE and GTA V, on Rockstar's own build paths, in a development configuration, with data from a February 2015 build. Rockstar has never published that source.
GTA V's source did leak, twice. Around Christmas 2023, a slice of the material stolen in the September 2022 Rockstar breach went public, and it was reported at the time to contain the full GTA V source, in a form that compiles. In September 2026 a roughly 200 GB archive from the same breach, described as "GTA V source code, debug builds from every platform" plus early GTA 6 development material, began circulating (gtaboom, reported). A development tree with env_test levels, a Bugstar thread and 2014 artist exports is consistent with that material. The "GTA VI Map" label on the menu is the site's, not Rockstar's. I would not read more into it than that env_test is a test level from Rockstar's tree.
The context: ports of a leaked engine
This is not the first port built from that leak, and the previous ones tell you what happens next.
- A Nintendo Switch port. A modder, M0jso, and a group called Paralympics Productions got GTA V running natively on a jailbroken original Switch, by adapting the source that leaked in 2023. It ran below 30 fps without overclocking. After Rockstar updated its modding guidelines to prohibit ports to unsupported platforms, the modder posted them on 20 September with "try me Rockstar". Take-Two sent a cease-and-desist, and on 28 September the group announced it would shut down on 3 October without releasing its code, because doing so would invite a lawsuit (Notebookcheck, reported). A planned Android version was dropped with it.
- Vice City in the browser. In December 2025 DOS Zone hosted a WebAssembly build of reVC, a community reverse-engineering of Vice City's engine (not Rockstar's source), which asked players to supply files from their own copy for the full game. It went viral around 22 December, and on 24 December Take-Two's brand-protection firm filed a DMCA notice citing trademark infringement, unauthorised use of copyrighted material and circumvention of protections (Generation Amiga, reported). Another site relaunched a complete Vice City in September 2026, again on reVC (see the reVC browser repo).
playgta5.com goes further than either. It is not a reverse-engineered engine, and it does not ask you for your own files: it serves a binary compiled from leaked source and 20.9 GB of Rockstar's data to anyone who opens the page. As of 6 October 2026 I could find no press coverage of it, only the viral video. And partway through my last test run, the site's Cloudflare front end started answering this server with "Sorry, you have been blocked". My runs had pulled about 2 GB in many parallel Range requests from a data-centre IP, which is the likely trigger. I did not try to get past it.
Serving all of that to 10,000 people a day is not a gray area. Given what happened to the Switch port a week earlier, I expected the site to be gone soon, and it was: by the evening of 6 October 2026, playgta5.com no longer accepted connections. The Wayback Machine holds a capture of the page from that morning, and it shows exactly how this port was built. The title screen and start menu still render, because they are HTML and CSS. The engine never starts. The archive has no game.wasm, no workers, no manifest and none of the game data (every one of those URLs is a 404 there), and even if it had them, the archived page is served without the COOP/COEP headers it checks for, so it stops at 5% with its own message: "not cross-origin isolated". I have not linked the site or the capture, and nothing here tells you how to get the data.
What I take from it
Strip away the provenance and this is a clean demonstration of something that was not true two years ago. The browser now has every primitive a 2013 AAA engine needs, without rewriting the engine:
- 64-bit WebAssembly with shared memory, so a 3 GB heap and 75 real threads;
Atomics.waitin workers, so C++ can block the way it always did, andAtomics.waitAsyncso JavaScript workers can serve it without spinning;- WebGPU, close enough to D3D11 that a recorder and a replayer bridge them, with the gaps (tessellation, geometry shaders, binary occlusion) known and listed;
- synchronous access handles in OPFS, so a 20.9 GB file system can be faked one 4 KB block at a time;
fetchpriorities,DecompressionStream,AudioWorkletandOffscreenCanvasfor the rest.
What did not translate is equally clear: no geometry or tessellation stages, a per-call cost that makes thousands of draws expensive, garbage collection that never runs in a busy worker, completion callbacks starved by microtasks, timers that round to the OS tick, and a host that has to serve many small streams, not big files. Each of those has a comment in the source explaining the workaround. If you ever port a native engine to the web legitimately, those comments are a better checklist than most documentation.
Elsewhere on the site, WebGPU usually shows up for small things: a 41,321-parameter syntax highlighter, a decision model scored in the page, Gaussian splats as WebP images or TypeGPU's value types. This is the other end of the scale. And for the opposite direction, a modern graphics pipeline reimplemented by reading rather than running it, see OpenDLSS-NR.