2026-10-26 · 20 min · mixture-of-experts · offloading · on-device · apple-silicon · inference · qwen · quantization
A 1:34 narrated explainer, drawn in code. Every number and picture in it is this article's own; the sources are below.
› transcript
Hi, I'm Jackstay! This engine runs a huge model on a Mac that cannot hold it. Most of the model is experts, and a token needs only a few. The busy ones stay in a pool of slots, and the rest wait on disk. Each layer, the router picks ten of five hundred twelve experts and looks for each in the pool. An expert already in a slot goes straight to the graphics chip, which gathers it by slot number. A missing one is read from disk into a slot, about three megabytes, with no cache in between. A forecast runs the router of a later layer early, so some reads finish before they are asked for. The pool is shared by every layer, and one simple scan chooses what to evict. A hit marks the slot as recently used. A miss sweeps a hand around the pool. It skips the slots this layer is still using. The first unmarked slot is the one that gets replaced. In the project's own runs, the pool already held the expert eighty to ninety six percent of the time. With an empty cache the disk would have to deliver almost thirty gigabytes a second. It tops out near seventeen. So the speed is a caching problem. Most lookups hit, and the disk wait is a minor part of each token. Experts on disk, a shared pool in memory, and a forecast to hide the reads. Every source is in the full article. I'm Jackstay. Bye!
Why read this
Solidtop 85%Reads the slot pool and pread path in the Swift source, decodes the run receipts: 80-96% pool hits at 156 experts a layer, so SSD waits are 11-30% of decode.
- Original analysis
- Concrete numbers to act on
- Explained from first principles
Inference & servingRuns on a consumer GPUMITPractitioner tool
How this was scored
- Is it new?
- 1 of 3: An incremental tweak
- Can I trust it?
- 2 of 3: Measures key facts from files, code or configs
- Can I run it?
- 1 of 3: API-only, gated or restrictive licence
- Will I understand it?
- 2 of 3: Mechanism from first principles with figures
- Can I act on it?
- 2 of 3: A concrete recipe, numbers or comparison
- Will it last?
- 1 of 3: Relevant for months
- Does it affect many?
- 1 of 3: A specialist community
- Only here?
- 2 of 3: A teardown or measurement few others did
Score 56 of 100, ranked 441 of 613 rated articles. Each question is answered 0–3 by hand, and a 3 is rare. How articles are scored
@QwenAIFans posted that you no longer need a 128 GB Mac for a 105 GB Qwen model. Slotstream, by Carlos Galarza, streams Qwen3.8-Flash-Next from the SSD and runs it on 16 to 64 GB Apple Silicon Macs, as one Swift binary with no Python. The post's number is 20.91 to 23.69 tok/s on a 48 GB M5 Pro with a 33 GB budget, from the project's own 5 October benches, and the post says so: "your Mac/SSD will differ."
- license
- MIT
- branch
- main
- tests
- 90 files
- source
- 13.7 kB
- commit date
- 2026-10-26
by size of tracked source at this commit, file counts in brackets; docs, data and vendored trees excluded
local clone, 2026-10-26 at e038436 — branch, commit, commitDate, fileCount, hasTests, languages, license, licenseFile, testFileCount
The thread has no other posts. The replies ask about SSD wear, the 32k window on a 48 GB Mac and first-read latency at
the 10 GB budget, and the author's account agrees that the 20+ tok/s is a 33 GB number. So I cloned it at commit 7de1cb7, read the
engine, read all eleven safetensors headers of the checkpoint by range request, and ran what runs on a Linux VM. No part
of this ran on a Mac. Everything below is labelled measured (I computed it from a file), reported (the project's or
a reporter's figure, not re-run) or reasoned (my arithmetic on the other two).
What is in the 103.8 GB
I summed every tensor in model-00001 to model-00011 of
pipenetwork/Qwen3.8-Flash-Next-MLX-4bit, the 4-bit
conversion slotstream reads. All measured from the headers:
| Part | Bytes | Where it lives |
|---|---|---|
| Routed experts, 48 layers x 512 | 67.95 GB | SSD, streamed |
| N-gram embedding table | 32.00 GB | SSD, 16 rows a token |
| Everything else (attention, shared experts, router, head, vision) | 3.82 GB | resident |
| Total | 103.77 GB |
The post's "105 GB" is a round-up; the files are 96.6 GiB. The repo's own plan says 68 GB, 32 GB and 3.8 GB, so the three agree.
The size of one thing matters more than the sums. An expert in layer 5 is three matrices (gate_proj, up_proj,
down_proj) of 640 x 2,560 weights at 4 bits with a group size of 64, plus a bf16 scale and a bf16 bias per group. Per
expert that is 819,200 bytes of weights and 102,400 of scales and biases, three times: 2,764,800 bytes, 4.5 bits a
weight. The 512 experts of a layer are stored as stacked tensors, [512, 640, 320] for the weights and [512, 640, 40]
for the scales, so one expert is nine slices, six of them 51,200 bytes. Router weights are bf16 [512, 2560].
A token routes 10 experts in each of 48 layers: 480 records, 1,327.1 MB (reasoned). If a cache held nothing, that is the read per token. It is the number the rest of this article keeps coming back to.
The 32 GB table is the cheap one. Each token looks up 16 rows of 100 bytes (80 bytes of 4-bit weights, 10 of scales, 10
of biases), so 1.6 KB a token (measured from the shard shapes, and it matches the 1.6 KB in the repo's notes).
That is the design the Qwen3.8-Flash-Next article describes: a lookup known one layer ahead.
Slotstream reads those rows with pread and dequantizes them on the CPU (NgramStore.swift), with its own prefetch
(NgramPrefetch.swift). The experts are where the work is.
What a slot is
The README says slotstream "reads experts from SSD into a fixed pool of cache slots. All 48 layers share that pool, so
layers that need more slots can borrow them from others." The code is SlotPool in ExpertStore.swift. It is one set of
nine arrays, shaped [slots, ...], so a slot is the space for exactly one expert record. A map takes
(layer, expert) to a slot. Each slot has a reference bit. A hand sweeps the pool.
// Sources/Slotstream/ExpertStore.swift:885, abridged
while true {
    let s = hand; hand = (hand + 1) % slots
    if pinned[s] || inFlight[s] { continue }          // the layer's own routed slots, and reads in flight
    if refBit[s] { refBit[s] = false; continue }      // second chance
    return s                                          // first unreferenced slot is the victim
}
That is CLOCK. A hit sets the reference bit and pins the slot until the layer is done. A miss takes the next victim, reads the record into it, and sets the bit. The slots a layer routed to are pinned so the gather that follows cannot read a slot while it is being overwritten.
Two caveats on policy, both from the code. First, useAdaptive switches to an ARC-style replacement
(AdaptiveSlotReplacement.swift) only for store.isQ2 || store.nativeAffineTiles. The original 4-bit pack takes the
CLOCK branch, which is what the engineering notes say: "The existing CLOCK cache policy stayed." That is my reading of one
conditional, reasoned, not a run. Second, at the minimum pool, LayerLocalVictim prefers a slot from the same layer.
The floor is Geometry.floorSlots = 640, about 13 a layer.
What the 33 GB plan buys on the M5 Pro (the October 5 receipts, measured from the record): 7,509 slots, 156 a layer, 30.6% of the 24,576 records, a pool of exactly 7,509 x 2,764,800 = 20,760,883,200 bytes. The rest of the ledger is further down.
The widget below is a toy of that mechanism, with 6 layers of 16 experts and the same 30% resident. Step a layer at a time. Tiles on the bottom slab are records on the SSD; the slab above is the pool, coloured by the layer that owns each resident record, with its reference bits and the hand. Turn lookahead on to see reads that start two layers early.
How it reads from the SSD
Not with mmap. The notes explain why: "A memory-mapped file alone doesn't solve this in MLX... The tested expert-gather
operation materialized every expert in a layer, even though the token needed only a few." So slotstream owns the placement.
The read is pread, in Checkpoint.swift:
// Checkpoint.swift:833-836
f = open(file.path, O_RDONLY)
_ = fcntl(f, F_NOCACHE, 1)
_ = fcntl(f, F_RDAHEAD, 0)
F_NOCACHE and no read-ahead mean the expert reads skip the unified buffer cache, so there is no page-cache tier in this
design (the widget draws it as a dashed membrane for that reason). The repo learned why the hard way: its first disk
benchmark reported 28.8 GB/s sequential and 72 GB/s random, because the test file was still cached and F_NOCACHE does not
evict pages already there. That is also what the README's "uncontrolled filesystem cache" means.
The reads are parallel and sized by measurement, not by theory:
- A demand batch spreads nine preads per missing record across
poolQueueDepthlanes, 32 by default. At 30 experts a layer, 12 lanes decoded 6.82 tok/s, 32 lanes 7.14, 64 lanes 7.16 (reported, MEASUREMENTS.md). The path is latency bound: a layer's handful of misses cannot fill a queue. - Prefetch buffers use 16 KiB page-aligned spans (
ExactRead.pageBytes), widened only while they stay inside the tensor and the caller's scratch. - Misses are read "straight into their cache slots" (the notes' words). As I read
readIntoSlotsChecked, the destination is the pool array's own memory, in unified memory, so apreadlands where the GPU will read it, with no staging array and no GPU scatter. - Prefill is different. A pass of 256 tokens or more takes a sweep that reads a layer's experts in contiguous batches outside the pool; the notes say a later change admits the prompt's hot experts to the pool on its last pass.
The SSD numbers are the repo's own, reported from its M0.5 (an Apple SSD AP2048Z, 2 TB, never-repeat cold random reads of 2.7648 MB): 9.46 GB/s at queue depth 1, 17.25 at 8 and 17.30 at 32, which is 292 microseconds a read at depth 1. The engine does not reach that. A nine-piece record is nine preads of a mean 307 KB, six of them 51 KB, and the notes' prefill runs plateau at 11 to 13 GB/s. A contiguous on-disk repack, the "skipped M2 container", is the fix they name and have not shipped.
Lookahead: guess the layer two ahead
A cache hides the experts you used before. The lookahead hides some you have not. After each layer, slotstream runs the router of the layer two ahead on the current hidden state, which needs no extra model. The experts it names are read into reserved buffers before that layer asks. If the real router asks for one, a bookkeeping update hands over the slot; if not, the read is discarded. Wrong guesses cost bandwidth, never output: the real router still chooses with the real weights.
What the repo reports for it (reported, docs/EXPERT-LOOKAHEAD.md):
- Reusing the next layer's router: forecast agreement 0.62. Reading the state after the previous layer's attention: 0.73. Plus a 35 MiB learned correction: 0.80.
- The correction decoded about 1.11x faster than the 0.2.18 forecast on eight held-out prompts (1.111x in the decision run, 1.108x in the release benchmark at a 22 GB target, 14.38 to 15.86 tok/s), reading about 20% fewer records and wasting about 74% fewer speculative bytes. Output identical in every run.
- Failures are listed too: trained predictors, remembering routes for repeated tokens and other replacement policies did not pass their gates. Computing the next layer's attention early reached 0.86 agreement and was slower.
It is the activation offload idea turned around: there a copy hides behind compute you already have, here a read hides behind layers you have not run yet.
Metal, and what Metal is not doing
Slotstream is Swift on Apple's MLX through mlx-swift. The expert matmuls are MLX's gatherQuantizedMM, called with the
slot indices of the routed experts as right-hand-side indices into the pool arrays (Layers.swift:1706): the GPU
indexes the pool, not the model. The pieces MLX does not have (the gated-delta recurrence, selected attention, partial
rotation, block and router selection) are Slotstream's own Metal kernels compiled at run time through
MLXFast.metalKernel; I count 36 metalKernel( call sites. A C++ target vendors Metal-cpp for scheduled native
expert kernels. Its switch, NativeExpertSchedule.enabled, is tied to the Q2 packed-expert path, so as far as I can tell the
original 4-bit pack does not use it.
SwiftPM cannot compile MLX's shaders, so the Makefile fetches a prebuilt mlx-0.32.2.metallib and copies it beside the
binary. The build needs macOS 14 and Swift 6; make build runs swift build -c release. I could not run it.
What I could measure is size. This is the checkout, counted with wc -l:
| Part | Lines |
|---|---|
Swift under Sources/ (342 files) | 95,713 |
of which the Slotstream engine (172 files) | 56,036 |
C and C++ authored here (CSlotpack, CNativeSchedule, not vendored) | 1,218 |
Python under Tools/ (276 files, never on the request path) | 50,064 |
"No Python" is true of the product. The reference implementation the port is checked against, the simulators and the benchmark drivers are Python, and there are more lines of them than of the Swift engine.
Checking 20.91 to 23.69 tok/s against the bytes
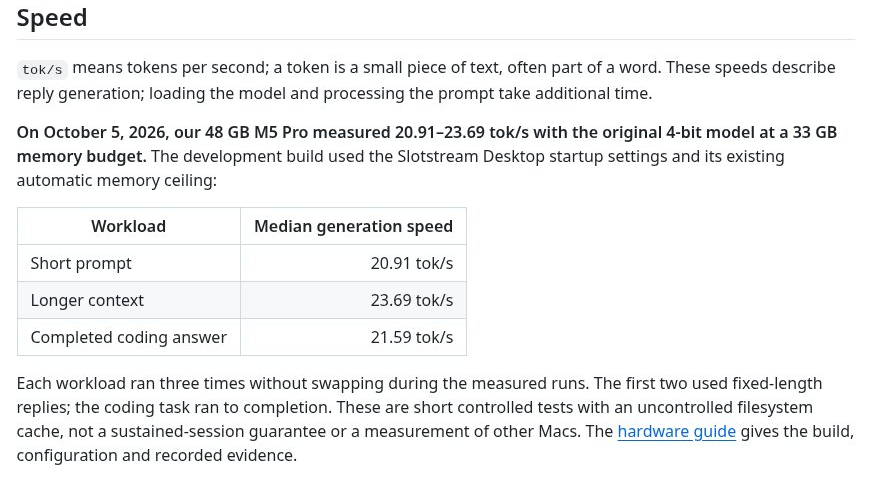
What the benchmark measures, from the README and docs/HARDWARE.md (reported): the original 4-bit model on the
author's 48 GB M5 Pro with a 33 GB ceiling, the Desktop startup recipe (full context allowance, prefix cache, two draft
tokens, the corrected forecast), three runs of each of three workloads, no swapping. The rate is committed output tokens
minus the first, over the complete decode timer. Two workloads used fixed-length replies; the coding answer ran to
completion. It is the author's Mac, a short controlled burst, with the filesystem cache uncontrolled.
The bandwidth first
Can the SSD carry it? At 21.59 tok/s, 480 records of 2.7648 MB a token is 28.7 GB/s if nothing hits. At 20.91 it is 27.7, at 23.69 it is 31.4 (reasoned). The repo's raw SSD reads 17.3 GB/s and its engine path 11 to 13. So the cache has to be hitting, and the speed puts a floor under how often:
| Speed | All-miss need | Hit-rate floor at 17.3 GB/s | Floor at 12 GB/s |
|---|---|---|---|
| 20.91 tok/s | 27.7 GB/s | 38% | 57% |
| 21.59 tok/s | 28.7 GB/s | 40% | 58% |
| 23.69 tok/s | 31.4 GB/s | 45% | 62% |
A weak floor: it assumes the SSD is the only cost and reads never overlap compute. The unified-memory side is not tight either. The GPU reads the 1.327 GB of routed experts plus 2.57 GB of layers and output head, 3.89 GB a token, which at 21.59 tok/s is 84 GB/s, 36% of the 235.1 GB/s the repo measured with a bf16 add (reasoned; verifying several tokens per pass reads the dense weights once for all of them, so the real figure is lower).
The receipts say more than the README
The October 5 run record is a markdown file that embeds its raw receipts as zlib-base64 blocks. I decoded the three
processes for the original pack (plain decompression, nothing from the repo executed). Each ran the three workloads: 256 tokens, 256 tokens and an
81-token coding answer. Computing the README's rate from them, (tokens - 1) / decodeSeconds,
gives 20.70, 20.91 and 21.05 for the short prompt, 23.68, 23.69 and 23.78 for the longer context, and 21.59, 21.65 and
21.58 for the coding answer. The medians are the README's 20.91, 23.69 and 21.59, so the headline is the receipts' number
(measured from the record; the runs are the project's, not mine).
Each receipt also carries the pool's own counters. For the median round:
| Workload | Decode time | Pool hit rate | Read during decode | Read per committed token | Waiting on reads | Time per token without reads |
|---|---|---|---|---|---|---|
| short prompt | 12.20 s | 89.8% | 13.73 GB | 53.8 MB | 2.06 s (17%) | 39.7 ms |
| longer context | 10.77 s | 95.9% | 7.45 GB | 29.2 MB | 1.13 s (11%) | 37.8 ms |
| coding answer | 3.69 s | 80.4% | 8.97 GB | 112.1 MB | 1.11 s (30%) | 32.2 ms |
All three used 156 experts a layer, 7,509 slots. The hit rate is expertHitRate, the pool's decode counter; it counts
distinct experts per layer per pass, and a pass that verifies two draft tokens looks up the experts of three positions
together. So read it as the pool's own hit rate, not hits out of 480 per token.
What I read in it (reasoned, from those measured rows):
- The hit rate is 80% to 96%, far above the 38% to 62% floors. At 156 a layer the SSD is a tail, not the engine.
- A committed token reads 29 to 112 MB. That is 2.2% to 8.4% of the 1,327 MB an empty cache would read. Of the 13.73 GB the short prompt read, 4,607 demand misses account for 12.74 GB; the other 1.0 GB, about 360 records, are speculative reads the lookahead started.
- Waiting on reads is 11% to 30% of decode time, and the bytes arrive at 6 to 8 GB/s while the model waits, under the 11 to 13 the notes quote for contiguous sweeps. Small batches are latency bound, as the repo says.
- Without that wait, a token takes 32 to 40 ms. If
decodeIOSecondsis the whole wait, an infinite cache on this Mac would run 25 to 31 tok/s. The rest of the time is the GPU, dispatch and everything else. A 128 GB M5 Max reporter got about 31.5 tok/s at a 73 GB budget on a different chip. - That explains the odd ordering. "Longer context" is fastest because that workload hit 95.9% against 89.8% and 80.4%. Why its routing reuses more experts I cannot say.
The 33 GB plan itself is in the receipt's memory ledger (measured from the record): a pool of 20,760,883,200 bytes, which is 7,509 slots of 2,764,800 exactly; 5.3 GB fixed; a 2.66 GB prefill workspace; the 1.6 GB draft head, resident; 0.43 GB for the lookahead; 1.25 GB of retained state. That is a planned peak of 32.0 GB, plus 1 GB of margin to reach 33. The supervised peak in the same record is 28.94 GB.
A simulation, to ask what a bigger cache is worth
The receipts answer one cache size. To ask about others I ported SlotPool.victim and ensureCore's order of operations to
Python (hits set the bit and pin; misses take victims; pins last for the layer) and ran it on a synthetic trace: 48 layers,
512 experts, 10 routed each, popularity Zipf per layer, plus a slowly drifting per-expert preference so the same experts
come back. I fitted its three knobs to the repo's M1 trace summary: 220 decode steps, 9,956 of 24,576 records touched, the
top 10% serving 70.9%, CLOCK 0.557 at 30 experts a layer, LRU 0.568 and, at 60, 0.707. The trace itself is not in the repo,
so I could not replay it.
class Clock:                      # port of SlotPool: one pool, all layers
    def victim(self, pinned):
        while True:
            s = self.hand; self.hand = (self.hand + 1) % self.n
            if s in pinned: continue
            if self.ref[s]: self.ref[s] = False; continue
            return s
The fit is imperfect. On 220 steps it gave CLOCK 0.561 at 30 a layer, LRU 0.568, LRU at 60 a layer 0.754 (repo 0.707), 10,397 records touched, and the top 10% serving 81%. So it is too kind at 60 and too concentrated. For 1,500 steps, a 300-step warm-up and two seeds, the shared CLOCK pool's hit rate is (simulated):
| Experts a layer | Pool | Hit rate | Misses a token | MB read a token |
|---|---|---|---|---|
| 30 | 4.0 GB | 55.1% | 215 | 596 |
| 60 | 8.0 GB | 74.7% | 122 | 336 |
| 100 | 13.3 GB | 85.8% | 68 | 188 |
| 156 (the 33 GB plan) | 20.7 GB | 92.6% | 35 | 98 |
| 256 | 34.0 GB | 97.0% | 14 | 40 |
| 400 | 53.1 GB | 98.6% | 7 | 19 |
The receipts let me check it at 156: simulated 92.6%, measured 80.4%, 89.8% and 95.9%. The simulation is inside the range, at the kind end, with one workload the model's routing makes harder than my trace. The miss rate the receipts average (about 11%) is roughly 1.5 times the simulation's 7.4%, so the ledger has a multiplier. A second data point gives 1.8. The repo's table holds a clean pair from one reporter, a 64 GB M4 Max at about 119 experts a layer: 15.93 tok/s on the internal SSD and 2.98 tok/s with the model on a USB drive that read 0.9 GB/s (reported), 62.8 ms against 335.6 ms a token. If the 272.8 ms difference is all misses read at 0.9 GB/s instead of 12 to 17 GB/s, the token reads 94 to 96 records, a miss rate near 20%, hit rate near 0.80 (reasoned, ignoring overlap). The simulation says 0.89 at 119.
What the simulation says about policy
Across sizes the CLOCK pool is within 0.5 to 2.2 points of LRU, except at 20 a layer where LRU leads by 4. Equal per-layer
partitions match it from 60 a layer up and beat it below (by 7 points at 20, 3 at 30), because every synthetic layer has the
same skew and sharing has nothing to lend. The code has the same split: LayerLocalVictim prefers same-layer victims only at
the 640-slot floor, and says "Larger arenas retain CLOCK's ability to lend capacity across layers." Since I fitted to the
repo's numbers, this is consistent with its "capacity and warm start, not policy", not independent support.
The simulation also prices a forecast. If the lookahead names a missed expert in time with probability 0.62, 0.73 or 0.80 (the repo's three "agreement" figures, which I am treating as recall), stalled misses at 156 a layer fall from 7.4% of lookups to 2.8%, 2.0% and 1.5%. And a read takes 292 microseconds at queue depth 1 (reported): at about 0.7 misses a layer, a wait in every layer would be up to 14 ms of a 46 ms token. The receipts show 8 ms a token for the short prompt (2.06 s over 255 tokens). That is latency, not bandwidth, and why the lookahead earns its keep.
Against Maya, Engram and the other offloaders
Project Maya solves the same problem with three tiers (VRAM, pinned RAM, SSD) because a V100 has
its own memory. Its victims come only from the requesting layer's slot partition, sized per layer from routing counts.
Slotstream has one tier and one shared pool, because on Apple Silicon the GPU reads the same memory the CPU preads into.
My simulation found the partition-or-share question moves hit rate by under a point from 60 experts a layer up, so Maya's
per-layer partition is a safety property (no kernel reads a slot being overwritten) more than a hit-rate one. The two engines meet at the
numbers: Maya's 97% VRAM hit rate target and slotstream's measured 80 to 96% are the same game, a cache big enough that the
SSD is a tail.
The n-gram table is the DeepSeek-V4.1-Flash-1017 Engram trick, small: 1.6 KB a token
here against tables of 202.76 GB there. Edge0 keeps experts on disk and predicts routing
one token ahead; slotstream predicts two layers ahead and keeps a much bigger cache. And one 3090 with experts in
RAM is the same ledger with PCIe where this one has pread.
What I did not do
- I did not run slotstream. There is no Mac here, so no tok/s, hit rate or SSD number on this page is my own run. The byte counts, line counts and the simulation are mine; the speeds and hit rates are the project's receipts, decoded.
- I read three of the six processes' receipts closely, the original pack's. I did not unpack the rest of the record (the stdout, the supervision files) or check that its source commit builds into the binary it names.
- I could not replay the repo's real routing trace; the simulation is fitted to its summary numbers, and its policy results are a model. The receipts bound it at 156 a layer only.
- The multiplier of 1.5 to 1.8 comes from those receipts and from one reporter's two M4 Max runs under an assumption that read time simply adds. Other Macs, SSDs and speculative decoding break it.
- Why the longer-context workload routes to more reusable experts is not something I could find.
- The post's "105 GB" is 103.77 GB by the headers. Quality is untested: the README itself says there are no broad benchmarks yet.
The takeaway I would act on: slotstream is a caching problem with an SSD behind it. On the plan the author benchmarked, the pool hits 80 to 96% of the time and the model waits on reads for 11 to 30% of a token, so the number to look at on your own Mac is the hit rate its logs print, and the read rate you get through the engine, not the SSD's spec sheet.