2026-10-08 · 31 min · inference · mixture-of-experts · offloading · quantization · glm · speculative-decoding · sparse-attention · gguf
Why read this
Notabletop 60%Reads Maya's three-tier expert cache and the Maya-S headers, then models the V100 box: 40 tok/s needs ~97% VRAM hits; the cheap upgrade is RAM, not GPUs.
- Original analysis
- A new technique
- Concrete numbers to act on
Inference & servingNeeds a workstation GPUMITPractitioner tool
How this was scored
- Is it new?
- 2 of 3: A real new idea, method or capability
- Can I trust it?
- 2 of 3: Measures key facts from files, code or configs
- Can I run it?
- 2 of 3: Open code or weights with real limits
- Will I understand it?
- 2 of 3: Mechanism from first principles with figures
- Can I act on it?
- 2 of 3: A concrete recipe, numbers or comparison
- Will it last?
- 1 of 3: Relevant for months
- Does it affect many?
- 1 of 3: A specialist community
- Only here?
- 2 of 3: A teardown or measurement few others did
Score 63 of 100, ranked 200 of 476 rated articles. Each question is answered 0–3 by hand, and a 3 is rare. How articles are scored
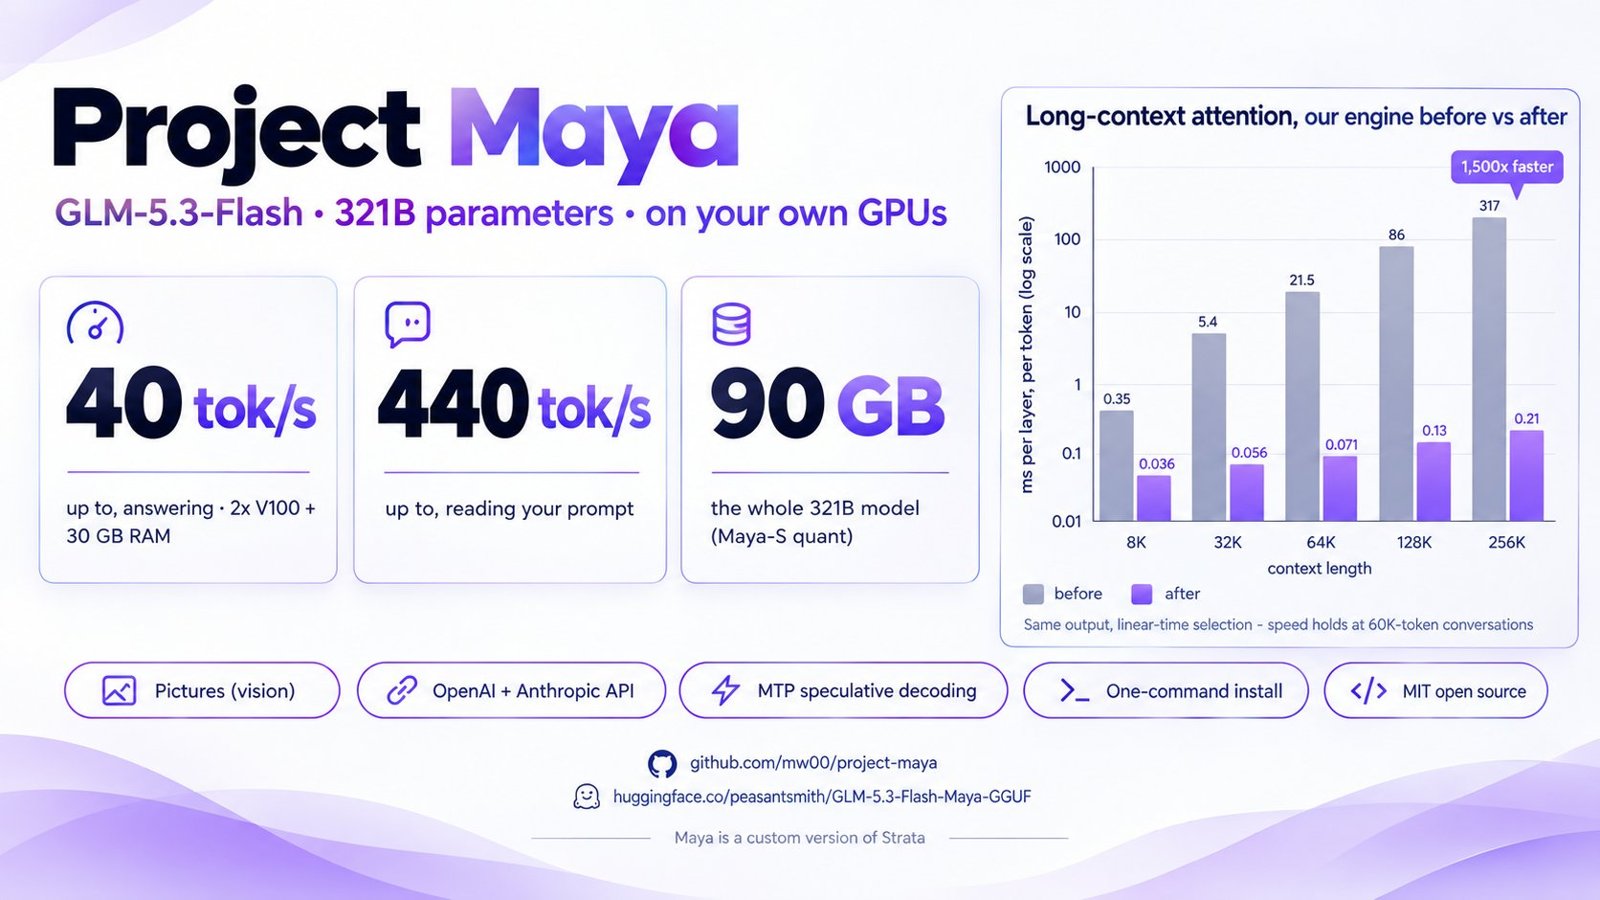
The site has covered GLM-5.3-Flash six times now: its architecture, a vLLM fork on mining cards, an MLX build for Macs, an abliteration, and the inference stack Z.ai says the model built for itself. Every one of those runs it on hardware with more memory than the model. Then @PeasantSmith posted Project Maya: the whole 321B model on two Tesla V100s from 2017 and 30 GB of system RAM, at up to 40 tokens a second.
Two V100s hold 64 GB. The quant is 96.5 GB. So at least a third of the model lives off the cards, and with 30 GB of RAM some of it must live on the SSD. I wanted to know what the engine does with each token's 336 expert lookups, and what has to be true about them for 40 tok/s to come out the other end.
- license
- MIT
- branch
- main
- tests
- 41 files
- source
- 6.4 MB
- commit date
- 2026-10-08
by size of tracked source at this commit, file counts in brackets; docs, data and vendored trees excluded
local clone, 2026-10-08 at 2b0f1a3 — branch, commit, commitDate, fileCount, hasTests, languages, license, licenseFile, shallow, testFileCount
shallow clone: counts describe the pinned tree, not the history
What is in the 96.5 GB
I started with the files, because everything downstream is a question of bytes. The Maya-S folder on Hugging Face holds three shards, 96,468,592,256 bytes together, which is 96.47 GB or 89.84 GiB. The "90 GB" on the card is the GiB figure (the first Maya-S, which the v2 replaced on launch day, was also 90.1 GB). I read the tensor tables out of the three GGUF headers with HTTP range requests, a few megabytes each, and summed them.
The text model, MTP block included, is 320,759,404,382 parameters. The vision projector file next to it adds 563,627,008. Together they make 321,323,031,390, which is the number in the project's study document to the last digit. So the "321B" counts the vision tower; the language model is 320.76B, and the weights average 2.41 bits.
The split by tensor family is what matters for speed:
| Tensors | Type | Size |
|---|---|---|
| routed experts, gate and up (42 layers) | IQ2_XXS, 2.06 bits | 52.32 GB |
| routed experts, down | IQ2_S in 34 layers, IQ3_XXS in layers 3-6 and 41-44 | 33.71 GB |
| attention, KDA, shared experts, dense layers, output head | Q6_K | 6.56 GB |
| KDA gate projections, sparse-attention indexer | Q8_0 | 0.21 GB |
| router, hyper-connection mixing, norms | F32 | 0.36 GB |
| token embedding | Q6_K | 0.52 GB |
| the NextN draft block (layer 45) | Q2_K / Q3_K experts, Q6_K rest | 2.78 GB |
The routed experts are 86.03 GB over 42 layers of 288, so one expert blob (gate, up and down together) is 7.11 MB on average. A token picks 8 per layer, 336 in all, and reads 2.39 GB of them. The next three rows, the attention, the KDA layers, the shared experts, the three dense layers, the router and the output head, come to 7.13 GB, and every token reads all of it. The embedding is one row a token, and the draft block only runs on the two-GPU path.
I expected the experts to dominate a token's bytes. They don't. At Q6_K the dense side is three times the routed side per token, 7.13 GB against 2.39 GB. The expert tiering decides how often the GPU waits, but once the experts are mostly in VRAM, the speed limit is a V100 reading 9.52 GB of weights per token. At the card's 900 GB/s that alone is 10.6 ms, a ceiling of about 94 tokens a second before a single miss.
By the same count the active parameters are 16.7B, plus an embedding row. Z.ai says 18B; the difference is counting convention (the vision tower, the embedding table, the MTP block), and it does not change any arithmetic below.
Three tiers and the rules between them
Maya's README says it "grew out of" Strata. I cloned both and compared them. The GLM
path is 32 files and 16,225 lines that Strata does not have (glm_fast_path.cu, glm_prefill.cu, glm_fast.cu,
the KDA, sparse-attention and hyper-connection kernels, and a parity test for each). It does not use Strata's
doorbell or its verify window; what it kept is the build, the server, the dashboard, the CPU kernels from ggml and
the habit of writing the measurement into the comment above the line. Its own study document names the reason it
had to be new: Strata's design assumes every expert is pinned in RAM, and "the design assumption 'all experts
resident in RAM' is dead for GLM on consumer hardware" (docs/GLM5-FLASH.md:221-222).
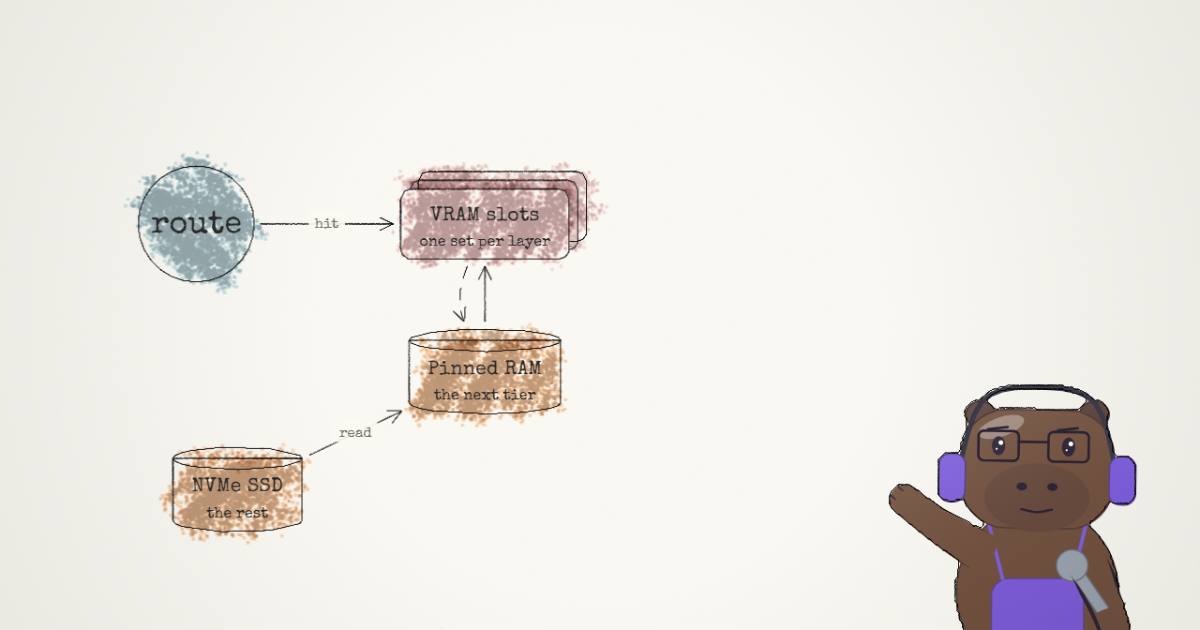
The fast path's header is the best summary of how a token moves:
// src/core/glm_fast_path.cu:6-17
//   * the router runs on the device and looks its experts up in a DEVICE table (layer x expert ->
//     VRAM slot pointer); an all-resident layer never waits for the host;
//   * every route is published to a host-mapped ring; a per-device SERVICE thread keeps the LFU
//     counts and, when a route has misses, reads the missing experts from the shards (pread into
//     pinned staging, in parallel), DMAs them into victim slots OF THAT LAYER on a copy stream and
//     answers through host-mapped memory - the device spins in a one-block wait kernel meanwhile.
//
// Victims come only from the requesting layer's own slot partition, so no kernel can be reading a
// slot while it is overwritten
Three things in there are worth slowing down for.
VRAM: one partition per layer, sized by what the layer routes
Each MoE layer owns its own run of VRAM slots. At start the engine measures the card's free memory, keeps 700 MB
for the driver, and divides the rest. With the pack's expert_counts.txt it does this greedily: every layer gets a
floor, then each further slot goes to whichever layer's next-most-routed expert serves the largest share of that
layer's lookups (glm_fast_path.cu:520-598). Early layers spread their routing wide, so they get more slots.
Their own log measured this at 35.5 to 32.9 ms a token.
A detail I only found by following the files: nothing in the installer writes expert_counts.txt or
expert_prior.txt. The developer's build script copies both from an earlier pack built from routing traces
(tools/maya_quant/run_v2.sh:26), and maya.py's pack step lists seven files, neither of them. On a fresh install
every layer gets the same number of slots, and the first warm-up loads experts in id order. The second run is
better: the engine saves expert_usage.txt after each request and warms from it next time
(glm_fast_path.cu:1191-1196). That is why the README says the first answers after a start are the slowest. The
routing-share split, though, never comes back without the counts file.
How "most-used" is measured
It is a plain counter. The service thread sees every route the GPU publishes and bumps one counter per (layer, expert); every 32,768 route events all counters are halved:
// src/core/glm_fast_path.cu:1550 and 1582-1584
if (F->cnt[(size_t) key] < (1u << 24)) ++F->cnt[(size_t) key];
...
if (F->cnt_events >= 32768) {
    F->cnt_events = 0;
    for (auto& c : F->cnt) c >>= 1;
At 168 routes a token per GPU half, that halving comes every 195 tokens or so. A second, slower counter
(usage) only halves when one entry passes 2^30, and it is the one saved to disk. So "most-used" means decayed
route frequency over the last few hundred tokens, seeded from your history on disk.
Promotion on every miss, eviction at the boundary
This is the part that differs most from Strata. Strata swaps experts in batches every few rounds, with hysteresis. Maya promotes on the miss itself. Each layer keeps three empty "spare" slots. When the router on the GPU finds an expert missing from VRAM, it claims a spare, writes the slot into its own table and copies the expert in; from the next token on, that expert is resident:
// src/kernels/cuda/glm_fast.cu:1935-1945
// not in VRAM: land it in a spare slot of this layer (it becomes resident: the table says so
// from here on) or, with none left, in this entry's scratch slot
while (next_spare < kSpares && spares[next_spare] == 0ull) ++next_spare;
if (next_spare < kSpares) {
    ptr = spares[next_spare];
    spares[next_spare] = 0ull;
    a.d.tab[key] = ptr;
    promo |= 1u << i;
If the expert is in the RAM tier, the GPU copies it itself with a kernel that reads host-mapped memory, one block
per SM, 16-byte loads; the comment above it says "the PCIe pull measured 11.5 GB/s (a little over cudaMemcpy's
10.7)" (glm_fast.cu:2092). If it is on disk only, the GPU parks in a one-block spin kernel while eight host
threads pread the three parts of the expert in eight pieces each with O_DIRECT, into a free RAM slot.
Between tokens, fast_boundary refills the spares. It evicts each layer's least-used resident by the decayed
count, recency breaking ties, and copies it back down to the RAM tier if it is hotter than the coldest thing
there; otherwise it is dropped to disk-only (glm_fast_path.cu:2037-2100). The tiers are exclusive: an expert is in
VRAM or in RAM, never both. On the launch box that makes about 54 GB of expert slots in VRAM and 22 GB in RAM, 76 GB of the 86,
and only the coldest 10 GB or so is left to the SSD. The RAM tier's eviction rule protects anything used in the last ~64 tokens, and the
comment says why: the plain least-used rule sent newly hot experts straight back to disk, and "real chats
measured 7-11 disk reads a token that way" (glm_fast_path.cu:1919).
What they tried and measured as losses
I like this repository for what it turned off. Prefetching the next layer's predicted experts into VRAM is in the
code, behind STRATA_GLM_PREFETCH_N, defaulting to zero: "measured a net LOSS on Mercury (the window between routes
is shorter than one fetch)" (glm_fast_state.hpp:141). Reading predicted disk-only experts a few layers ahead is
there too, off by default; the progress log says only about 40-45% of disk misses are predictable that far out and
the wrong reads compete for the one NVMe. And the cache policy: replaying 1,000 tokens of real routes on the two-GPU
box, LRU and their LFU tie, at 97.7% on one GPU and 96.4% on the other, and Belady's optimum, which knows the future, reaches only
98.6% and 98.0%. On one GPU it is LFU 77.5% against an optimum of 87%. The misses are capacity, not policy. No
cleverer eviction rule is going to rescue a machine that is short of memory.
One thing that did win is the CPU lane. When a layer's misses are in the RAM tier, the host computes the coldest of
them from pinned memory with ggml's CPU dot products while the GPU pulls the rest over PCIe. At start it times one
expert on each lane and picks the split (glm_fast_path.cu:911-916). On the single-V100 box with an i5-12600T, a
CPU expert took 0.36 ms against 0.62 ms over PCIe 3.0, and decode went from 18.0 to 21.8 tok/s. Sending all of them
to the CPU was slower: nothing gets promoted, and the VRAM hit rate falls to 60%.
The arithmetic of one token
Here are the lanes an expert can come through on the launch machine, a pair of 32 GB V100s on PCIe 3.0, a Xeon E5-2690 v4 and 30 GB of RAM:
| Where an expert comes from | Bandwidth | One 7.11 MB expert |
|---|---|---|
| V100 HBM2, at the 48% of peak decode reaches | 900 GB/s peak | 0.016 ms |
| pinned RAM, pulled by the GPU over PCIe 3.0 x16 | 15.75 GB/s on paper, 11.5 measured | 0.62 ms |
the NVMe, pread into RAM while the GPU waits | ~2.2-2.4 GB/s | 3.1 ms |
The 48% comes from the engine's own profile: "~11 ms of compute" per GPU half, so about 22 ms for the 9.52 GB a token reads. The DDR4 behind the RAM tier can do 76.8 GB/s with four channels populated, but on this path it does not matter: every RAM-tier byte crosses PCIe, which is almost seven times slower. A RAM hit costs 38 VRAM hits. A disk read costs five RAM hits.
Everything else follows from how the 336 lookups split between those rows. The engine published that split for one V100 at five VRAM budgets: with 714, 1,302, 2,562 and 3,738 of the 12,096 experts in VRAM, about 40%, 55%, 72% and 78% of lookups were served there, and with both cards, 8,458 slots, 98%. Those runs used the earlier UD-IQ1_S file and three short mixed prompts, so they are a rough curve, not a law. A Zipf distribution over each layer's 288 experts with exponent 0.88 fits the single-GPU points to within a few points; it underestimates the two-card point, because one conversation keeps to a narrower set of experts than three different prompts do.
I built the model below from those pieces. The sizes are the GGUF's. The per-expert costs are the engine's own measurements. The skew is a fit, and the draft pipeline factor is fitted to the engine's 38.1 to 25.0 ms a token. It is a model, not a measurement, and it ignores everything I could not price: launch overheads, the halves waiting on each other's slow tokens, the KV and recurrent-state traffic.
With the fitted skew, the launch machine comes out at 24.0 tok/s. Per token, 25 lookups go to RAM and 9.4 to the SSD, and those 9.4 reads cost 29 ms, more than the GPU's own 22 ms. The disk tier holds 2.8% of the lookups and eats close to half the time.
For 40 tok/s the model needs the skew near 1.25, where 96.7% of lookups hit VRAM and fewer than three a token touch the SSD. Solved the other way, a 25 ms token with the draft pipeline running leaves the token-by-token loop 36 ms, and after 22 ms of reading weights about 14 ms for misses: 23 PCIe pulls if nothing touches the disk, four or five disk reads if everything does. That lines up with what the engine measured: 97-98% VRAM hits on the two-card box. So the 40 is real, and it is a best case. It needs a conversation narrow enough that two-thirds of the experts serve 97% of its routes. The project's own progress log records the less flattering number for Maya-S: 28.0 tok/s averaged over five chat topics, 300 tokens each, on 8 October. The README calls it "up to 40", which is honest.
The model also says where the next ten tokens a second are. Move the RAM slider from 30 to 64 GB on the launch preset and the SSD drops out entirely: 34.6 tok/s at the pessimistic skew. The engine splits a model across at most two GPUs, so on that box RAM is the only upgrade there is. Their own log agrees from the other side: on the single-V100 box, going from 45 to 64 GB of RAM cut disk reads from 13.9 to 2.5 a token and took decode from 9.0 to 16.9 tok/s, the biggest single step in the whole table.
One more check, on a machine I did not choose. A reply to the launch post reports a 48 GB RTX 4090 with 128 GB of RAM at 13.5 tok/s decode. The model puts that box near 26: a 48 GB card holds 46% of the experts, all the rest fit in RAM, and PCIe 4.0 halves the pull. Half the model's number on a faster card points at the engine, not the tiers. The author says as much in the thread: early reports are slower on newer GPUs, and he has none to tune on. Everything in this engine was measured on Volta.
Two GPUs and one draft layer
The 26 to 40 jump in their log is not a kernel. It is the MTP block used as a pipeline filler.
With the layers split across two cards, a token goes through the first half on GPU 0 and the second half on GPU 1, so each card idles half the time. The model's NextN block, the draft layer GLM-5.3-Flash ships with, sits on the tail card. After each token the tail drafts the one after it, and the head starts on that draft while the tail is still finishing the current token:
// src/core/glm_fast_path.cu:2627-2632
// The two halves of a split take turns on one token, so each GPU idles half the time.  With the NextN block's draft
// for the token after next, the HEAD half runs that draft while the TAIL half finishes the current token: when the
// tail's token equals the draft, the head's work stands and both GPUs stay busy (a token costs the slower half);
// when it differs, the head restores its recurrent states (saved before the speculative token) and reruns the
// position with the real token.
Only the head speculates, so the output is token-for-token what plain decoding gives. The KDA layers carry a recurrent state, so a wrong guess means copying the head's states back before the rerun; the attention caches are append-only and just get overwritten. On their box the drafts matched 97% of the time on a benchmark text and 83-86% in live chat, and the split moves two layers toward the head to balance the extra work. Plain decode was 38.1 ms a token, pipelined 25.0. Those runs were on the earlier UD-IQ1_S file, a little smaller than Maya-S.
The draft block also takes a shortcut: its experts that are not already in VRAM are skipped, with no RAM pull and no
disk wait, because "its draft only has to be a good guess - every token is the trunk's own"
(glm_fast_path.cu:2235-2236).
The negative result is as interesting. On one GPU they tried the usual form, draft one token and verify two at once, and it does not pay: consecutive tokens share only about one of their eight experts per layer and none of their RAM pulls, so verifying two tokens costs nearly two tokens of PCIe time. Strata's verify window works on a 3090 because most of its experts are hits; here the misses scale with the window. The README is careful to say the MTP decoding is for two GPUs.
A V100 has no BF16 and no FP8
GLM-5.3-Flash ships as block FP8 with BF16 pieces. Volta has neither format and no int8 tensor cores, so the
question is how the card does the arithmetic. The answer is that the weights are never FP8 on the card. The quant
runs offline (the FP8 checkpoint is dequantized to float in PyTorch, layer by layer), and what the GPU sees is
ggml's codebook formats. In decode, every expert product is a dot product of an IQ2_XXS row with an activation
quantized on the fly to 8-bit q8_1. Each 8-bit index picks eight values from a 256-entry grid, a sign mask flips
them, and dp4a, which Volta does have, multiplies four int8 pairs per instruction:
// src/kernels/cuda/iq_kernels.cu:88-97 (transcribed from llama.cpp's vecdotq.cuh)
const uint2 grid_pos = ((const uint2*) iq2xxs_grid)[aux8[k0 / 2]];
const uint32_t signs = unpack_ksigns(aux32 >> (7 * k0 / 2));
const int signs0 = __vcmpne4(signs & 0x08040201, 0);
const int grid0 = __vsub4(grid_pos.x ^ signs0, signs0);
const int u0 = get_int_b4(bq8_1[iqs / 2].qs, k0 + 0);
sumi = ggml_cuda_dp4a(grid0, u0, sumi);
Decode is a matrix-vector product, so the compute barely matters; the bytes do, and 2.06 bits a weight is what makes a V100 viable at all.
Prefill is matrix-matrix, and there the tensor cores matter. The dense projections are dequantized to FP16 slice
by slice and multiplied with cuBLAS on the tensor cores with FP32 accumulation (glm_prefill.cu:768-780). The
experts go through llama.cpp's MMQ at the pinned commit, which on Volta takes the dp4a path: its MMA data layout
is enabled only for turing_mma_available and newer (ggml-cuda/mmq.cuh:189-193 at 3cf0325). The prompt's
attention was moved to FP16 wmma fragments in v1.0.4.
The engine's CMake still refuses anything below sm_75, Strata's floor (CMakeLists.txt:71). The installer gets
around it rather than changing it: for a V100 it asks CMake for native with CUDA_VISIBLE_DEVICES set to the chosen
cards, which the guard does not check (maya.py:440-445). It also needs CUDA 12, since CUDA 13 dropped sm_70.
440 tokens a second of prefill
The card says up to 440 tok/s reading a prompt. The progress log for that day has 273, 428, 487 and 506 tok/s for 2K, 8K, 16K and 30K-token prompts, and the next day's attention kernel moved them to 286, 469, 538 and 561. The README now says 560.
The shape of that row tells you what bounds it. A prompt is processed in chunks of about 4.6K tokens on a 32 GB card. A chunk that long routes 36,800 picks per layer across 288 experts, so it touches nearly every expert, and every expert that is not in VRAM has to be brought in once per chunk. Divide the measured times by the chunk count: a 2K prompt takes 7.2 s in one chunk, an 8K prompt 8.7 s per chunk, 16K and 30K about 7.6 s per chunk. A chunk costs about the same whether it holds 2K tokens or 4.6K. That is the signature of a pass bound by moving experts, not by arithmetic.
The arithmetic agrees. On the launch machine about 4,500 experts are not in VRAM during a prompt (the prompt path also borrows the tail of each layer's slots for its buffers), roughly 3,100 of them in RAM and the rest, 1,400 to 2,000 depending on what the prompt evicted, on the SSD. At 2.3 GB/s those disk reads alone are 4.3 to 6.2 s per chunk. The compute at 4.6K tokens is about 154 TFLOP a chunk (16.7B multiply-adds a token, two operations each), which over 7.6 s is 10 TFLOP/s per card: well under the V100's dp4a and FP16 peaks. The log names the bottleneck it fixed on 7 October: the disk reader was keeping the NVMe at "~0.7 of ~2.9 GB/s", and a 64-expert landing ring replaced the 12-expert one. So 440 is plausible, it grows with prompt length because each chunk pays the same staging, and a faster SSD or more RAM would move it more than a faster GPU.
A reply to the post asked for 1.3-2K tok/s "for real work loads". On this box, that would mean a 4.6K chunk finishing in 2.3 to 3.5 s, less than its SSD reads alone take today.
Steady speed with depth: the model's design and one fixed bug
The third claim is that "a 60K-token conversation answers about as fast as a short one". Most of the credit belongs
to GLM-5.3-Flash. Thirty-four of its 45 layers are Kimi Delta Attention, a recurrence
with a fixed-size state that costs the same at any depth. The other eleven are sparse MLA layers, and each query
attends to at most index_topk = 2,048 positions, picked by an indexer that scores pools of four keys
(index_kpool: 4).
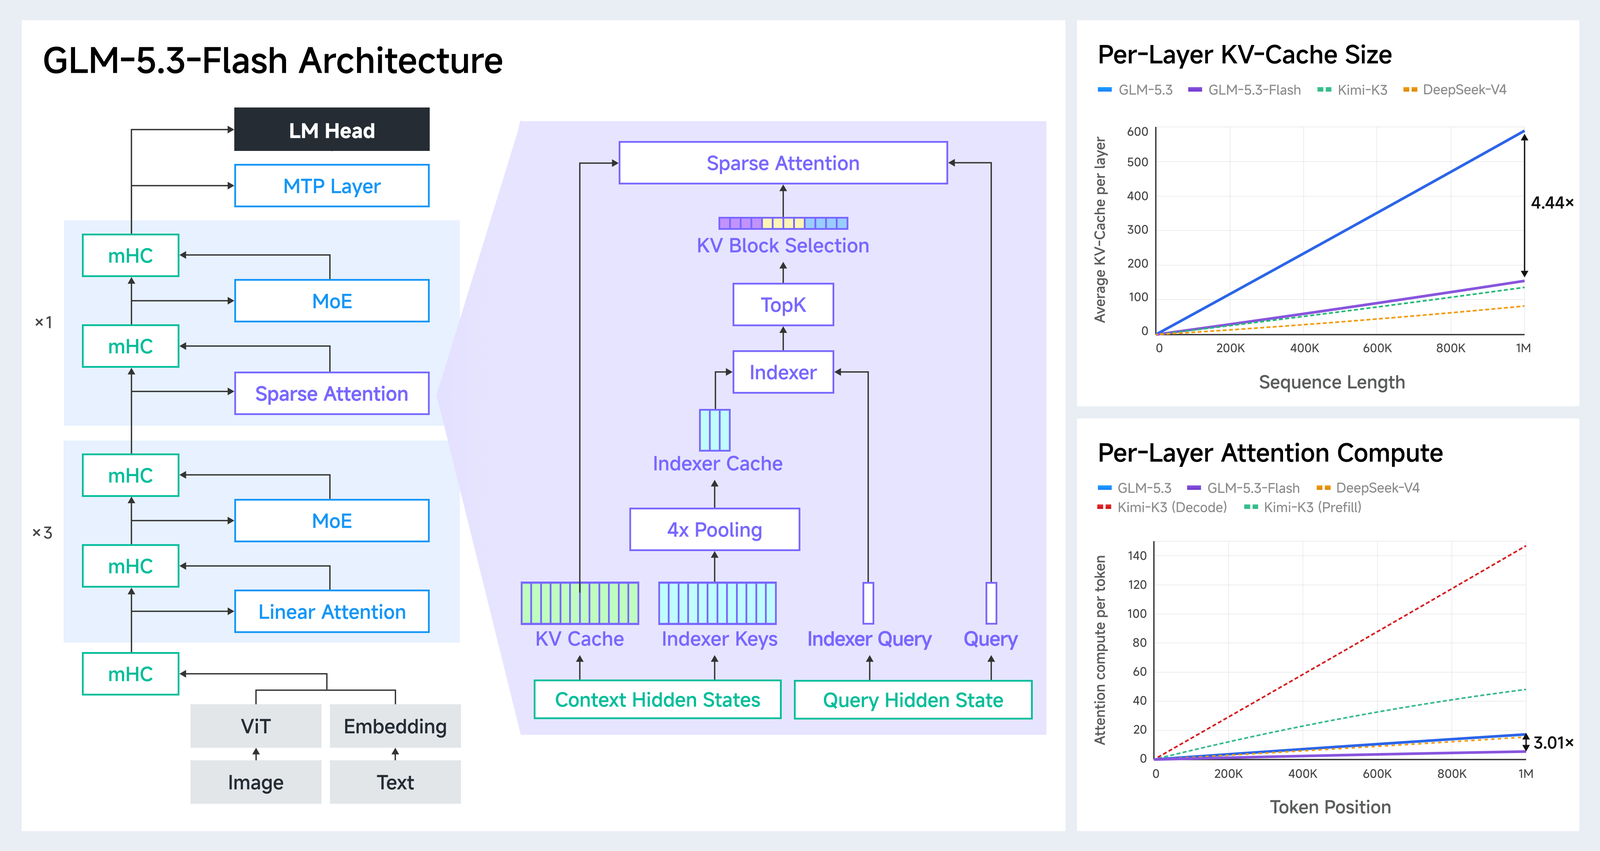
What still grows is the indexer. At 60K tokens it scores 15,000 pooled keys of 128 floats in each of 11 layers, about 84 MB of reads a token. At the 432 GB/s decode reaches that is about 0.2 ms, against a 25 ms token. The attention itself reads 2,048 latents of 512 FP16 values per layer, 2 MB. Depth costs this model under one percent.
The engine nearly threw that away. Its first selection step ranked every pool against every other pool to find the top ones, which is quadratic; at 30K tokens that was about 56 million comparisons per layer per token, in a single thread block. The chart on the launch card is that bug and its fix:
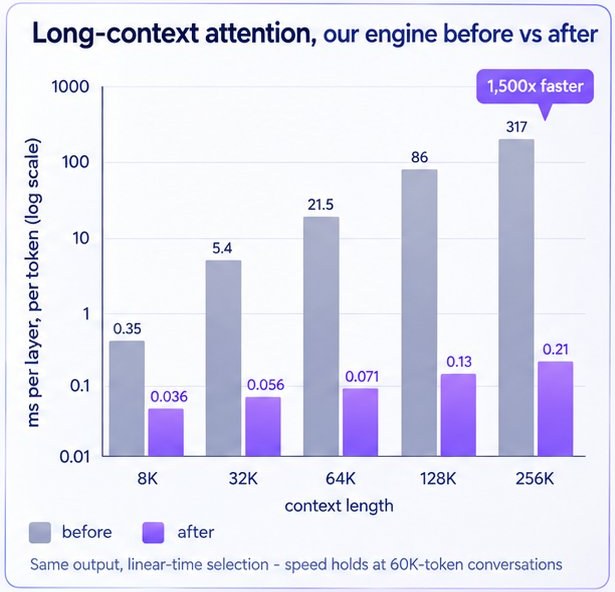
The replacement in src/kernels/cuda/dsa_topk.cuh is a radix select: four passes of 8 bits over order-preserving
integer keys to find the cut-off score, one pass to collect the winners, and a bitonic sort of at most 1,024 of
them. Its header says the order matches the old loop exactly, ties broken by the lower pool index, so the selected
positions do not change. At 64K the step went from 21.5 ms per layer to 0.07.
Their measured decode, through the dashboard on the two V100s with the draft running: 32.8 tok/s at 0.9K tokens, 31.7 at 15-18K, 30.5 at 32K, 29.5 at 48K and 28.9 at 60K. That is 12% slower at 60K, and the last two columns were measured with the image encoder resident, which takes 2.5 GB from the first card's expert cache. "About as fast" is fair. The bigger claim, that this is something the engine achieved, is half right: it achieved not breaking it.
The image encoder, for what it's worth, is handled the same way as prompt buffers. It is a separate process
(llama.cpp's mtmd), and when a picture arrives the engine frees the tail of every layer's VRAM partition for it,
then takes the memory back afterwards (glm_prefill.cu:543-575, serve/server.py:2086-2101). The model keeps
its full expert cache whenever no image is being read.
The quant, and what 97.9% measures
Maya-S is not a re-quantization of someone else's GGUF. The recipe runs Z.ai's FP8 checkpoint layer by layer in PyTorch over 128 calibration sequences of 2,048 tokens (chat, reasoning traces, web code, tool calls), records a separate importance matrix for every expert rather than one per layer, and keeps each MoE layer's input. Then it rounds the gate and up projections with GPTQ at the granularity of ggml's 256-weight superblocks: each block is quantized by llama.cpp's own quantizer, and its rounding error is pushed into the columns not yet quantized through the Cholesky factor of the inverse Hessian:
# tools/maya_quant/gptq.py:106-110
Qb = torch.from_numpy(Qn).to(dev)
deq[:, :, b0:b1] = Qb
if b1 < n:
    Err = torch.linalg.solve_triangular(Uss, W[:, :, b0:b1] - Qb, upper=True, left=False)   # E Uss^-1
    W[:, :, b1:] -= Err @ U[:, b0:b1, b1:]
Each expert's Hessian is built from the tokens routed to it, weighted by routing weight, plus a prior worth 16,384
tokens of the layer-wide statistics so that rarely routed experts are not fitted to a handful of examples. The down
projection's Hessian is built from the already-rounded gate and up, so it absorbs their error. The docstring says
this cut expert output error 27% against llama.cpp's imatrix rounding on held-out tokens in layer 3. The output is
an ordinary GGUF with ordinary types; any llama.cpp with glm5next support loads it.
The measurements are better than most quant cards and still need reading. Against the FP8 model's own top-64 log-probabilities on 7,672 held-out positions, Maya-S has KL 0.428 and picks the same top token 83.3% of the time. Perplexity goes from 3.51 to 4.19. It is worst on tool calls (KL 0.850, 76.5% top-1 agreement) and on wikitext, which FP8 has largely memorized. Tool-call formats are where I would test it first.
The headline 97.9% is five zero-shot multiple-choice tasks, 400 questions each: FP8 averages 82.5, Maya-S 80.8. Four hundred questions near 80% accuracy carry roughly four points of 95% interval each, so no single task's gap is resolved, though the same questions for both models make the average more stable than that. Two other details matter. The FP8 side runs in PyTorch and the quant through the engine, so the comparison includes the engine's own arithmetic. And Maya-M, the 116 GB quant that is clearly closer to FP8 token by token (KL 0.329, 86.2% agreement), averages 80.7, a tenth below Maya-S. The card says this plainly: the tasks cannot separate the two. Read the KL table; skip the 97.9%.
A 3090 and 16 GB, and four drives nobody mentions
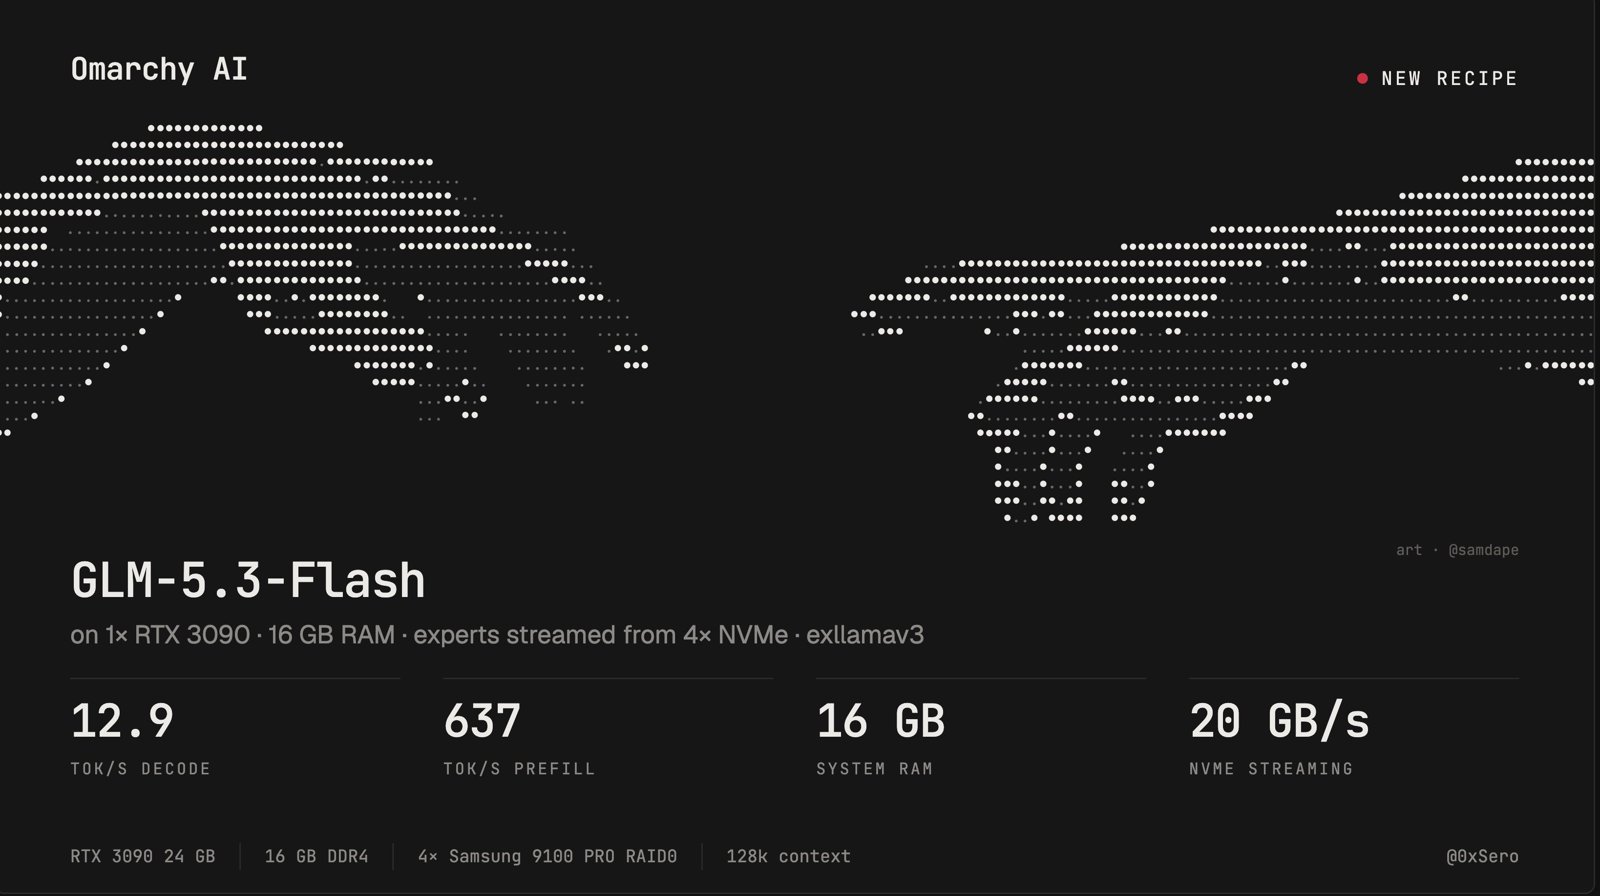
The day this went up, @0xSero posted the same model on "1x 3090, 16 GB of DDR4, NVMe, exl3-3bpw" at 11 to 17 tokens a second of decode, 637 to 950 of prefill, 128k context and "vision enabled". That is half Maya's RAM and one card instead of two, so I put it through the arithmetic above before believing it.
- license
- MIT
- branch
- main
- tests
- none found
- source
- 469.6 kB
- commit date
- 2026-10-08
by size of tracked source at this commit, file counts in brackets; docs, data and vendored trees excluded
local clone, 2026-10-08 at df0b439 — branch, commit, commitDate, fileCount, hasTests, languages, license, licenseFile, shallow
shallow clone: counts describe the pinned tree, not the history
The repository is the same three-tier idea built independently on exllamav3 (it credits FreeToken for the host-memory tier), not on llama.cpp. The checkpoint is turboderp's EXL3
quant at 3.05 bits a weight, 125.3 GB, and its routed experts are 9.44 MB each, a third bigger than Maya-S's 7.11.
The tiers are the ones above: a CLOCK cache of about 1,300 experts in the 3090's VRAM, warmed from saved routing
statistics; a pinned RAM tier that is exclusive of VRAM, sized from the container's memory cap; and every expert in a
117 GB file of 4K-aligned records read with O_DIRECT by a pool of reader threads. Cold experts already in RAM are
computed in place by 22 AVX2 threads while the GPU does its share, the same CPU lane Maya found worth 18.0 to 21.8.
The headline row is real and modest. docs/results.md has one 16 GiB run, a screen on 8 October: 628 tokens a second
of prefill at 8k and 12.91 of decode at one stream, with 970 experts in RAM and the container peaking at 14.4 GiB.
The 17 in "11 to 17" is the 55 GiB arm (17.27), and the 950 is prefill at 32k, which was only run at 55 GiB and in
the all-RAM mode. Nothing at 16 GiB has been through their own lab acceptance yet. And "vision enabled" contradicts
the repo's reference doc, which says the server is text only because the checkpoint's vision tower is not loaded.
Now the arithmetic. The run's tier counters split every one of a token's 336 lookups: about 143 served from VRAM, 108 from RAM, and 86 from NVMe, a quarter of the token, against Maya's two-card box where under 3% touch the disk. Price those 86 at Maya's SSD, 2.3 GB/s, and the reads alone take 350 ms: under three tokens a second, before any compute. The engine actually pulled 19.9 GB/s off the array during decode, 77% of the 26 GB/s ceiling it measured for four Samsung 9100 PROs in RAID0. At 12.91 tokens a second that is about 1.5 GB a token, more than the 0.8 GB of experts that miss both tiers, because it reads ahead on predictions and not all of them are used. So 12.9 fits the cost model, and only because the "NVMe" is an array streaming about nine times what Maya's SSD does. A single fast drive at 7 GB/s caps the same token near 5 a second by bandwidth alone. The launch image says "4× NVMe" and "20 GB/s"; the post's text drops both.
The "16 GB of DDR4" is a container cap, too. The host is an EPYC 7443P with eight memory channels and 503 GiB; at the 16 GiB cap the CPU lane still computes about 168 of the 336 picks a token, many of them straight from a fresh NVMe read, on 22 server cores. A desktop with 16 GB and six cores is a different machine, and the repo has not measured one.
Where it disagrees with Maya is prefetch, and the disagreement is informative. Maya measured VRAM prefetch as a loss and left disk read-ahead off, because wrong guesses compete for its one NVMe. This engine runs layer l+1's actual router on layer l's input, reads the predicted disk-only experts one layer early, and in back-to-back runs at 55 GiB it cut NVMe misses from 40.2 to 21.9 a token and decode went from 14.21 to 16.04. With four drives there is bandwidth to spare for a wrong guess. Their docs also own a mistake I would have made: an earlier "prefetch off is 27-35% faster" result came from arms run hours apart, and session drift on that host is up to 17%.
What I would take from it
The engineering I would copy is the bookkeeping, not any one kernel. Per-layer partitions so a slot is never overwritten while a kernel reads it; promotion on the miss itself so the cache adapts every token; exclusive tiers so RAM never holds what VRAM already has; and a comment above each rule saying what it measured. The measured non-wins (prefetch, lookahead, a smarter eviction policy against a capacity limit) are as useful as the wins.
The number to plan around is not 40. It is the fraction of lookups that leave the GPU, and the price of each one: 0.62 ms over PCIe 3.0, 3.1 ms off a 2.3 GB/s SSD. If you have two 32 GB cards, put the money into RAM until the SSD tier is empty. If you have one 32 GB card, 64 GB of RAM and the CPU lane get you about 19 tok/s, which their README reports and the model reproduces. And if your card is new, expect the engine to be the bottleneck for a while; it has only ever been tuned on Volta.
How I checked
I shallow-cloned mw00/project-maya at 2b0f1a3 (v1.0.6) and Niko1221/Strata at d5ea713, compared their
trees by file hash, and read the GLM fast path, the prefill path, the device-side routing and fetch kernels, the
sparse-attention top-k, the installer and the quant tools; every file:line above is at those commits. I did not
build or run either. I read the three Maya-S GGUF headers and the vision projector's with HTTP range requests and
summed tensor sizes and parameter counts from their shapes and ggml type sizes; the model's dimensions come from
Z.ai's config.json. I checked llama.cpp's mmq.cuh at the commit Maya pins. The speeds, hit rates, KL and
task scores are the project's own, from README.md, CHANGELOG.md and bench/results/; the replies' numbers are
one person each and unverified. The tier model is mine: its sizes are from the headers, its per-expert costs and
pipeline factor from the engine's logs, and its skew is a least-squares fit to the engine's single-GPU sweep.
For the 3090 build I shallow-cloned sybil-solutions/glm53-flash-offload at df0b439 and read the README,
docs/how-it-works.md, docs/results.md, docs/reference.md and the raw files of the 16 GiB arm
(results/N129-s16-r48-16g/: cmd.txt, nvme_io.json, stats_end.json). The per-token tier split and CPU-lane
count are my division of that run's counters by its 3,841 decode steps; the speeds are the repo's own. I did not
run it.