2026-10-23 · 20 min · inference · kv-cache · sglang · hybrid-attention
A 1:52 narrated explainer, drawn in code. Every number and picture in it is this article's own; the sources are below.
› transcript
Hi, I'm Gusset! How SGLang avoids recomputing old conversations. The idea: do not throw an evicted prefix away. Keep it lower down, and load it back. The radix tree finds the longest prefix it has seen. If that prefix is still in GPU memory, it is reused at once. With write through, each new prefix is copied down to CPU memory. Then to shared storage, keyed by a hash of its tokens. On a storage hit, pages are prefetched to CPU, then loaded onto the GPU. On the GPU, the cache is grouped by layer, for attention. In CPU memory it is grouped by page, so a page is one write. What if a request is ready before its prefetch finishes? Best effort starts now and recomputes the rest. Wait complete waits for the whole prefix. Timeout waits up to a limit that grows with the prefix. Attention keeps a row per token, so any prefix is valid. A Mamba state is valid only at a checkpoint, so each checkpoint is backed up on its own. Here is the formula. In round r of the benchmark, all but the new question was seen before. Divide by the whole prompt. By round fifty five, that ceiling is ninety eight percent. GPU only falls off a cliff, then GPU plus CPU. Storage rides the ceiling. Effective throughput counts cached tokens as served. That is the fifteen point five times. Storage lets the hit rate reach the reuse that exists. The workload decides how much reuse that is. One tree, three tiers, and a hit rate the workload sets. Bye! Every source is in the full article. I'm Gusset. Bye!
Why read this
Notabletop 60%HiCache from the code, plus a tiered-cache simulation that reproduces its benchmark curves and shows the 98% hit rate is the workload's ceiling.
- Original analysis
- A lasting reference
- Concrete numbers to act on
Inference & servingNeeds datacenter GPUsApache-2.0Practitioner tool
How this was scored
- Is it new?
- 1 of 3: An incremental tweak
- Can I trust it?
- 2 of 3: Measures key facts from files, code or configs
- Can I run it?
- 2 of 3: Open code or weights with real limits
- Will I understand it?
- 2 of 3: Mechanism from first principles with figures
- Can I act on it?
- 2 of 3: A concrete recipe, numbers or comparison
- Will it last?
- 2 of 3: A reference for a year or more
- Does it affect many?
- 1 of 3: A specialist community
- Only here?
- 2 of 3: A teardown or measurement few others did
Score 63 of 100, ranked 268 of 607 rated articles. Each question is answered 0–3 by hand, and a 3 is rare. How articles are scored
Prefix caching has a capacity problem that gets worse with success. The more turns a conversation has, the more KV there is worth keeping, and the GPU's KV pool is the smallest memory in the box. A coding agent at turn 40 has a long, perfectly reusable history, and it is the first thing LRU throws out when 47 other agents are also talking.
SGLang's answer is HiCache, a hierarchical KV cache: GPU HBM is L1, CPU DRAM is L2, and an external store (Mooncake, DeepSeek's 3FS, NIXL, a file system) is L3. A prefix evicted from the GPU can come back from a lower tier instead of being prefilled again. Yichi Zhang's visual walkthrough on sglang.io is the occasion for this piece, and his post on X summarises it as "15.5× effective input throughput and ~98% cache hit rate in mass production serving". It is one of a series of interactive KV-cache posts he wrote for the SGLang site; two others matter here and are linked where they add something.
I read the code at 535aeae (2026-10-23), and I wrote a small simulation of the tiered cache to see where the headline numbers come from. Labels below: measured means I counted it in the code or computed it with my simulation; reported means the SGLang team's figure, not re-run; reasoned means my arithmetic on the other two.
- license
- Apache-2.0
- branch
- main
- tests
- 3134 files
- source
- 3.0 MB
- commit date
- 2026-09-19
by size of tracked source at this commit, file counts in brackets; docs, data and vendored trees excluded
local clone, 2026-09-22 at 3a64faa — branch, commit, commitDate, fileCount, hasTests, languages, license, licenseFile, shallow, testFileCount
shallow clone: counts describe the pinned tree, not the history
| Tiers | L1 GPU HBM · L2 pinned CPU DRAM (--hicache-ratio × the GPU pool, default 2) · L3 external storage |
| The index | one radix tree over token prefixes; each node records where its KV lives in each tier |
| Write policies | write_through, write_through_selective (back up on the second hit), write_back (back up on eviction) |
| Prefetch stop policies | best_effort, wait_complete, timeout (1.0 s + 0.25 s per 1,024 tokens by default) |
| Host layouts | layer_first, page_first, page_first_direct, page_head, page_unified |
| L3 backends registered | 13: file, sim, nixl, mooncake, npu_memcache, hf3fs, aibrix, eic, simm, mori, shm, tensorcast, seaweedfs |
| Hybrid state | FULL, SWA and MAMBA components on one tree; Mamba checkpoints and SWA windows are backed up and restored like KV |
Why a hierarchy, and why it is not free
The reuse rule is the one RadixAttention always had: KV for a token depends on every token before it, so you can reuse KV only for an identical prefix. The earlier SGLang source read covers the radix tree itself. HiCache keeps that tree and changes what a node is allowed to point at.
A lower tier only helps if two things hold. Loading the prefix must be cheaper than recomputing it, and the loaded state must be enough to continue the model from there. The first is a bandwidth question: H200 prefill is fast, PCIe is not, and a network store is slower still. The second turns out to be the hard part for hybrid models, because a Mamba layer's history is not a per-token tensor you can slice.
One tree across the tiers
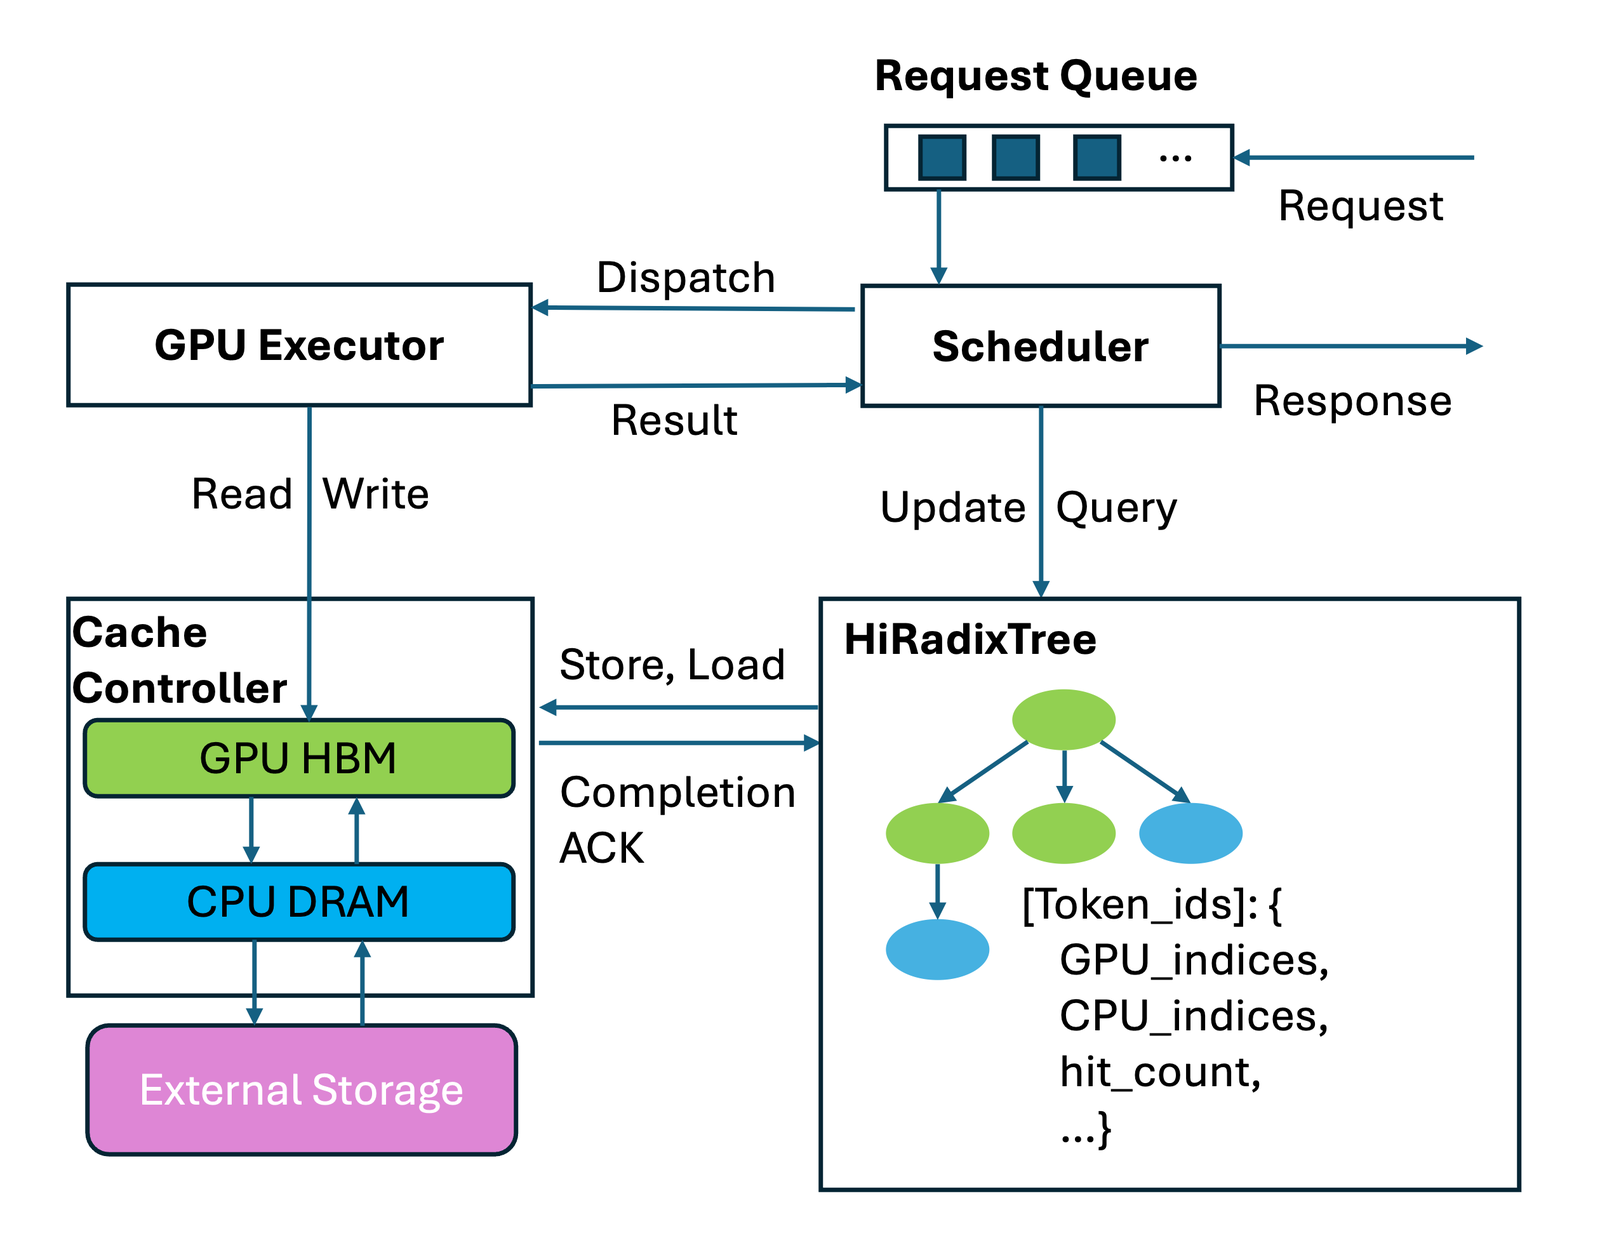
In 2025 this was a separate class, HiRadixCache. At 535aeae HiCache lives inside UnifiedRadixCache (3,959 lines in mem_cache/unified_radix_cache.py), with the bookkeeping in unified_cache/unified_tree_core.py and the byte movement in HybridCacheController (measured).
Each tree node carries, per component, a device value (indices into the GPU pool) and a host_value (indices into the host pool). A node with no device value but a host value is a prefix that has left the GPU and survives on the host. Matching tracks two answers in one walk: the deepest node usable on the device, and the deepest usable on device or host. The difference is what has to be loaded.
L3 is not in the tree; it is addressed by content. Each page's key is a SHA-256 chain, the hash of the page's tokens seeded by the previous page's hash (get_hash_str in mem_cache/utils.py, a small C++ binding over OpenSSL), optionally seeded by a namespace from extra_key and cache_salt so tenants never share keys. It is the parent-chaining trick the vLLM read explains for block hashes, and it is what lets many serving instances share one L3: the same token prefix derives the same keys anywhere.
Eviction is per tier and leaf-only. When a leaf goes, its parent becomes a leaf with an older timestamp (matched paths are stamped decreasing towards the root), so a cold conversation drains from its tail. The resident part of any one history, in any one tier, is therefore always a prefix of it. That matters later.
Writing down: three policies
When does KV get copied from GPU to host? HiCacheController accepts exactly three values and raises on anything else (measured):
write_through: back up on insert. In the tree core this iswrite_through_threshold = 1: the first time a node is inserted or hit, it is queued for a device-to-host copy. Most protection, most PCIe traffic.write_through_selective: the controller's default, threshold 2. A node is backed up on its second hit, so a one-off prompt never costs host bandwidth.write_back: back up only at eviction. Hit counting is skipped entirely (_inc_hit_count_and_checkreturns early), and after each GPU eviction pass the cache callswriting_check(write_back=True).
The copy is asynchronous: write() allocates host slots, queues a CacheOperation on a device-to-host stream, and the node is marked backed up only when the completion event is acked. A fence stream keeps the copy from reading a page the next forward pass is still writing.
The benchmarks below use write_through, so the host holds everything the GPU holds and, at the default ratio, as much again.
Reading up: prefetch and its stop policy
A hit in L2 is cheap to use. A hit in L3 has to come into host memory first, and storage latency is high and unpredictable. So when a request arrives and its prefix is found in L3, the controller starts a prefetch into host memory right away, while the request is still waiting in the queue, overlapping the read with whatever the GPU is doing for other requests. Prefixes shorter than 256 tokens are not worth the round trip and are not prefetched (storage_prefetch_threshold, measured).
The interesting case is the request that reaches the head of the queue before its read finishes. _can_terminate_prefetch decides:
best_effortterminates the read now and uses whatever pages have landed.wait_completenever terminates; the request waits for the whole prefix.timeoutterminates once the wait exceedsprefetch_timeout_base + pages × prefetch_timeout_per_page. The defaults are 1.0 s and 0.25 s per 1,024 tokens, converted to a per-page figure instorage_attachment.py(measured).
The timeout is decided on pipeline rank 0 and all-reduced with MAX across tensor-parallel ranks, because wall clocks differ and every rank must cut the same prefix. Distributed agreement is most of the code here.
Which policy wins depends on two rates: how fast storage delivers, and how fast the GPU would recompute. The widget is a deliberately plain model of that choice, with SGLang's default timeout constants.
With a slow store and a fast prefill, best_effort wins; with a long prefix and a decent store, wait_complete does. timeout is a hedge whose budget grows with the prefix, the right shape, since a longer prefix is both slower to read and dearer to recompute. The DeepSeek-V4-Flash benchmark below uses wait_complete.
Page layout and the copy kernel
The GPU pool is layer-first: the attention kernel for layer 3 wants all of layer 3's KV together. Storage wants the opposite: one object per page holding every layer, so a page is one large write. If the host pool copied the GPU's layout, writing a page to L3 would gather from as many places as there are layers.
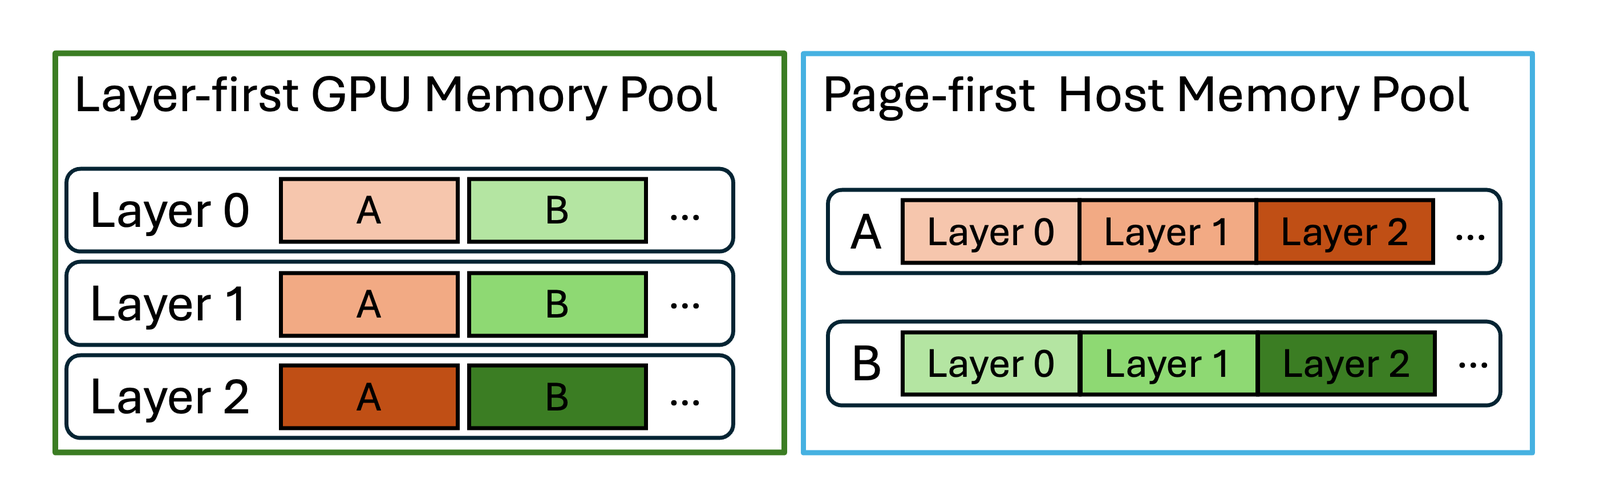
So the host pool has its own layout, converted during the GPU-host copy. In pool_host/mha.py the page_first host buffer is shaped (2, size, layer_num, head_num, head_dim) against (2, layer_num, size, head_num, head_dim) for layer_first (measured). The blog reports up to 2× host-storage throughput from page-first plus zero-copy, where the storage client reads straight out of the registered host pool.
The GPU-host copy is not cudaMemcpyAsync. The pinned host pool is mapped into the GPU's address space (cudaHostGetDevicePointer in kernels/aot/csrc/kvcacheio/transfer.cu), and a kernel assigns one warp per token item: each lane loads 8 bytes with ld.global.nc and stores with st.global.cg, with offsets computed per layer from the two layouts. A scattered set of tokens becomes one launch instead of many small copies. The blog reports up to 3× the cudaMemcpyAsync throughput; I did not measure it.
Loads overlap with compute layer by layer. LayerDoneCounter keeps one CUDA event per layer, and the forward pass waits on layer i's event just before layer i's attention, so layer 0 computes while later layers are still crossing PCIe. An L3 page arrives whole, not layer by layer, which is why L3 always lands in host memory first.
Hybrid models: state that is not per token
Full attention is easy to tier: KV for token t is a fixed-size row, and any prefix of rows is a valid cache. Two other kinds of state break that, and both are now first-class in the Unified Radix Cache, which treats FULL, SWA and MAMBA as components on one tree. The LMSYS write-up has the benchmark commands; the interactive version on sglang.io steps through a node split and a copy-on-write checkpoint, which is the quickest way to see the voting below.
Sliding-window attention only needs the last W tokens. Older SWA slots can be freed while the node stays in the tree as a tombstone, and a prefix is reusable for SWA only if a full trailing window is present.
Mamba and linear attention keep one recurrent state, overwritten every token. You cannot slice it, only snapshot it at a prefix end; a checkpoint is valid at exactly one boundary, and reusing it means copying it into a private slot first (copy-on-write, in components/mamba.py). The ReplaySSM piece counts why these states are expensive to move.
Matching therefore becomes a vote. Each component builds a validator, the walk follows the FULL path, and the reusable boundary only advances to a node that every validator accepts. The storage interface carries the same idea down to L3: batch_exists_v2 takes a list of PoolTransfers, and each pool states a PoolHitPolicy, either ALL_PAGES (every page of the prefix must exist, as for DeepSeek's DSA indexer) or TRAILING_PAGES (only the last few pages, as for Mamba and SWA state). The usable L3 prefix is the minimum across pools, so a missing Mamba checkpoint shortens the hit even when every KV page is there.
Before any of this reaches the host, the GPU has to hold both kinds of state, and fixed pools waste memory: many short requests need many state slots and little KV, a few long ones the reverse. The series' Unified Memory post puts recurrent states and KV in one GPU buffer growing from opposite ends, and reports that allocation-aware eviction on top of it kept 19 of 28 prefixes instead of 10 and cut returning requests' total time from 4.105 s to 2.548 s (Qwen3.5-4B on an RTX 5090; reported, not re-run). It is relevant to the Inkling result below, where fixed pools look like the limiter.
The HiCache post describes a bug the checkpoint rule exposed. Backup fired when a node was inserted, and a node whose KV was already on the host was skipped. A request that branches off a shared document creates a new Mamba checkpoint on a node that already existed, so the checkpoint stayed on the GPU with no path to the host. PR #33639 backs up a missing snapshot separately. The team reports that in its branch-backup test, full recovery of a 6.4K-token shared prefix went from 1 in 10 requests to 10 in 10, and token hit rate from 15.74% to 64.00%; with 3.6K new tokens per request, 64% is exactly the whole shared prefix (reasoned).
The storage interface
The 2025 post said a backend needs only get, exists and set. At 535aeae the abstract base HiCacheStorage has five abstract methods (get, batch_get, set, batch_set, exists), two marked TODO: Deprecate, and the real traffic goes through batch_exists_v2, batch_get_v2 and batch_set_v2 with the per-pool descriptors above (measured). Scheduling, batching at 128 pages per call, rank agreement and retries stay in the controller.
Thirteen backends are registered in storage/backend_factory.py, and the factory can import any other class by module path. HiCache is the scheduling and recovery layer; storage is pluggable underneath. Contrast the DeepInfer release, which describes DeepSeek's KV storage but leaves it out of the code.
Checking the numbers
Where 15.5× and ~98% come from
Both numbers come from one benchmark, written up in full in the Unified Radix Cache post (reported): DeepSeek-V4-Flash, TP4 on 4 H200s, benchmark/hicache/bench_multiturn.py with 48 clients, 60 rounds, 4,096 input and 16 output tokens per turn, a round barrier, and three configurations, L1 only, L1 plus host L2, and L1 plus L2 plus a 500 GiB Mooncake Store as L3. A second model, Inkling-Small on 8 H200s, ran 64 clients for 30 rounds.
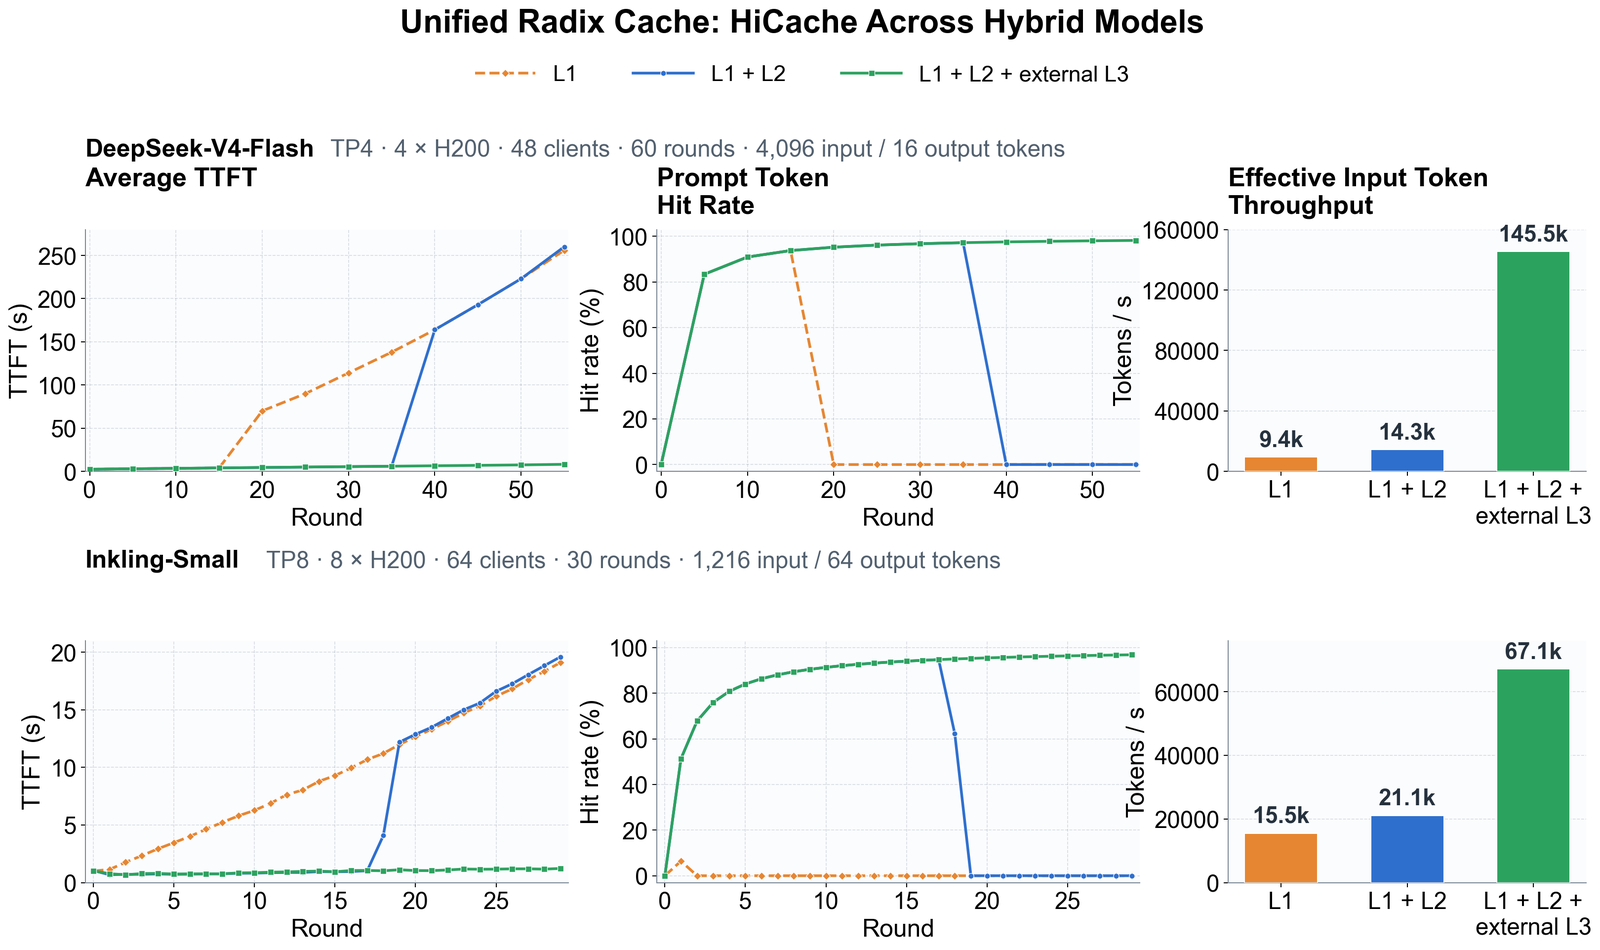
The arithmetic is straightforward. 145.5K ÷ 9.4K is 15.5 (reasoned), so the headline is L3 against GPU-only. Against the L1+L2 configuration, which is what HiCache without storage gives you, it is 145.5K ÷ 14.3K, about 10.2×. On Inkling-Small the same comparison is 67.1K ÷ 15.5K, about 4.3× (reasoned).
"Effective input throughput" is defined in bench_multiturn.py as the sum of complete prompt lengths divided by wall-clock time (measured). Cached tokens count as served, which the URC post says plainly: it "credits cache-hit prefix tokens". It is a fair measure of serving progress, not prefill throughput. The run totals 361,152,000 prompt tokens (reasoned: 48 clients × the sum over 60 rounds of 4,096(r+1) + 16r).
"In mass production serving" does not hold
The post says the numbers were achieved "in mass production serving". The blog it links says "In a DeepSeek-V4-Flash multi-turn benchmark", and the workload is synthetic: bench_multiturn.py draws random token ids, uses a fixed seed (20260626), and runs a round barrier. The URC post thanks teams for "validating large-scale production deployments" but gives no production hit rate or throughput. The production figures that exist are older, user-quoted in the 2025 post (reported): Novita AI saw hit rate go from 40% to 80% and TTFT drop 56% on a coding-agent workload with 3FS; Ant Group saw an 84% TTFT reduction on cache hits with Mooncake.
Why the hit rate is ~98%
This one is a property of the workload. In round r (counting from 0), a client's prompt is its whole history plus a fresh 4,096 tokens: 4,096(r+1) + 16r tokens. Everything except the fresh question was seen before, r × 4,112 tokens. So no cache can hit more than
of round r's prompt. At round 5 that is 83.3%, at round 10 it is 90.9%, at round 55 it is 98.2% (reasoned). Those are, to the point, the values the published L3 curve passes through: about 83% at round 5, 91% at round 10, about 98% from round 40 on. The L3 configuration does not get "near 98%" by being clever about what to keep. It gets there by keeping everything, and 98% is what everything is worth here. On Inkling-Small, with 1,216 new and 64 output tokens a turn, the same formula at the last round (29) gives 37,120 ÷ 38,336 = 96.8%, which is exactly the reported final hit rate (reasoned).
That is not a criticism. A storage tier's job in a growing-history workload is to make the hit rate equal the reuse that exists. It is a reason not to expect 98% on your traffic, where the ceiling is how much of each prompt repeats.
A simulation of the tiers
To see whether the curves follow from the mechanism, I wrote a small simulation of the tiered cache (about 60 lines of Python, mirrored in the widget below). It models what I read in the tree core: per-tier leaf-only eviction, so each tier holds a prefix of each history and the least recently used history drains first; write-through to L2 and L3 at insert; L2 at --hicache-ratio × L1; an unbounded L3; hits floored to 64-token pages. It replays the benchmark's workload exactly and ignores concurrency, locking and transfer time. It ran in 0.2 s on the shared 4-core cloud VM, CPU only (measured).
The only free parameter is the GPU pool size. Setting it to 18 rounds of every client's history, about 3.55M tokens, puts the L1 cliff where the figure shows it. Then, with nothing else tuned (measured, my simulation):
| round | L1 | L1+L2 (ratio 2) | L1+L2+L3 | ceiling |
|---|---|---|---|---|
| 5 | 83.3% | 83.3% | 83.3% | 83.3% |
| 15 | 93.7% | 93.7% | 93.7% | 93.7% |
| 18 | 18.7% | 94.7% | 94.7% | 94.7% |
| 19 | 0.0% | 95.0% | 95.0% | 95.0% |
| 35 | 0.0% | 97.2% | 97.2% | 97.2% |
| 37 | 0.0% | 0.0% | 97.4% | 97.4% |
| 55 | 0.0% | 0.0% | 98.2% | 98.2% |
Two things in the published curve fall out of the mechanism. First, the collapse is a cliff, not a slope. With a round barrier, clients are served in the same order every round, so the history the next request needs is always the least recently used one, and once the working set exceeds the pool, LRU evicts exactly that. It is the textbook way LRU fails on a cyclic access pattern. Second, the L1+L2 cliff lands at twice the round of the L1 cliff (round 36 against 18 here; the figure shows the drop between rounds 35 and 40 against 15 and 20) because the host pool is twice the GPU pool and write-through makes it hold everything the GPU does. I did not fit that; it follows from --hicache-ratio 2.
Over the whole run, my simulation has the L1 configuration prefilling 330.3M of the 361.2M prompt tokens and the L3 configuration 11.9M, 27.8× fewer (measured, my simulation). The reported throughput gain is 15.5×. The gap is what my model leaves out, all of it real cost: cached tokens are still attended over, every L3 hit crosses the network and PCIe, and wait_complete makes requests wait for it. The reported 15.5× is consistent with the mechanism and well short of its prefill-only ceiling (reasoned).
One thing my simulation does not explain. On Inkling-Small the GPU-only hit rate falls to zero by round 2, when 64 clients have only about 164K tokens of history and the run caps the full-attention pool at 750,080 tokens. The run also passes --swa-full-tokens-ratio 0.1 and --mamba-full-memory-ratio 0.1, so the SWA and Mamba pools are a tenth the size of the full-attention one. Since a hybrid hit needs every component to vote yes, a small Mamba or SWA pool is the likely limiter, but that is reasoned, not checked.
The 2025 long-context numbers
The older evaluation is a different shape of workload, long documents asked several questions (LooGLE), on DeepSeek-R1 across 8 H20-3e GPUs with 3FS as L3.
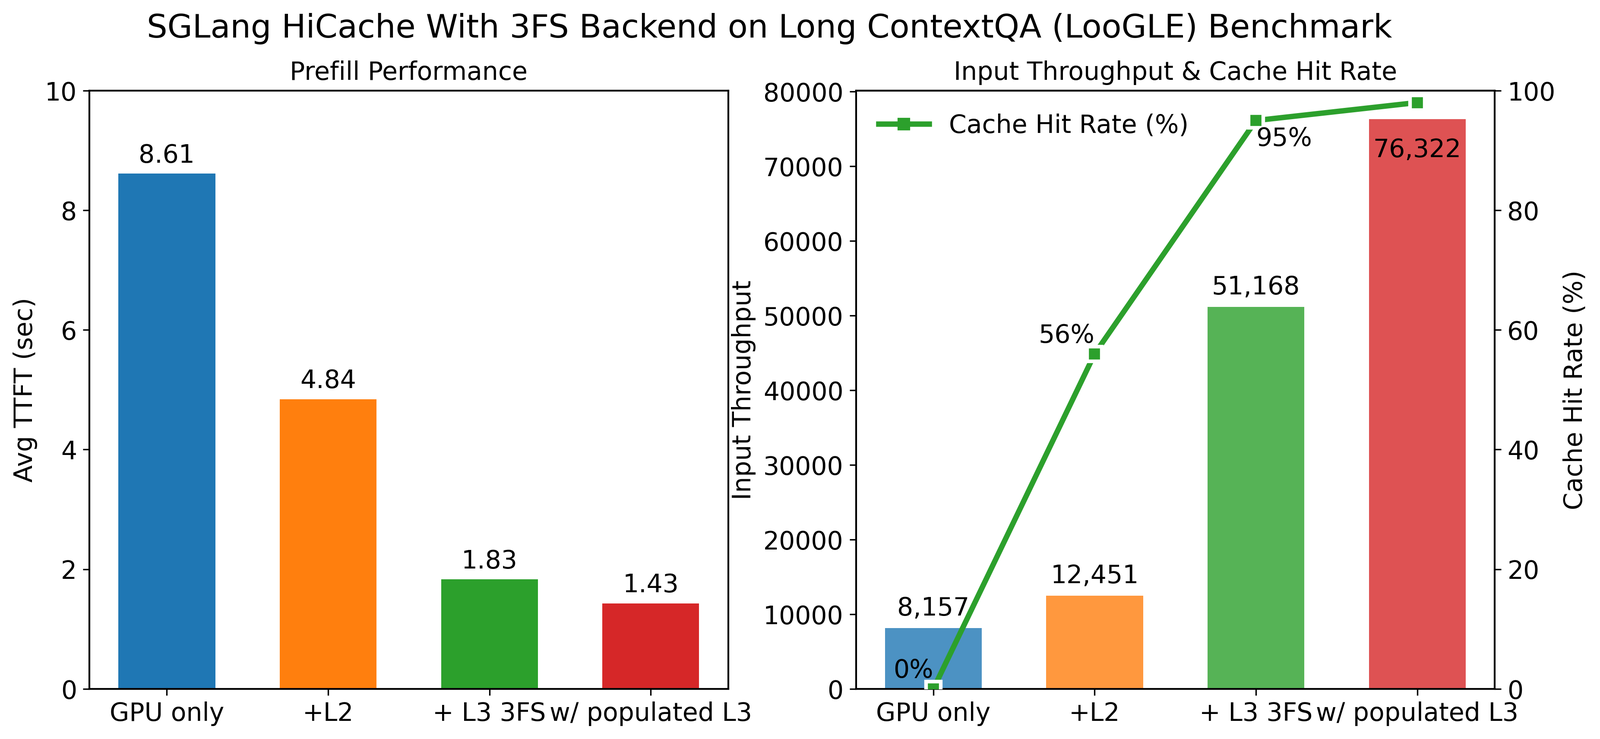
The blog's "78.7% lower TTFT" is (8.61 − 1.83) ÷ 8.61 (reasoned), and the 2025 post's "up to 6×" is 51,168 ÷ 8,157, about 6.3× (reasoned). The 76,322 figure needs L3 filled before any request arrives, which is a warm-start number, not a steady-state one.
What I ran, and what I did not
I did not run HiCache. Installing SGLang, even CPU-only, pulls in PyTorch, which alone would have eaten most of this piece's 1 GB scratch budget, and the cache does no real work without a GPU. The repo ships CPU unit tests for this code (test/registered/unit/mem_cache/: write-back ordering, file-backend LRU, Mamba side states), the place to start if you change it. What I ran is the simulation, which reproduces the hit-rate side of the benchmark and none of its timing. The kernel's 3× and the layout's 2× are reported.
Takeaways
HiCache is a memory hierarchy with one index: the radix tree knows where each prefix lives on GPU and host, and L3 is content-addressed by chained page hashes so instances can share it. The engineering is in the movement, the page-first host layout, the warp-per-token copy, layer-by-layer overlap and a prefetch whose stop policy bets storage speed against prefill speed, and in hybrid state, where a Mamba checkpoint must travel as its own object.
The headline numbers describe a benchmark honestly and production not at all. The ~98% is what a 60-round conversation allows when nothing is evicted, and the 15.5× credits cached tokens. On your traffic the ceiling is how much of each prompt is a byte-identical repeat, which is what the prompt-caching harnesses piece is about.