MegaBake: a PyTorch model compiled into one CUDA kernel, and what its 5.5× is measured against
mdjsonmcp2026-10-19 · 15 min · kernels · cuda · compilers · inference · small-models · benchmarks · gpu
A 1:41 narrated explainer, drawn in code. Every number and picture in it is this article's own; the sources are below.
› transcript
Hi, I'm Tenon! MegaBake takes a PyTorch model and bakes a whole decode step into one GPU kernel. Here's how that works. A small model at batch one spends most of each token launching kernels. So launch once, and let blocks that never exit walk a table of every step. Dynamo captures the model, and Inductor's own passes clean up the graph. MegaBake takes that graph and stops Inductor there. It groups the operations into regions, picks a body for each, and writes every step of the token as a row in one table. One kernel launches sixty blocks, one per processor, and they all walk the same table. Each row names a body: a matrix tile, a norm, or attention. A grid barrier closes each interval before the next rows begin. The usual way launches hundreds of kernels per token, and at batch one the host's launch time dwarfs the work. MegaBake launches once. Blocks synchronize with barriers, and tiny steps like norms are recomputed by every block, so they need no barrier of their own. The repo's own numbers. End to end, the single launch wins by about five times. But on GPU time alone, Inductor's kernels are slightly faster, and its baseline ran without CUDA graphs. So the win today is launch overhead. To beat CUDA graphs too, a megakernel has to overlap work across its barriers, and that is next on the roadmap. Graph in, one kernel out. Sixty blocks walk a table. Faster end to end, not yet on the GPU. Every source is in the full article. I'm Tenon. Bye!
Why read this
Notabletop 60%Runs MegaBake's planner on CPU to show the one-kernel schedule, and shows the 5.5× is launch overhead against a baseline with no CUDA graphs.
- Original analysis
- A new technique
- Concrete numbers to act on
GPUs, kernels & systemsNeeds datacenter GPUsMITPractitioner tool
How this was scored
- Is it new?
- 2 of 3: A real new idea, method or capability
- Can I trust it?
- 2 of 3: Measures key facts from files, code or configs
- Can I run it?
- 1 of 3: API-only, gated or restrictive licence
- Will I understand it?
- 2 of 3: Mechanism from first principles with figures
- Can I act on it?
- 2 of 3: A concrete recipe, numbers or comparison
- Will it last?
- 1 of 3: Relevant for months
- Does it affect many?
- 1 of 3: A specialist community
- Only here?
- 2 of 3: A teardown or measurement few others did
Score 60 of 100, ranked 324 of 577 rated articles. Each question is answered 0–3 by hand, and a 3 is rare. How articles are scored
On 17 October Ayush Satyam posted that MegaBake, "a PyTorch native automated mega-kernel compiler", finally looked decent. His gemma-2b megakernel had started at 0.3× the speed of torch.compile, SmolLM-135M had been the "perfect oracle model" for every experiment, and a set of Qwen models and a DeepSeek drafter all came out ahead. The last line: "I still can't believe we getting 5.5x on SmolLM."
Two replies matter more than the post. Asked how, he wrote: "Mostly saving up on launch overheads." Asked whether the baseline was tuned, he wrote: "The current numbers are against default torch.compile (plus reduce-overhead for prefill)... On raw GPU compute time, Inductor is actually slightly ahead on the SmolLM models, so I expect the honest comparison to be much closer." That is the author doing the article's job for it. What follows explains how MegaBake turns a model into one kernel, which parts of that I could run without a GPU, and why the arithmetic of a 135M model at batch 1 makes 5.5× both believable and narrow.
- license
- MIT
- branch
- main
- tests
- 42 files
- source
- 1.4 MB
- commit date
- 2026-10-18
by size of tracked source at this commit, file counts in brackets; docs, data and vendored trees excluded
local clone, 2026-10-19 at f70b54c — branch, commit, commitDate, fileCount, hasTests, languages, license, licenseFile, testFileCount
What a megakernel is, and why small models want one
A decode step for a 30-layer Llama-style model is a few hundred small operations: per layer, an RMSNorm, three projections, RoPE, attention, an output projection, a residual add, another norm, gate and up projections, SiLU, a down projection, another add. Eager PyTorch launches a kernel for most of them. torch.compile (Inductor) fuses the elementwise ones and still launches a few hundred. Each launch is host work: Python, the dispatcher, the driver, and a few microseconds on the GPU to ramp up and drain.
For a big model at a big batch that overhead hides behind the weight reads. For a small model at batch 1 it does not. SmolLM-135M has 134,515,008 parameters (reasoned, from its config: 576 hidden, 1,536 intermediate, 9 query heads, 3 KV heads, 30 layers, a 49,152-token vocabulary, tied embeddings). In bf16 a token reads about 269 MB of weights. At the ~2.2 TB/s the repo measured on its GPU slice, that is 0.12 ms (reasoned; the repo's ROADMAP also gives "about 0.12 ms"). If the host needs 20 µs to launch each of 540 kernels, the call takes 10.8 ms and the memory bus is busy for one percent of it.
There are two standard fixes:
- CUDA graphs record the launches once and replay them with one submit. The kernels stay separate, so each still ramps and drains, but the host disappears. MegaBake's own measurement on its first MLP fixture puts the gap between replayed kernels at about 0.25 µs (reported).
- A megakernel launches once and never returns. One CTA per SM stays resident and works through a list of tasks, synchronizing through global memory. That removes the host and the per-kernel ramp, and lets the next operation start on whatever SM is free. It also makes every synchronization your problem. Hazy Research's hand-written Llama-1B megakernel and Mirage's persistent kernel (MPK) are the reference points, and MegaBake's README names Mirage as its main reference architecture. The Kimi K3 TPU megakernel is the same idea on a TPU, written by hand for one model.
MegaBake's pitch is the word "automated": take any captured PyTorch graph and compile it, rather than hand-writing a megakernel per architecture.
How a model gets in: Dynamo, then Inductor's passes, then stop
The user-facing API is an ordinary torch.compile backend:
compiled = torch.compile(model, backend=megabake.make_backend(), fullgraph=True)frontend.py pins PyTorch 2.14 and drives the standard path: Dynamo captures the call, AOT autograd functionalizes it, and Inductor's own pre-grad and post-grad FX passes run (_recursive_post_grad_passes, select_decomp_table). Then MegaBake takes the post-grad FX graph and stops. It never calls Inductor's lowering or code generation. It keeps PyTorch's wrappers for guards, aliases, mutations and outputs, so the compiled callable behaves like any other torch.compile result. The README is candid that this handoff is "an owned integration with Inductor internals, not an assumed stable public API".
From there, measured on my run (below) and named in ROADMAP.md:
- Import. Every FX node becomes an op with a tensor program: output domain, reduction domain, indexed loads, a scalar expression and the casts in it. Lowering is hand-written per ATen op; the ROADMAP counted 67 covered ops before its step 5 added whole primitive families (views, scatters, padding, more pointwise).
- Regions. Matchers group ops into named regions where they can (
rms_norm,rope,embedding, a fused SiLU·mul) and leave the rest as generic elementwise, reduction, copy or gather regions. - Body selection. Each region gets a device body from a small catalog. GEMMs get a tuned Hopper TMA/WGMMA body adapted from CUTLASS's persistent GEMM. At decode, with one token, it uses Mirage's swapAB trick: the weight goes on WGMMA's 64-row M side and the tokens on N, so a tile is 64 weight rows rather than 64 rows of mostly padding. Attention is a declared op,
megabake::kv_attention, registered through transformers'AttentionInterfaceso that any Hugging Face attention module routes to it. - Schedule. Regions become phases. Phases with no dependency between them share a barrier interval; a grid barrier closes it. Small producers (norms, residual adds, SiLU) are folded: rather than taking an interval of their own, every CTA recomputes them in full at the start of the consumer's interval.
- Storage. A memory planner assigns intermediates to slices of one workspace by live range.
- Emit. The plan becomes one Python module in NVIDIA's CuTe DSL (
@cute.kernel def megabake_kernel), whichcute.compileturns into a single cooperative kernel.
The kernel at the end of step 6 is table-driven, and that design choice makes "any model" plausible. The generated source has one function per distinct body and a loop:
for phase in cutlass.range(633, unroll=1):
    variant = phase_table[phase, 0]
    _rotated = (_block + workers - phase_table[phase, 2]) % workers
    ...
    if variant == 0:
        _body_0(work_iterators[0], _rotated, _thread, _workers, (_slot(addresses, phase_table, phase, 0, ...), ...))
    ...
    if phase_table[phase, 1] != 0:
        counting_grid_barrier(ready, workers, _ordinal + phase_table[phase, 1])
Each phase is a row in a device table: which body, which barrier ends it, how to rotate its work across CTAs, and which slots of a device address table hold its tensors. The barrier is an arrival counter that only grows. Each CTA does one release-add, then spins on acquire loads until the counter reaches (ordinal + 1) × workers. The README reports it at ~0.7 µs with 60 CTAs. Because the per-call addresses are written into the table by block 0 at the start of the kernel, nothing about the model's depth is baked into the code.
What I ran, on a CPU
The repo's GPU path needs an SM90 device and CUDA 13. I had a shared 4-core cloud VM with no GPU, so I installed it into a Python 3.12 venv with torch 2.14.0+cpu, nvidia-cutlass-dsl 4.8.0 and transformers 5.18.0 at commit f70b54c (18 October), and ran only what does not touch a device.
- Tests (measured).
tests/unit: 161 passed in 77 s.tests/integration: 3 passed, 5 skipped for want of a GPU. Nothing undertests/gpuran. - The planner on SmolLM-135M decode (measured). I built the repo's own
StatefulSmolLMArchitecturefixture at 30 layers with random bf16 weights and a 128-token KV cache, exported it, and ran capture, region formation, body selection, scheduling, storage andemit_cutewith the target facts the unit tests use (SM90, 60 SMs). This is everything up tocute.compile. It took 53.5 s.
What came out:
| Stage | Count (measured) |
|---|---|
Post-grad FX call_function nodes | 3,673 |
| Compute-graph ops | 3,583 |
| Regions, one phase each | 633 |
| GEMM phases (7 per layer plus the vocabulary head) | 211 |
| Grid barriers, unfolded | 333 |
| Grid barriers, folded (the shipped policy) | 183 |
| Distinct device bodies in the source | 18, plus 5 GEMM variants |
| Generated CuTe source | 1,638 lines, 90 KB |
| Launch | 60 CTAs × 256 threads, cooperative |
The barrier counts match the ROADMAP's "135M decode barriers 333 → 183" exactly, and the arithmetic is clean: 11 intervals per layer before folding, 6 after, times 30 layers, plus 3 for the embedding and the vocabulary head (reasoned). One thing I did not expect: the 2-layer and 30-layer builds produce source of the same length, 1,638 lines. Depth lives in the 633-row phase table, not in the code. (The fixture unties the embedding, so its random model has 163M parameters rather than 135M; that changes the size of one GEMM, not the shape of the plan.)
The planner also says how much of the GPU each interval uses. Here is one middle layer, phase by phase, from that run:
Read the counts in that widget as text if you are not running JavaScript. With folding, a layer is six intervals. (1) Every CTA recomputes the residual add and RMSNorm, then 9 + 3 + 3 CTAs run the Q, K and V tiles: 15 of 60 busy. (2) RoPE on Q and K: 7 CTAs. (3) Decode attention, one CTA per query head row: 9. (4) Output projection: 9 tiles. (5) Recompute add and norm, then gate and up: 24 + 24 = 48. (6) Recompute SiLU·mul, then the down projection: 9. Unfolded, the add, the norm and the SiLU each take an interval of their own, often on 1 to 12 CTAs. Only the vocabulary head, 768 tiles, fills all 60.
That is the honest shape of batch-1 decode on a 576-wide model. There is not enough work in a layer to fill 60 SMs, so the schedule is a chain of short, mostly empty intervals, and each one pays a barrier plus the start-up and drain of its bodies.
Checking the 5.5×
The post's image is the headline:
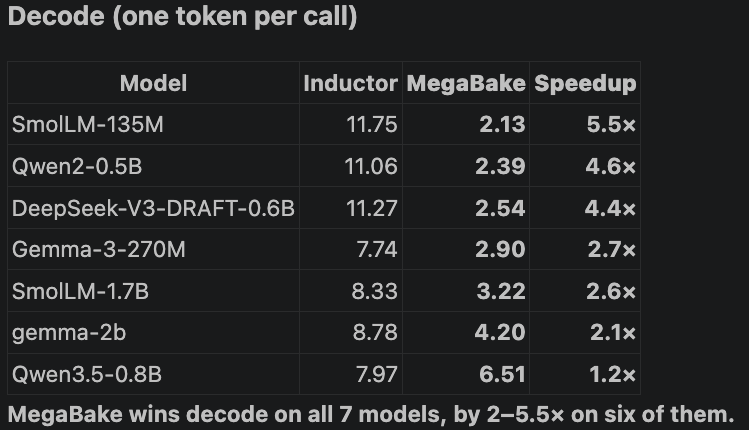
The README carries the measured version for three models, with the method spelled out: an H200 MIG 3g.71gb slice (60 SMs, ~2.2 TB/s), bf16, 40 warm calls, KV capacity 128, medians in µs. "Call" is a synchronized complete call; "kernel" is profiled GPU time of one call.
| Model | Inductor call | MegaBake call | Inductor kernels | MegaBake kernel |
|---|---|---|---|---|
| SmolLM-135M | 11,575 | 2,135 | 1,384 | 1,503 |
| SmolLM-1.7B | 9,568 | 3,318 | 2,421 | 2,983 |
| Qwen2-0.5B | 10,178 | 2,282 | 1,650 | 1,578 |
All reported. The README's ratio for 135M is 5.42× (reasoned, 11,575 ÷ 2,135); the post's 11.75 and 2.13 come from a slightly different run. Four facts are in the README's own text:
- The baseline is default Inductor without CUDA graphs. "Inductor skips CUDA graphs in decode because the KV caches are mutated inputs." The prefill column does use CUDA graphs, and there MegaBake is about even at 4 tokens and slower above that.
- The call is host-bound. Inductor's 11,575 µs call contains 1,384 µs of kernels. The README says MegaBake "wins end to end because Inductor makes 450–630 launches on a slow host". If 135M sits mid-range at about 540 launches, that is roughly 21 µs of host per launch (reasoned). That is slow even for Python dispatch, and it is the whole story of the 5.5×.
- On GPU time Inductor wins on both SmolLM models: 1,384 against 1,503 µs on 135M (MegaBake 8.6% slower, reasoned), 2,421 against 2,983 µs on 1.7B (23% slower). Qwen2-0.5B is the one model where the megakernel is faster on the GPU, by 4.4%.
- MegaBake's own call is not free. 2,135 − 1,503 = 632 µs of host per call (reasoned), which matches the ROADMAP's breakdown: about 360 µs of MegaBake binding plus about 290 µs of Dynamo guards over 365 inputs. Back-to-back calls overlap that with the previous kernel, and the README reports 1,498 µs per call pipelined: almost exactly the kernel time.
So the measured result is this. A one-launch kernel beats a 540-launch call by about the launch overhead, and on GPU time it lands within 9% of Inductor's fused kernels on 135M. The comparison nobody has run yet is the one that matters: the same Inductor kernels replayed as a CUDA graph, with the KV cache held as static module state so capture is legal. The author says that run (StaticCache, max-autotune, coordinate-descent tuning) is coming. Until then, here is the arithmetic:
The calculator's default preset is fitted to the repo's own 135M numbers, and every per-unit cost in it is reasoned, not measured. At 540 launches and 21 µs each, the per-op path costs 11.3 ms. Spread Inductor's 1,384 µs of kernels over 540 kernels after the 122 µs memory floor and each kernel carries about 2.3 µs of fixed GPU cost. Spread MegaBake's 1,503 µs over its 183 intervals and each interval costs about 7.5 µs, against 0.7 µs for the barrier and about 0.67 µs of average weight streaming (122 µs ÷ 183). Replay the Inductor kernels as a CUDA graph and the model puts them at about 1.50 ms, the same as the megakernel. Drop host launches to 5 µs and the per-op path falls to 2.7 ms, and the 5.5× becomes about 1.8×. Bring the megakernel's interval cost down to 3 µs and it reaches 0.67 ms, about 2.2× ahead of a CUDA graph.
That last preset is the real case for the project, and MegaBake's ROADMAP aims at it: event counters per phase instead of grid barriers (step 10, not started), cross-phase L2 prefetch of the next GEMM's weights while a CTA waits (step 9, not started), and fewer serial steps per layer. A megakernel's advantage over a CUDA graph is not the launch. It is overlap: one layer's tail running beside the next layer's weight fetch, which separate kernels cannot do. Today's MegaBake does not overlap anything across a barrier, and with 7 to 48 of 60 SMs on distributed work per interval, there is plenty of room.
Where it breaks today
From the README and ROADMAP, all reported:
- SM90 and bf16 only, and static shapes.
megabake.bucketedserves variable lengths through a few compiled sizes and checks that padding cannot change real outputs. - Prefill is slow above ~64 tokens. At a 300-token prompt (512 bucket) the 135M kernel takes 54,095 µs against 2,579 µs for Inductor with CUDA graphs, 21×. Prefill attention is a first-generation body, one warp per query row.
- Compile time: 26 s for 135M decode, 41 minutes for SmolLM-1.7B's 512-token prefill bucket, mostly Python tile bookkeeping.
- Coverage is per op. Qwen3.5's Gated DeltaNet mixer needs a declared op that does not exist yet, which is presumably why Qwen3.5-0.8B is the weakest row in the post (1.2×).
- Long context is a genuine win. Split-context decode attention keeps 135M decode at 2.31 ms with 2,000 cached tokens, against 10.47 ms for Inductor. That gap is still mostly Inductor's host time, which stays flat with context.
The repo's correctness story is better than most. Every region of 135M and Qwen2-0.5B decode matches PyTorch bit for bit on its own inputs, and both match eager bf16 end to end over advancing calls. On 1.7B, GEMMs differ from cuBLAS only by accumulation order, at most 2.6e-4. The ROADMAP explains why a single end-to-end tolerance cannot separate rounding from small bugs in a deep model, and replaces it with teacher-forced, region-by-region checks. That is the most transferable idea in the repo.
What is automated, and what is not
Automated, measured on my run: capture, import, region formation, body selection, interval folding, storage planning and source emission, for a graph the author never hand-scheduled. The 30-layer plan came out of the same code as the 2-layer one with no change.
Hand-written, read from the source: the bodies (the GEMM in bodies/gemm.py is 2,280 lines adapted from CUTLASS's Hopper persistent kernel; decode attention is 1,067), per-op lowering rules, the region matchers, and for Llama-family decode a hand-written wrapper (StatefulSmolLM) that the published numbers use. Other Hugging Face attention models go through a generic DecodeStep, which the ROADMAP lists as done for Gemma 3. Inductor reaches all of core ATen with about six IR node kinds; MegaBake is still per op. The ROADMAP's own comparison is fair: the fast systems (Mirage MPK, Inferact's TPU kernels) are per model, the general one (Inductor) leans on libraries for hot ops, and "no system gets both."
The take
MegaBake is a real compiler, not a demo. On a CPU, its planner turned a 30-layer SmolLM decode graph into one 633-phase, 183-barrier kernel in under a minute, and the numbers matched the repo's own. The 5.5× is a true measurement of a narrow thing: a single launch against roughly 540 launches on a slow host, with CUDA graphs off on the baseline because of how the KV cache is passed in. On GPU time, the megakernel is within 9% of Inductor on 135M and behind on 1.7B, which is the README's own finding. The interesting number is still to come. A megakernel earns its keep over a CUDA graph only once it overlaps work across barriers, and that is exactly the next three steps on the roadmap.
If you want the general background, How LLM inference works covers why decode is memory-bound, and FlashAttention-3 and TileLang cover the same Hopper machinery (TMA, WGMMA, warp specialization) one kernel at a time. lithos-metal is a per-layer megakernel on Apple silicon whose own notes found fusion by itself about a wash. Naive-N0.5-Flash has a hand-built runtime with the same one-kernel ambition, and the CPU performance engineering reading list explains why a batch-one GEMV is a bandwidth problem.