2026-10-06 · 19 min · performance · kernels · benchmarks · apple-silicon · llama-cpp · quantization
Why read this
Hightop 30%Walks a CPU-performance repo's 14 committed M4 Pro benchmarks (mispredicts, cache ladder, roofline, GEMM), then applies its roofs to llama.cpp batch-one decode.
- Interactive explanations
- Evergreen reference
- Original analysis
GPUs, kernels & systemsRuns on a laptop CPUPractitioner tool
How this was scored
- Is it new?
- 1 of 3: An incremental tweak
- Can I trust it?
- 2 of 3: Measures key facts from files, code or configs
- Can I run it?
- 2 of 3: Open code or weights with real limits
- Will I understand it?
- 3 of 3: Mechanism carried by interactives built from real code or data
- Can I act on it?
- 2 of 3: A concrete recipe, numbers or comparison
- Will it last?
- 3 of 3: Evergreen fundamentals
- Does it affect many?
- 2 of 3: A widely used model, tool or lab release
- Only here?
- 2 of 3: A teardown or measurement few others did
Score 74 of 100, ranked 54 of 445 rated articles. Each question is answered 0–3 by hand, and a 3 is rare. How articles are scored
Most performance reading lists are a pile of links with adjectives on them. This one has a rule that turns most of the pile away, and a directory that does what the links only describe. The contributing guide says it plainly: the benchmarks are "the part of the repo nobody can fork their way into and it is the whole point."
I shallow-cloned it at commit deb5a0b (5 October 2026) and read every file that teaches something: the
743-line README.md, the section drafts with their Rejected and Claims blocks, all fourteen bench.c
files with their scripts, raw output and analysis. I did not run anything. Every benchmark
number below is the repo's own, from its committed run, and I label it reported. Counts I took from
the files are measured. Arithmetic I did on top is reasoned.
- license
- MIT
- branch
- main
- tests
- 21 files
- source
- 1.4 MB
- commit date
- 2026-10-05
by size of tracked source at this commit, file counts in brackets; docs, data and vendored trees excluded
local clone, 2026-10-06 at deb5a0b — branch, commit, commitDate, fileCount, hasTests, languages, license, licenseFile, shallow, testFileCount
shallow clone: counts describe the pinned tree, not the history
What is in the box
- The list.
README.mdhas 304 entries (measured: 294 bulleted links plus the 10-step "Start here" path) in sixteen sections, from fetch and decode to inference on CPU. Every entry is one line saying why that source and not another. - The benchmarks.
misc/benchmarks/holds fourteen C11 programs, one per section from 2 to 15, each with a claim, the exact build line, a machine description, raw output and a long analysis. - The editorial record.
misc/notes/sections/keeps every rejected candidate with the rule it failed, and every number the authors looked at, scored against seven fields. - An MCP server and a site.
misc/mcp/serves all of the above to an AI client and indexes the linked sources locally;misc/site/builds cpuperf.com from the same commit, charts included. The figures below are that site's charts, drawn from the committedraw.txtfiles.
The rule that shapes everything is the seven-field rule. A performance number appears only if its source states the CPU model and microarchitecture, the core count, the frequency with turbo and SMT state, the compiler and flags, the workload, the baseline and the method. Section 13's Claims block shows the rule at work: the llamafile matmul post's "810 gigaflops" is scored, found to lack the core count, the clock and a run statistic, and kept out. The post stays linked for the kernel it builds. The number does not travel. The benchmarks hold themselves to the same seven fields, and that is where the repo earns its keep.
The harness: how not to measure nothing
Every benchmark includes common/timing.h. Two macros do the work that most microbenchmarks forget:
// misc/benchmarks/common/timing.h:31,33
#define SINK(x) __asm__ volatile("" : : "r,m"(x) : "memory")
#define CLOBBER() __asm__ volatile("" : : : "memory")
SINK hands a value to an empty asm block the compiler must assume reads it, so the loop that produced
the value cannot be deleted. Benchmark 05 shows what happens without it: with the sum discarded, the
"loop" takes 0 ns at the median and never more than 42 ns, one tick of the clock, because clang removed
it (reported). With the sum consumed it takes 497,500 ns per pass.
Timing is CLOCK_MONOTONIC_RAW, one discarded warmup, at least ten timed repetitions, the minimum for
latencies and the median for throughputs, with the coefficient of variation beside every row. Apple publishes no clock for the M4 Pro, so
common/clock_estimate.c times a chain of dependent integer adds. One add retires per cycle, so
nanoseconds per add is the cycle time. It reads 4.49 GHz on a performance core (reported), and every
"cycles" column in the repo divides by it.
Benchmark 05 also prices the single run. Two warm passes of identical code differ by more than 2% in 23.9% of pairs within one process (reported). One run per side cannot resolve a 2% change.
A dependency chain is a latency, not a throughput
Benchmark 03 sums the same 16,384 floats five ways. Every kernel does sixteen loads and sixteen adds per iteration; the only difference is how many accumulators the adds rotate through.
// misc/benchmarks/03-latency-vs-throughput/bench.c:61-69
__attribute__((noinline)) static float sum1(const float *a, int passes) {
    float s0 = 0.0f;
    for (int p = 0; p < passes; p++)
        for (int i = 0; i < N_ELEMS; i += 16) {
            STEP16(0, 0, 0, 0, 0, 0, 0, 0, 0, 0, 0, 0, 0, 0, 0, 0);
            PIN(s0);
        }
    return s0;
}
PIN (lines 33-45) is a small piece of craft worth stealing. It is an empty asm that forces each
accumulator into its own scalar register. Without it, clang's SLP vectoriser packs four accumulators into
one NEON register and four chains silently become one.
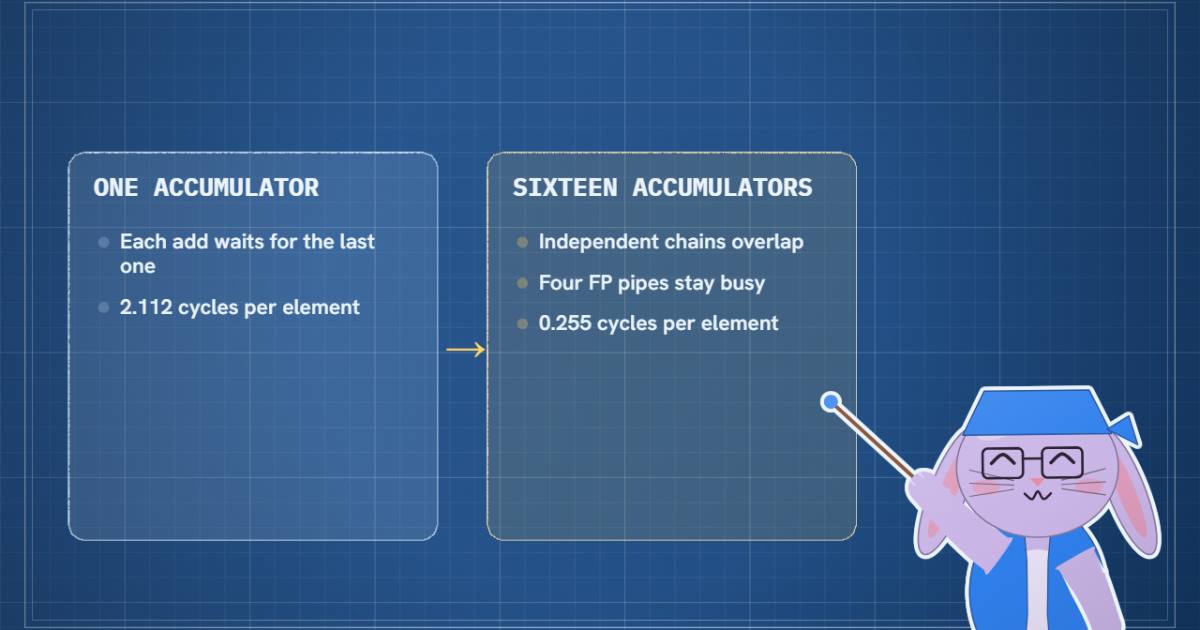
One accumulator costs 2.112 cycles per element; sixteen cost 0.255; the ratio is 8.28 (reported). The
one-chain number is the fadd latency: each add waits for the previous one. The sixteen-chain number is
the throughput: four adds per cycle, four FP pipes all busy.
The textbook says you need latency times throughput chains to fill the pipes: 2.11 times 3.93, or 8.3. The repo measured that eight chains reach only 0.69 of the plateau and sixteen are needed. The wait per add rises from 2.11 cycles with one chain to 2.97 with eight, and the analysis offers a cause it labels a hypothesis: adds bound to a pipe at dispatch queue behind each other while another pipe idles. With no hardware counters on macOS, it cannot say more.
Hold on to "you need more chains than the arithmetic says". It comes back in the GEMM section.
A branch costs what it mispredicts, not what it takes
Benchmark 02 sums every element at or above a threshold over 4,194,304 random bytes, sorted and unsorted.
// misc/benchmarks/02-branch-misprediction/bench.c:26-36
NOINLINE static uint64_t sum_branchy(const uint32_t *a, size_t n, uint32_t t) {
    uint64_t sum = 0;
    for (size_t i = 0; i < n; i++) {
        uint32_t v = a[i];
        if (v >= t) {
            sum += v;
            __asm__ volatile("" : "+r"(sum));
        }
    }
    return sum;
}
The empty asm in the taken arm stops clang turning the if into a csel or vectorising the loop, so a
real data-dependent branch stays. A sibling kernel moves the asm outside the select and compiles to csel.
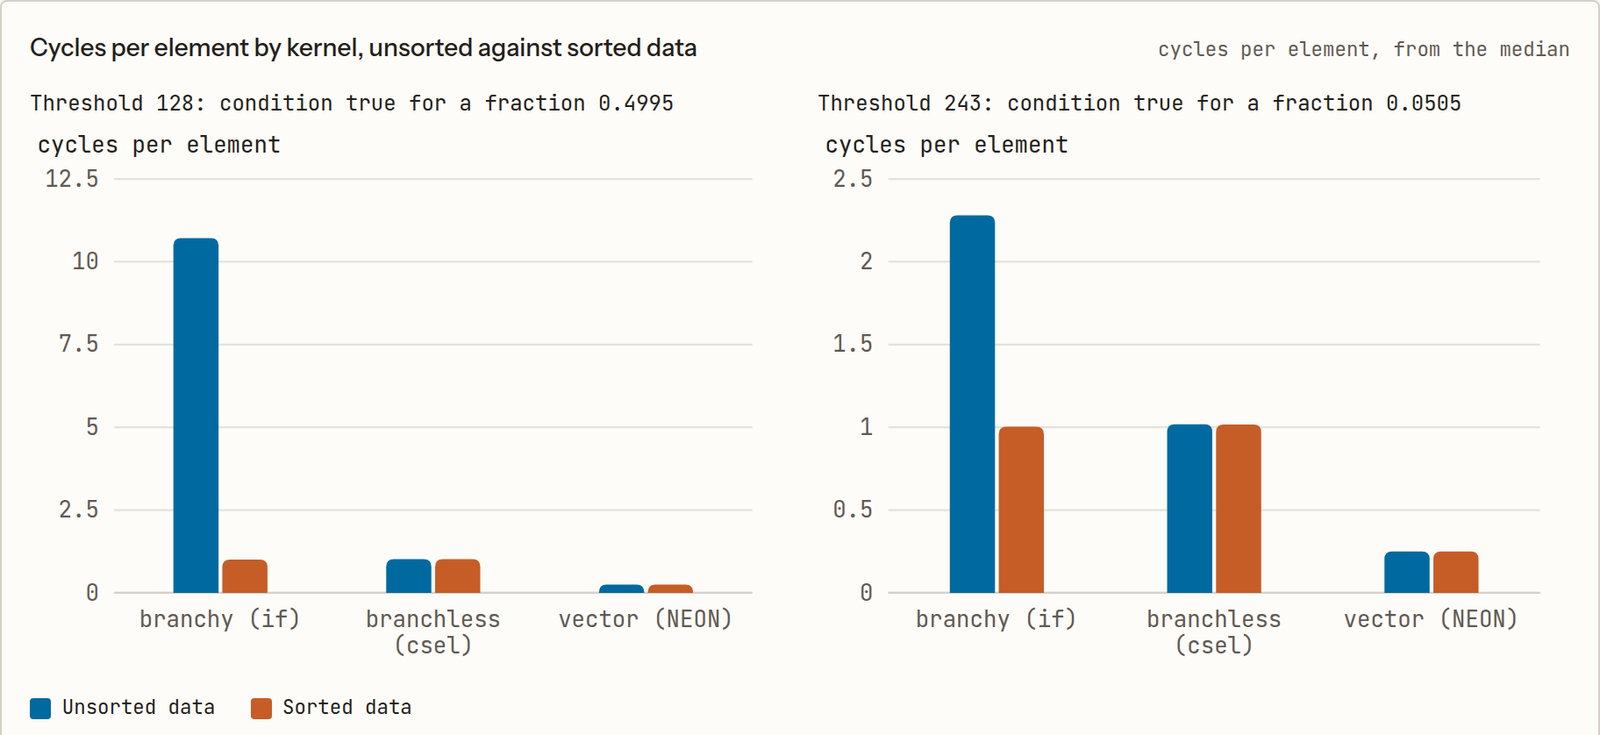
At threshold 128, half the values pass. Unsorted, the branchy loop costs 10.71 cycles per element; sorted, 1.01; branchless, 1.02 (reported). The predictor can do no better than a coin flip on random data, so it misses on about half the elements: 9.70 extra cycles divided by a 0.4995 miss rate is 19.4 cycles per mispredict (reported). That is the refill time from the flush to the next resolved branch, including the load the branch depends on.
At threshold 243, only 5.1% pass. The branch is now nearly always taken, the predictor settles on that direction, and the unsorted loop falls to 2.28 cycles. Same instructions, a branch that is taken more often, and less than a quarter of the cost. Cost follows the miss rate, not the taken rate. The vector form runs at 0.25 cycles per element in every cell, four times the scalar select, because it has no branch and no per-element chain at all.
The memory hierarchy, one dependent load at a time
Benchmark 04 is the classic pointer chase. It builds a random single cycle over 128-byte nodes with Sattolo's shuffle, which guarantees one cycle through every node, and then follows it:
// misc/benchmarks/04-cache-latency/bench.c:65-68
static __attribute__((noinline)) const node_t *chase(const node_t *p, uint64_t steps) {
    for (uint64_t i = 0; i < steps; i++) p = p->next;
    return p;
}
No load can start before the previous one returns, so time per step is load-to-use latency, and random order defeats the prefetcher.
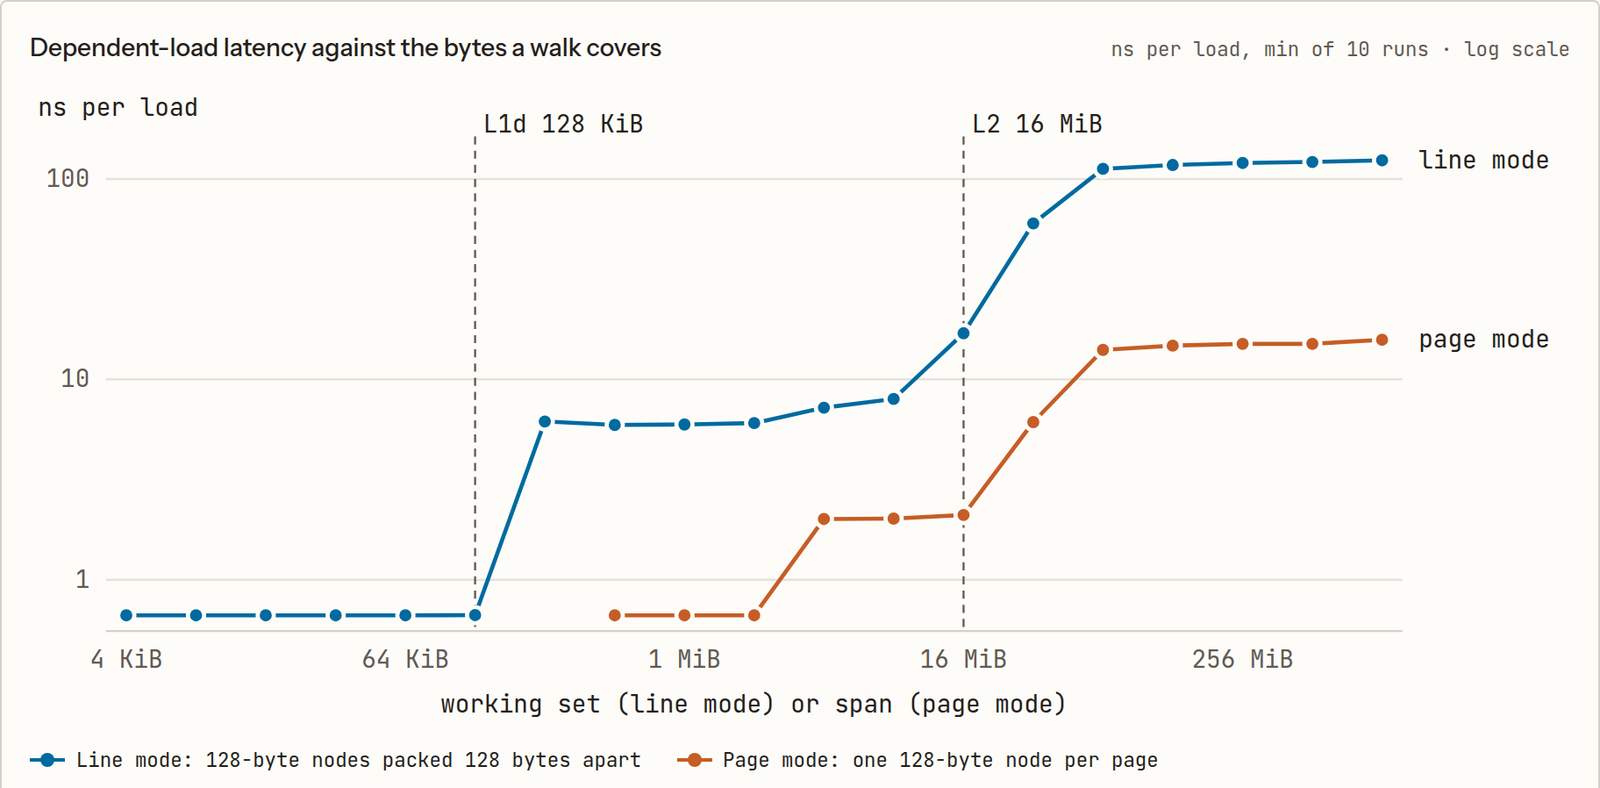
The L1 plateau is 0.665 ns, 3.0 cycles, up to exactly the documented 128 KiB. At 256 KiB it steps to 6.167 ns, 27.7 cycles. From 64 MiB to 1 GiB it sits at 112 to 124 ns (all reported). An L2 hit is 8.9 times an L1 hit and a trip to memory 186 times (reported).
The clever part is page mode. It puts one node on every 16 KiB page and balances the line offsets so the L1 sets see exactly the same occupancy as the line-mode partner with the same number of lines. The only thing that changes is address translation. Page mode leaves L1 latency at 256 pages, so the first-level TLB covers between 2 and 4 MiB of 16 KiB pages; it adds a page walk of about 8.1 ns once the span passes 32 to 64 MiB. That explains why the line-mode curve starts climbing at 4 MiB, well before the 16 MiB L2 runs out: translation misses arrive first.
The solid line is the line-mode chase; the dashed line spreads the same number of lines one per 16 KiB page, so the only thing that changes is address translation. Page mode leaves L1 latency at 256 pages, not at 128 KiB: the first-level TLB ran out before the cache did.
Apple documents neither TLB, and the repo calls both boundaries inferred. On a Linux server with 2 MiB huge pages, it notes, the walk shrinks and the page-mode step moves out 128 times in span.
Layout decides the bytes, and the vectoriser decides the rest
Benchmark 07 sums one 4-byte field of a 64-byte struct, as an array of structs and as a structure of
arrays. At -O2 with reassociation allowed, the struct layout costs 0.6247 ns per record and the field
array 0.0439: 14.23 times, against a byte ratio of 16 (reported). Both run at one core's memory
bandwidth, so time tracks bytes.
The more useful row is soa_strict. Without permission to reassociate the float sum, clang still reports
the loop as vectorised. It loads four lanes at a time and then adds them one by one into a single
accumulator. That runs 10.79 times slower than the reassociated loop (reported). A "vectorized loop"
remark is not a speedup. The repo grants the permission locally rather than with -ffast-math:
// misc/benchmarks/07-aos-vs-soa-simd/bench.c:43
#define FP_REASSOC _Pragma("clang fp reassociate(on)")
Benchmark 08 is the honest one. Its claim started as the textbook line: the vectoriser gives up when it
cannot prove pointers distinct, and restrict fixes it. The measurement disagreed. Clang 17 vectorises
a[i] = b[i] * s + c[i] behind a runtime overlap check, so restrict changes nothing measurable (0.99 to
1.00 of plain at every size). The real cost shows when the check fails. Called in place with a == c, the
plain kernel falls back to its scalar copy and runs 5.29 times slower in L1 (reported). A loop pragma,
vectorize(assume_safety), keeps the vector loop for the in-place call, because its promise (no
iteration depends on an earlier one) is true there, where the restrict promise is not. The README for
08 rewrote its claim to match; the benchmark index did not.
The roofline, measured instead of quoted
Benchmark 06 measures its roofs rather than reading them off a datasheet. The compute roof is the NEON
fmla rate with twenty independent accumulator chains; the memory roofs are a read stream, a copy and a
triad over arrays thirty-two times the L2.
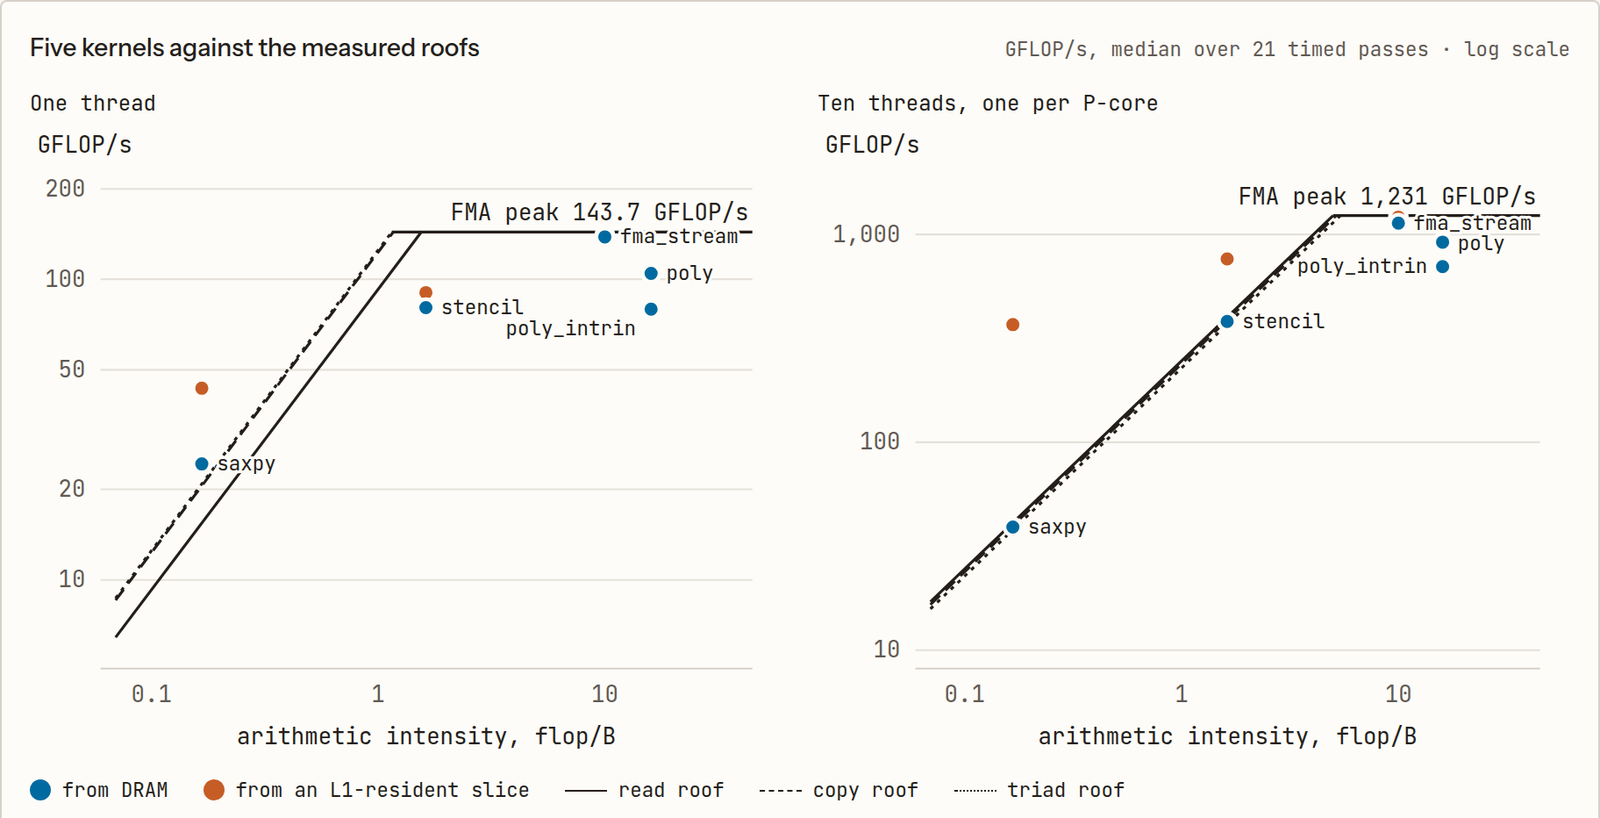
One thread: an FMA peak of 143.7 GFLOP/s, exactly 32 flops per cycle at 4.49 GHz, and a read roof of 92.7 GB/s. Ten threads: 1231.1 GFLOP/s and 246.3 GB/s (reported). The ridge point, where a loop stops being memory bound, is 1.55 flops per byte on one core and 5.00 on ten. That shift is the single most important number in the repo for anyone doing inference on a CPU, and I come back to it below.
The chains matter here too. Twenty chains reach 143.7 GFLOP/s; the textbook sixteen reach 128.8, which is 0.90 of the peak (reported). The source says why it picked twenty:
// misc/benchmarks/06-roofline/bench.c:65
#define ACC 20          /* FMA chains for the roof: 4 pipes x 4 cycles of latency, plus slack */
GEMM, and the matrix unit nobody can write in C
Benchmark 13 is where the list meets inference. It runs a 1024 by 1024 SGEMM four ways on one core. The
naive i-j-k loop is a dependent fmadd chain reading B down a column; swapping to i-k-j lets clang
vectorise the inner saxpy; the blocked version packs A and B into panels and runs an 8 by 8 register-tile
microkernel:
// misc/benchmarks/13-sgemm-naive-vs-blas/bench.c:145-162 (abridged)
static inline void ukernel_8x8(int kc, const float *restrict ap, const float *restrict bp,
                               float *restrict c, int ldc) {
    float32x4_t c00 = vld1q_f32(c + 0 * ldc), c10 = vld1q_f32(c + 0 * ldc + 4);
    /* ... sixteen accumulators hold the 8x8 tile of C ... */
    for (int q = 0; q < kc; q++) {
        const float32x4_t b0 = vld1q_f32(bp), b1 = vld1q_f32(bp + 4);
        const float32x4_t a0 = vld1q_f32(ap), a1 = vld1q_f32(ap + 4);
        TILE_ROW(0, a0, 0) TILE_ROW(1, a0, 1) TILE_ROW(2, a0, 2) TILE_ROW(3, a0, 3)
        TILE_ROW(4, a1, 0) TILE_ROW(5, a1, 1) TILE_ROW(6, a1, 2) TILE_ROW(7, a1, 3)
        ap += MR;
        bp += NR;
    }
Each step of k is four loads and sixteen FMAs; the tile of C never leaves registers. That is Goto's
idea: each loaded value is used eight times, so arithmetic per byte goes up.
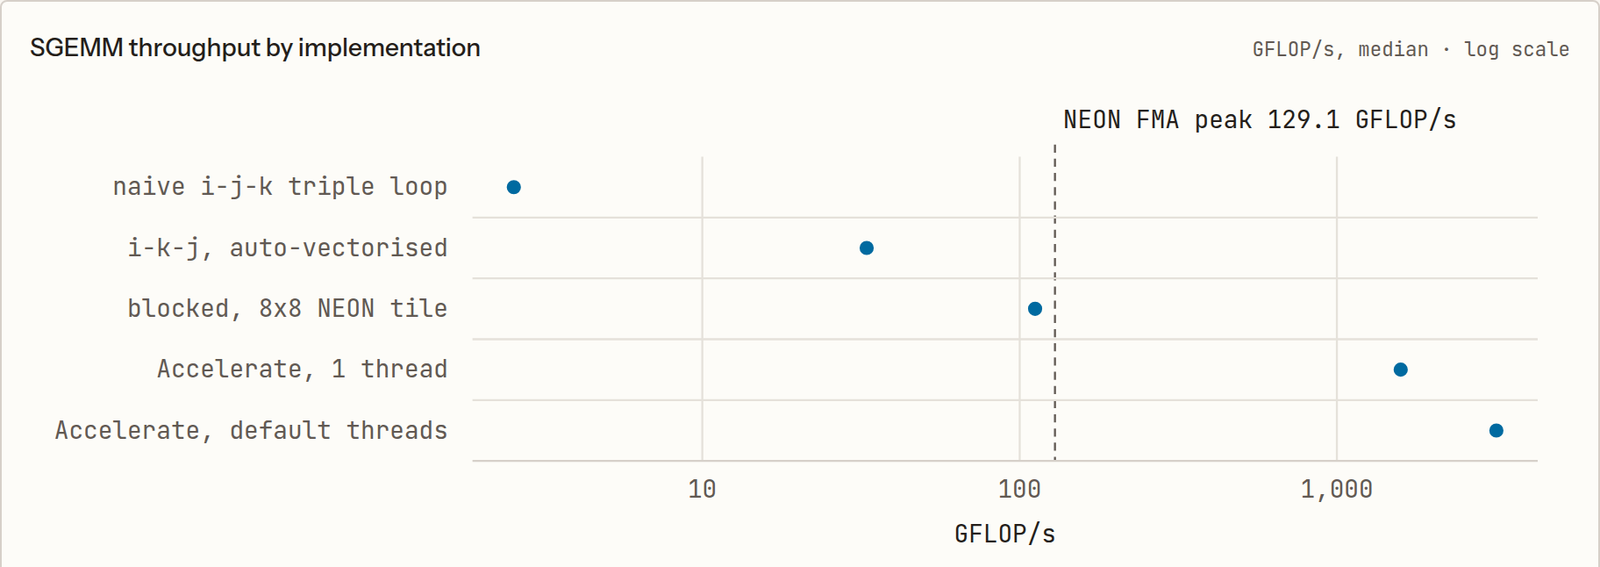
The ladder is 2.54, 32.94 and 111.77 GFLOP/s, then Accelerate's cblas_sgemm at 1588.13 on one thread
(reported). The naive loop sits at 87.8% of what one fmadd chain allows: latency bound, like benchmark
03's one-accumulator sum. Accelerate is 14.2 times the hand microkernel because it runs on the SME matrix
unit, which clang does not emit from plain C. On x86, where fp32 GEMM runs on the FMA ports, a good
microkernel is most of the way to MKL; on this chip it is not.
The second table is the one that matters for quantized inference. An int8 sdot does sixteen
multiply-adds per instruction against four for an fp32 fmla. Streaming from memory, int8 runs at 3.97
times fp32, and both move the same 119 bytes per nanosecond; from L1, 4.02 times (reported). The same
factor of four shows up from bytes when memory binds and from lanes when the core binds.
What this means for llama.cpp
Section 13 opens with the sentence every CPU inference argument comes down to: "A decode step at batch one reads every weight once for a few flops, so it runs at the memory system's rate." The repo's roofs let me put numbers on that.
A batch-one decode step is a matrix-vector product per layer. Each weight is read once and used for one
multiply and one add, so arithmetic intensity is two flops divided by the bytes per weight. In ggml,
block_q8_0 is a 2-byte fp16 scale plus 32 int8 values, 34 bytes per 32 weights; block_q4_0 is the
scale plus 16 bytes of nibbles, 18 bytes per 32 weights (both pinned by static_assert in
ggml/src/ggml-common.h). That makes intensity 0.50 flops per byte for f32, 1.00 for f16, 1.88 for q8_0
and 3.56 for q4_0 (reasoned).
Decode at batch one does two flops per weight and reads each weight once, so its intensity is two divided by the bytes per weight. On ten cores the ridge sits at about five flops per byte and every format here is left of it: only bytes matter. On one core the ridge drops to 1.55, and a q8_0 or q4_0 model computed with fp32 FMAs lands right of it. That is why llama.cpp quantizes the activations to q8_0 and multiplies with integer dot products. These are ceilings: no KV cache, no attention, no unpacking cost.
On ten cores the ridge is 5.00, and every format is left of it: decode is memory bound and only bytes matter (reasoned). A 7B model in q4_0 is 3.94 GB per token, so the repo's 246.3 GB/s read roof caps it at about 62.5 tokens per second before the KV cache, attention or anything else (reasoned). That is the same bandwidth argument the Splash and TensorFold and Strata pieces made on Apple GPUs, and the one kimi-k3-in-c runs into on a CPU with no BLAS at all.
On one core the picture flips. The ridge drops to 1.55. A q4_0 model computed with fp32 FMAs now sits at
3.56 flops per byte, right of the ridge, and is compute bound: about 10.3 tokens per second from
arithmetic against 23.5 from bandwidth for the same 7B model (reasoned). Switch the arithmetic to int8
dot products and the compute roof moves up four times, past the memory roof again. That is exactly what
llama.cpp does: ggml_vec_dot_q4_0_q8_0 in ggml/src/ggml-cpu/arch/arm/quants.c quantizes the
activations to q8_0, unpacks the nibbles with an and, a shift and a subtract, multiplies with
vdotq_s32, and scales each integer sum by the two blocks' fp16 scales. Benchmark 13's int8 table is the reason that design is right, measured on a real chip. Its
one gap is that the repo's sdot loop does no unpacking, so it is an upper bound on what a q4_0 kernel
gets per instruction (reasoned).
Benchmark 15 adds the last caution. Apple states 273 GB/s for the part. One thread streaming STREAM triad gets 119.2; the total plateaus at 223.7 to 225.8 GB/s from four threads up, 0.827 of the vendor figure; and fourteen threads drop to 149.4 because four of them land on efficiency cores and a static partition waits for the slowest (all reported). For llama.cpp that means two things: decode stops scaling after a handful of threads, and a thread count that includes E-cores can be slower than one that does not. The 200 GB MoE on one RTX 3090 build ran into the server-side version of the same wall.
Where the repo disagrees with itself
I read the code against the prose. Most of it holds, to the decimal. Four things do not.
Benchmark 13's NEON peak is a sixteen-chain number. neon_fma_peak (bench.c:198-209) runs sixteen
independent fmla chains and reports 129.12 GFLOP/s. Benchmark 06 measured that sixteen chains reach
128.8 and twenty reach 143.7 on the same core. Benchmark 13 instead reads its 89.7% shortfall against the
144.00 theoretical bound as DVFS and infers a 4.03 GHz clock. Its microkernel comment reasons from a
three-cycle latency ("four FMA pipes times the three-cycle fmadd latency ... need twelve independent
chains in flight; sixteen leaves slack", bench.c:138-141), while benchmark 06 sizes its roof for four
cycles. With 06's numbers, the microkernel is 77.8% of the real peak, not 86.6%, and its sixteen
accumulators are themselves a ceiling (reasoned). The "1.48 sdot per cycle at the implied clock" row
inherits the same assumption.
One index row contradicts its own benchmark. misc/benchmarks/README.md still summarises 08 as "The
vectoriser gives up on possible aliasing; a qualifier fixes it". Benchmark 08's README says "The premise
of the old form of this claim does not hold on this compiler" and shows restrict changing nothing.
The numbering drifted. Benchmark directories run 02 to 15, matching README sections, but their READMEs are titled 01 to 14 (measured). Harmless, but confusing when you follow a citation.
The scope and the machine do not match. The README scopes itself to "x86 and Arm server parts". Every number in the repo comes from one Apple M4 Pro laptop chip, which is neither. Section 13's own Rejected block turns down the reverse-engineered Apple AMX documentation because M-series parts "are neither x86 nor Neoverse server cores", while benchmark 13's headline ratio is a measurement of that unit. Each benchmark README translates its result to an x86 server, carefully. Those are predictions, not runs.
What is missing
Counters. All fourteen benchmark READMEs say there is no PMU access from user space on macOS
(measured). So mispredicts are inferred from the data distribution, TLB reach from where a curve bends, and
the false-sharing traffic from timings. Section 5 lists perf stat, top-down analysis and perf c2c; no
benchmark can show any of them. One Linux x86 rerun of 02, 04 and 09 under perf stat would turn half the
repo's hypotheses into counts.
NUMA without NUMA. Benchmark 10 supports the NUMA section with first-touch timings on a single-node chip. It measures the fault cost, 668.8 ns per 16 KiB page against 4.3 ns once the page exists (reported), but it cannot show placement, the section's subject.
The decode benchmark. The section 13 draft ends with a benchmark proposal: an 8192 by 8192 f32
matrix-vector product across 1 to 10 threads, against a small-batch GEMM over the same weights, to show
GEMV going flat at the memory roof while the batched case keeps scaling. The draft says it "stands as the
run the last subsection still lacks". It is the most important missing piece for anyone reading the repo
for inference, and the arithmetic above is my stand-in for it. A quantized variant with real q4_0
unpacking would close the gap between benchmark 13's sdot loop and what llama.cpp actually executes.
How I would use it
Read the "Start here" path in order. Then read the benchmarks as worked examples, not results. Their
value is the method: SINK on every result, a reference computed a different way, round-robin
repetitions, the assembly quoted beside the timing, and a Limits section that says what the machine could
not show. Copy that onto your own hardware and the M4 numbers stop mattering.
If you write kernels, compare benchmark 03 with benchmark 13. The first proves you need more independent chains than latency times throughput predicts. The second then sizes its microkernel and its peak by that very prediction. The lesson the repo teaches best is the one it briefly forgets: measure the ceiling you quote against. For more on how a model's bytes become its speed, the Modular inference handbook review and the Penjing quantisation audit take the same arithmetic in other directions, and stable-diffusion.cpp is ggml's quantized kernels under a different model family.