2026-10-13 · 24 min · world-models · video-generation · diffusion · distillation · kv-cache

Why read this
Notabletop 60%Astronex-World's cache, controls and training read from its code and weight headers, with its real-time claim and WBench rank checked against the source.
- Interactive explanations
- Original analysis
- Runs on a consumer GPU
Image & video generationApache-2.0Practitioner model
How this was scored
- Is it new?
- 1 of 3: An incremental tweak
- Can I trust it?
- 2 of 3: Measures key facts from files, code or configs
- Can I run it?
- 2 of 3: Open code or weights with real limits
- Will I understand it?
- 3 of 3: Mechanism carried by interactives built from real code or data
- Can I act on it?
- 2 of 3: A concrete recipe, numbers or comparison
- Will it last?
- 1 of 3: Relevant for months
- Does it affect many?
- 1 of 3: A specialist community
- Only here?
- 2 of 3: A teardown or measurement few others did
Score 63 of 100, ranked 220 of 513 rated articles. Each question is answered 0–3 by hand, and a 3 is rare. How articles are scored
Most open world models on WBench come from labs with a rack of H100s behind them. Astronex Robotics says it did the whole post-training run for Astronex-World 1.0 on two NVIDIA L20 48 GB cards: a 5B model, Apache-2.0, that scores 70.0 on WBench Full and, they say, streams 832x480 at 24 fps on one of those cards. I first saw the name a few rows down the WBench leaderboard while checking XGEN-Jing's #1 claim. The ModelScope announcement then landed with weights, code, a 25-page technical report, sampling presets and post-training recipes. That is enough to read the thing end to end instead of taking the bullet points on trust, so I did.
The short version: the engineering inside the causal sampler is careful, unusually well commented, and more interesting than the headline. Some of the headline is softer than it reads. The 70.0 is real, but it puts the model 11th of 16 on the live Full table. Two of the four control channels are mostly scaffolding in the released weights. And the "real time on one L20" sentence is the one claim I tried hardest to reproduce on paper and could not.
One trunk, two attention masks
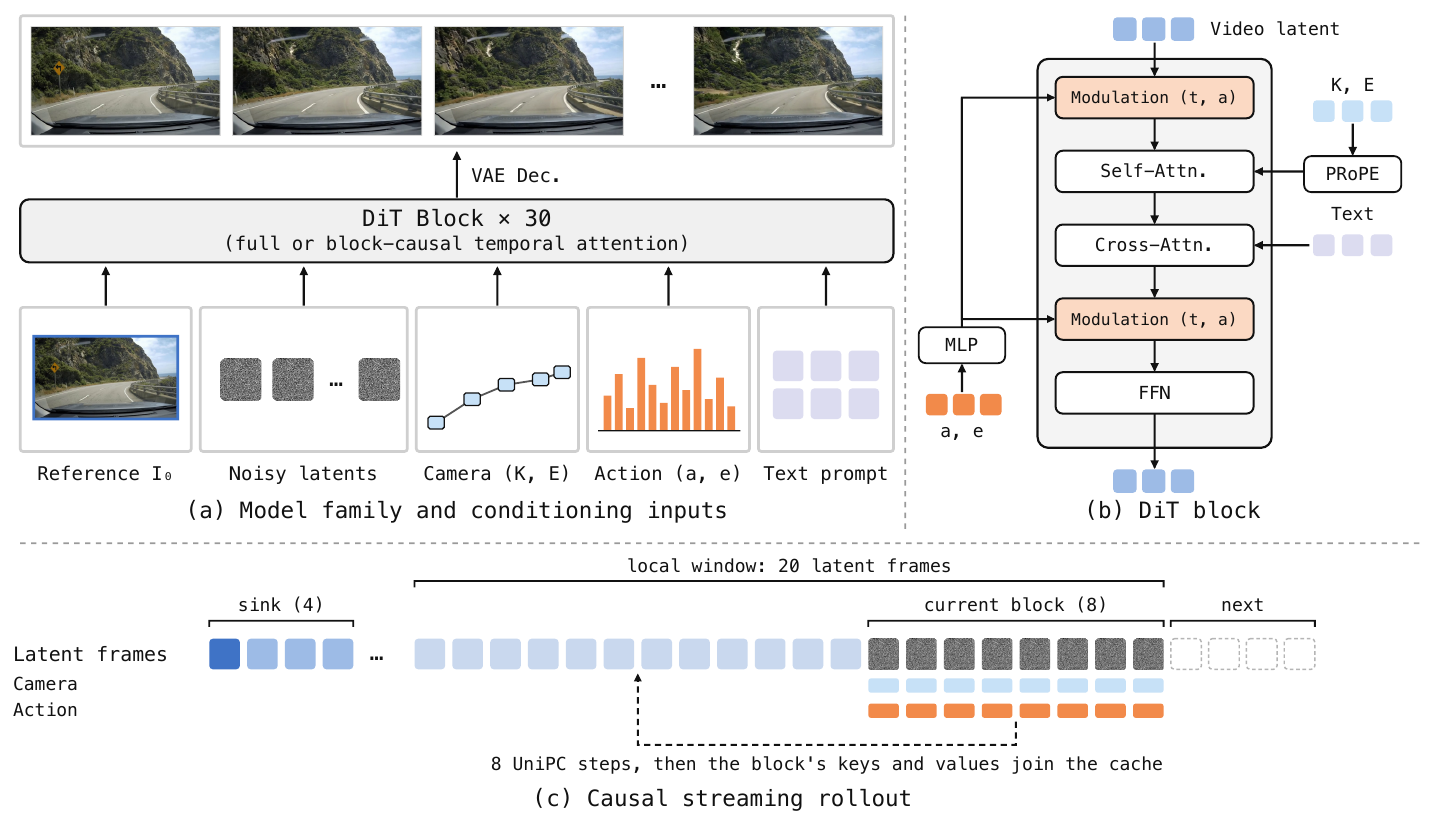
Astronex-World is a post-trained Wan2.2-TI2V-5B. It keeps Wan's video VAE (48 latent channels, 4x temporal and 16x16 spatial compression), its UMT5-xxl text encoder and its 30-layer diffusion transformer: width 3072, 24 heads, FFN 14,336. Wan2.2's 1x2x2 patch embedding means a single 832x480 latent frame becomes a 15 by 26 grid, 390 tokens. Keep that number in mind; most of the arithmetic later comes from it.
The idea the report builds everything on is that one set of weights can be sampled two ways. In the bidirectional form, every latent frame attends to every other one across a 20-latent-frame clip, sampled with 50 steps and CFG 8.0 (inference/bidirectional.yaml). That is a normal video diffusion model: good motion, fixed length, nothing you can steer mid-clip. In the causal form the temporal mask becomes block lower-triangular. Frames inside the current block of eight still see each other, but they only see the past, through a KV cache, and each block is denoised with eight UniPC steps at CFG 3.0. Once a block is done its keys and values go into the cache and the next block starts from fresh noise. That is what makes the video extendable and steerable while it runs.
The bidirectional checkpoint is not a throwaway teacher here. It is a released form, it is the real-score model in the last training stage, and the repo's own front end says when to prefer it: "Pick causal for interaction and length, bidirectional for a fixed-length clip where motion has to be right" (inference/generate.py). Both forms load the same 898 tensors. I counted them in the three safetensors headers, read by HTTP range request without downloading the 10.7 GB of weights, and the README's breakdown holds exactly: 825 tensors of Wan backbone, 60 for the PRoPE output projections, 7 for the action embedder, 6 for the action-output head. All 898 are bf16.
What the cache actually holds
Figure 2 draws a 20-frame window with four sink frames sitting outside it, which would make 24 frames of attention context. The code says otherwise. The cache is allocated as kv_cache_size = self.local_attn_size * self.frame_seq_length (inference/pipelines/causal_diffusion_inference.py:1300), local_attn_size is 20 in causal.yaml, and the eviction rule keeps the first four frames at the front of that same buffer. So at steady state a block sees 20 latent frames in total: four sink frames, eight frames of recent history, and its own eight. The README's version of the sentence, "sink + recent history + current block", is the accurate one.
That is a short memory. Eight frames of history is 32 output frames, 1.33 seconds of video at 24 fps. Everything older than that, except the opening four latent frames, is gone. Three pieces of engineering try to make that short memory behave.
The sink stays in view forever, and not only because it is never evicted. The cache stores raw keys, and every step the code re-applies RoPE to the resident window with the window's start as frame 0 (models/causal_model.py:885). The comment there says this fixes the rotation distance between sink and query at the window size for good, "so the reference frame never decays out of attention." In image-to-video the reference frame is frame 0, so it conditions every block until the end. A comment in inference/pipelines/causal_inference.py:218 measures the cost of that: with the reference pinned, the content distance from the first frame shrinks over a 15-second rollout (0.052 to 0.044), while the same model with no reference drifts away from where it started (0.036 to 0.131). "The scene is held, not explored." There is an opt-in cond_release_frame to unpin it. I like that this is written down rather than discovered by a user.
The second piece is the one the report calls retrieval, and it turned out to be different from what I expected. I expected a memory bank: old frames stored somewhere, pulled back when the camera returns. What the released sampler does is choose what to evict. When a new block arrives and the cache is full, the newest four history frames are pinned, and the other four history slots go to whichever resident frames best overlap the view the new block is about to draw. Overlap is measured geometrically in _frustum_overlap (post_train/objectives/camera_diffusion.py:15): a 5x5 grid of rays is pushed through the query camera's frustum to depth 3, and each candidate frame scores the fraction of those points that land inside its image and in front of it. A frame needs a score of at least 0.3 to be kept on merit, at most two kept frames can change per block, and anything left over is filled by recency (utils/cache_selection.py). Nothing outside the cache is ever consulted. Once a frame has been evicted, no score brings it back.
The widget below is a top-down port of that bookkeeping, with the window sizes and thresholds from causal.yaml and the step sizes Control2V's poses quantise to (0.08 units and 3 degrees per latent frame). Try the strafe path with retrieval on: frames 10 and 11, from early in the outbound leg, survive in the cache through the whole return, while recency alone would have dropped them at block 3. Then pan right and back, and watch the kept frames fall under 0.3 and stay anyway, because the swap limit holds the previous picks.
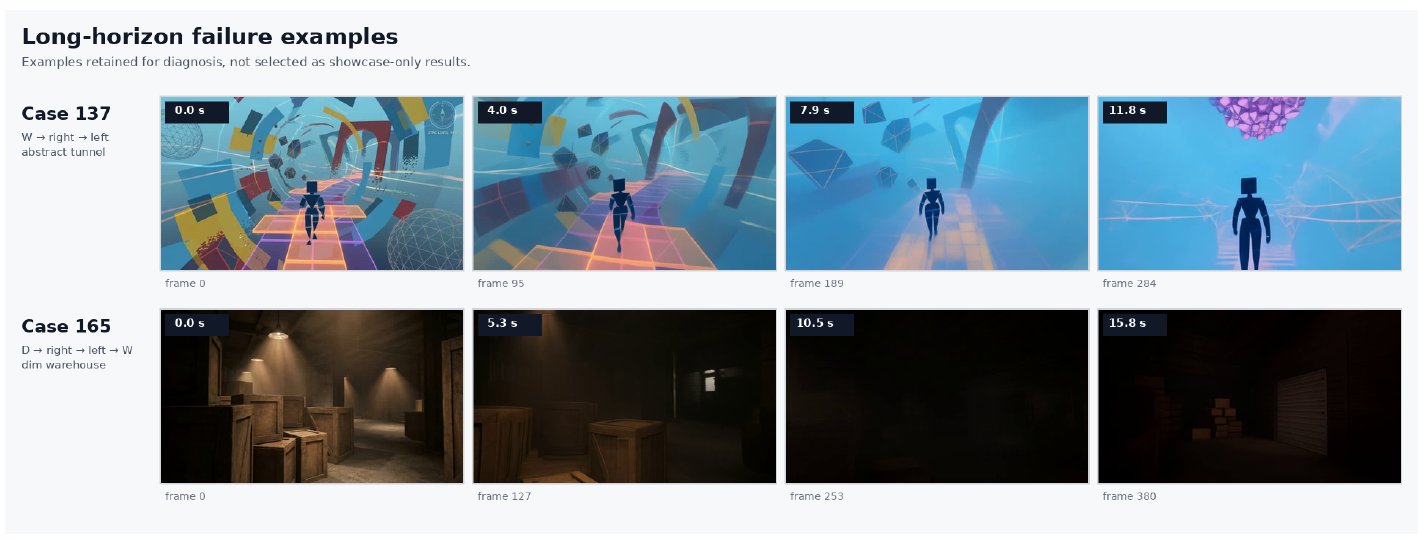
This matters for how to read the long-horizon claims. Overlap-aware eviction helps a zigzag or a short out-and-back, where the frames you need are still resident when you turn round. It cannot help a return after more than a few blocks, because by then the frames that saw the place are gone. The report is candid about where this leaves the model: its failure figure shows an abstract tunnel losing its geometry under W-right-left, and a warehouse fading to near-black over 15.8 seconds. The README says retrieval is used for "revisit trajectories"; the report says the final WBench runs enabled it only for round trips, loops, repeats, L-shapes and zigzags. The released causal.yaml turns it on for everything.
A third piece exists in the code but is off by default: sink_refresh, which swaps the sink's contents for still-visible frames once the original sink stops overlapping the view. Its comment records why: on one WBench case "the sink's content correlation falls under 0.3 by frame 48, and the visible damage follows about a hundred frames later". Dropping the sink entirely "hallucinates gold objects and colour noise". These are the comments of someone who ran the experiments. I would rather read this than another diagram.
Where the four controls enter
The announcement lists camera trajectories, 64-D continuous actions, embodiment IDs and timed text events. They enter the network in three different places, and the released weights train them to very different degrees.
Cameras go through PRoPE, which turns each frame's intrinsics and world-to-camera transform into a projective positional encoding, so attention works in relative camera geometry. The report says PRoPE is applied in all 30 layers. In the code it is a second self-attention running beside the ordinary RoPE one, on its own KV cache, whose output passes through a zero-initialised projection, prope_o, and is added to the block's output (models/causal_model.py:1218). That is the ControlNet trick applied to attention: at initialisation the model is exactly Wan, and the camera branch earns its influence. It is not free. The 30 prope_o projections are 283 million parameters, about 5% of the model, and every causal step runs two self-attentions per layer instead of one.
Actions go through modulation. A 64-D vector per latent frame passes through a two-layer MLP, the embodiment embedding is added, and a zero-initialised linear layer turns the result into the same shift, scale and gate values Wan's timestep embedding already produces (models/action.py). The docstring explains the choice in one line I'll borrow: camera goes through PRoPE, which edits attention geometry; actions go through modulation, which edits feature statistics. It also records that the 64 and the 32 were chosen to match NVIDIA's Cosmos 3, whose action channel has the same shape.
What fills those 64 numbers is narrower than "64-D continuous actions" suggests. utils/action_encoding.py lays out the lanes the trained embedder reads: two for the left stick, two for the right stick, 17 binary buttons, and 43 lanes of zeros marked reserved. WBench's keyboard commands become stick values: W is forward on one lane, the arrow keys turn on another. So in the release the action stream is a gamepad, which matches its training data: DROID robot actions in stage I and CrossFPS game footage in the later stages. Driving and manipulation are described as post-training targets, not current behaviour.
The embodiment table tells the same story more starkly. It has 32 rows of 3072, and I read all of them by range request. One row is non-zero. The other 31 are still exactly zero, as ActionEmbedder initialises them. "32 embodiment IDs" is a capacity, and one of them has been trained.
The action-output head, which the README presents as the route to inverse dynamics, ships untrained, as the config says plainly: "included but untrained". I checked how untrained. The report and README describe the output layer as zero-initialised. In the shipped tensors the hidden layer is zero too: every value I sampled from the 3072x3072 matrix, and both biases, are 0, with only the LayerNorm's weight at its default of 1.0. What ships is the scaffold for a head, with nothing learned in it.
Events are the most interesting control, and the cleanest. An event is a second caption appended to the prompt from a chosen latent frame onwards. Frames before the switch are already in the cache and never recomputed; the cross-attention keys and values are rebuilt from the new text, so every later block reads prompt plus event while still attending to the cached scene. That is why an edit like "the building collapses" lands inside the existing scene instead of replacing it, and why only the causal form can do it: the bidirectional form has no finished past to protect. The README notes the release has no dedicated event branch and routes events through the caption (event_in_caption: true), and that the event text has to stay in plain language, because rewriting it in abstract technical vocabulary stops it triggering.
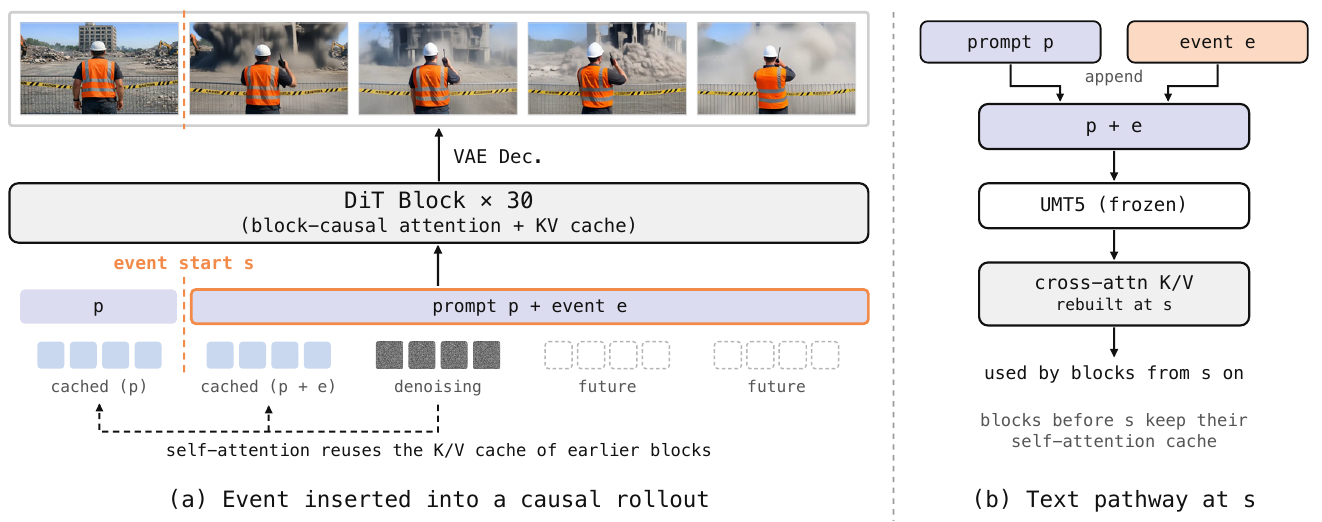
One number in that section puzzled me. Against an otherwise identical run with no event, the report measures frames before the switch differing by a mean of 1.8/255 and frames after by 9.5/255. If the prefix is computed causally from identical inputs it should be identical, and the code's own comment says earlier chunks are "bit-identical to a run with no event at all". Something after sampling touches the whole clip. The colour stabiliser in causal.yaml (rgb_chroma_stabilize_strength: 1.0) is my guess, but I did not confirm it. Either way, 1.8 against 9.5 shows the event staying where it was put.
Five stages, two cards, and what ships
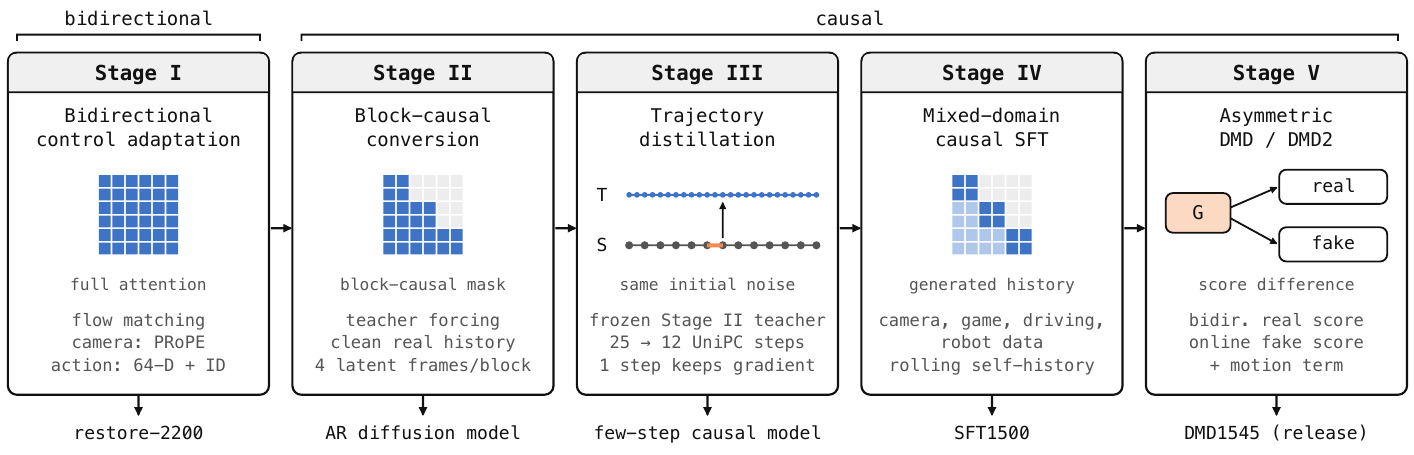
The recipe is the now-familiar path from a bidirectional video model to a fast causal one, done carefully and on a small budget. Stage I adds the controls to Wan with full attention: 2,000 camera updates plus 400 for direction, then 2,000 action updates on DROID with PRoPE frozen (DROID's cameras barely move, so training PRoPE there would teach it that cameras are static), then 200 updates to restore the camera response the action branch had weakened. The result, restore-2200, is the released bidirectional model. Stage II switches to the block-causal mask and trains with teacher forcing on clean history for 500 updates. Stage III is online trajectory distillation in the style of Causal Forcing++, a descendant of CausVid: a frozen copy of the stage II model runs a 25-step UniPC trajectory, the student follows a 12-step one from the same noise, and one student transition per sample keeps its gradient. It runs for 20 updates. Stage IV is a 540-update SFT on a mixture of Control2V, CrossFPS, DrivingDojo and NVIDIA PhysicalAI with rolling forcing, keeping the first frame clean 70% of the time so the same weights do text-to-video and image-to-video. Stage V is asymmetric DMD: the causal student is matched against the frozen bidirectional model as the real score, with a fake-score network trained online, for 45 updates.
Two things in that list are worth stopping on. All of it uses LoRA at rank 64 on a frozen backbone, which is why two cards suffice: the config records the final export as W = base.weight + (lora_b @ lora_a) * 128/64, folded in fp32. And the update counts are tiny. Stage III is 20 updates at effective batch 2; stage V is 45. This is not a model that learned a world from scratch. It is Wan2.2 with a new attention mask and a set of controls grafted on, nudged until it streams. The efficiency claim is honest in that sense, and it is also the main reason the comparison with 14B models trained on H100 clusters is less surprising than it sounds.
The price of stage V is in the report's own internal diagnostic: a ball's bounce amplitude on one test sequence.
| Model state | Bounce amplitude | vs bidirectional |
|---|---|---|
| Bidirectional teacher | 88.8 px | 100% |
| SFT1500 (after stage IV) | 36.1 px | 41% |
| DMD1515 | 21.2 px | 24% |
| DMD1545 (the release) | 16.6 px | 19% |
The released causal model keeps 19% of the teacher's motion on this test. The report says so plainly and calls it DMD over-staticization; VBench's Dynamic Degree of 0.254 for text-to-video agrees. It is also why the README says to use the bidirectional form "when the motion has to be exact". If you need things to move, budget for that.
Then there is what "the complete five-stage training pipeline ... runs on two 48GB GPUs; weights, code, sampling presets, and post-training recipes are included" means in practice. The code release has three post-training recipes, camera, action and sft, all running the same teacher-forced flow-matching trainer with LoRA on the released weights (post_train/train.py). There is no stage III distillation trainer and no DMD trainer in the repo; a docstring in camera_diffusion.py notes that this trainer "is not their DMD, which needs a teacher score model and a critic this trainer does not build". The datasets are not included either. The report credits minWM as the framework the stages were run in. So the five stages are documented, and you can continue training the release, but you cannot rerun the recipe that produced it from this repo. The tweet's wording leaves room for both readings.
The post-training README is worth reading anyway, for two bugs it describes that would bite anyone. Non-reentrant gradient checkpointing kept the KV cache alive through saved_tensors_hooks and ran out of memory on the third step. Reentrant checkpointing silently built no graph at all, because block 0's input comes off a frozen patch embedding: 600 trainable tensors, all with grad is None, and 26 checkpoints byte-identical to their start. Its advice is to compare start and end checkpoints tensor by tensor before believing any measurement from a run. Good advice for anyone doing LoRA on a frozen DiT.
The real-time claim, counted
The report, the README and the announcement all say the causal form streams 832x480 at 24 fps in real time on one L20. None of them gives a measured throughput. The code has a timer, but it records the latency of the first block, excluding the text encoder and the VAE decode, and no number from it is published. So I counted the work instead.
The released sampler (CausalDiffusionInferencePipeline) does this per block: for each of eight UniPC steps, it runs the DiT once with the prompt and once with the negative prompt, on separate KV caches, and combines them with CFG 3.0. After the last step it runs one more clean pass per branch to write the block's keys and values into the cache. That is 18 passes of the 5B DiT for one block. A block is eight latent frames, which the VAE turns into 32 output frames, so all 18 passes have to fit into 1.33 seconds.
Each pass processes 3,120 query tokens (8 frames of 390). The linear layers cost about 9.25 GFLOP per token, which is 28.9 TFLOP for one pass. The two self-attentions over the 7,800-token window add about 17.9 TFLOP, cross-attention to the text another 0.6. Call it 47.4 TFLOP a pass and 853 TFLOP a block. To finish that in 1.33 seconds you need to sustain about 640 TFLOPS of bf16 matrix multiplies. The L20 is an Ada-generation card; the dense bf16 figure I remember from NVIDIA's datasheet is about 120 TFLOPS. I could not re-fetch the sheet from this machine, so the widget lets you set it.
Even with every corner cut, the arithmetic does not close on that card. Four steps without CFG is five passes, about 237 TFLOP a block and roughly 178 TFLOPS sustained, still above the peak I have for an L20. At the released settings and a generous 50% utilisation, the count says about 14 seconds of compute per 1.33 seconds of video. I would be glad to be wrong, and there are ways I could be: the claim may have been measured on a different configuration or at lower resolution, or "real time" may mean the first-block latency the code times. But nothing in the release shows 24 fps being produced, and the count says it would need several times the card's peak.
The memory side checks out, which makes the speed claim stand out more. The README measures a 37.9 GB peak for causal.yaml and 23.2 GB for causal_consumer.yaml, which drops the caches before the VAE decode. From the shapes: there are four caches (prompt and negative prompt, each with a RoPE and a PRoPE copy), each 20 frames x 390 tokens x 3072 x keys and values x 2 bytes x 30 layers, about 2.9 GB, so 11.5 GB of cache next to 10.7 GB of weights. That lands just under the 23.2 GB they report, and explains their remark that below about 24 GB the caches themselves stop fitting. The consumer config is a real contribution: same output, "bit-identical on both a 23-frame and a 47-frame rollout", on a 32 GB RTX 5090.
One smaller inconsistency: the README says the sampler "also accepts 4 steps for latency experiments", the report says four-step sampling "is also supported", and the shipped config.json says "4 steps degrades visibly -- cabinets and signage smear -- so it is not a supported mode". Believe the config.
70.0 against which field
The WBench numbers in the report match the live leaderboard to the decimal: 70.0 on Full 289 and 73.5 on Navi 158, with Quality 78.3, Setting 73.8, Interaction 47.6, Consistency 82.4 and Physical 68.1 on Full. They are not flagged as self-evaluations in the leaderboard's markup, unlike the rows at the top of the board that the XGEN-Jing article looked at.
Context is where the announcement gets selective. The report's comparison table lists seven open models on Full. The live Full table today has 16 rows, and Astronex-World is 11th. Above it, besides the API models (Kling 3.0, Wan 2.7, Seedance 1.5) and the self-evaluated leaders, are HY-Video 1.5 at 74.3, NVIDIA's Cosmos3-Super at 72.5, LTX 2.3 at 70.9 and Cosmos 2.5 at 70.4. The report's table includes HY-Video 1.5, an 8.3B model 4.3 points ahead; the tweet's "outperforming evaluated models with 13.6B and 14B parameters" quietly skips it. The three Cosmos rows are not in the report's table at all, though two of them score higher. The report says its table is a snapshot of 13 September 2026, so some rows may have arrived later, and I can't tell from the page when each was added. Below it are LongCat-Video (69.9), Helios (69.7), Cosmos3-Nano (69.4), YUME 1.5 (68.9) and Kairos 3.0 (65.7).
The Full split is also a thin field. Most dedicated interactive world models only report Navi. On Navi, where 44 models are listed, Astronex-World's 73.5 is 36th; three other 5B open models are well ahead of it there, including Zing-0.5 at 81.0, DreamX-World at 75.0 and ABot-World at 74.7. The "5B beats 14B" framing works on Full because the interactive specialists mostly are not on that table.
The weakness is in the report too, stated plainly: Interaction is 63.4 on Navi but 47.6 on Full, because event editing, subject actions and perspective switches go through the one-caption-switch interface, and the WBench adapter merges multiple timed events in one case into a single switch. Quality is the strength. Its 78.3 is the highest of the seven models in the report's table, and also the highest of any open-source row on the live Full table; only API models and self-evaluated entries score above it.
VBench is a partial run, and the report says so: 240 of 6,220 text-to-video prompts and 118 of 5,590 image-to-video prompts, in official order without selection. Smoothness (0.990), flicker (0.987) and background consistency (0.985) are high; dynamic degree (0.254) is low, which is the DMD motion loss again. I would not read more than that into 4% of a benchmark.
What I'd use it for
The model card and the code are both linked here so you can check my reading against them.
- task
- image-to-video
- library
- astronex-world
- license
- apache-2.0
- safetensors
- 7 shards
- largest file
- 4.98 GB
- files
- 20
- downloads
- 195
- likes
- 2
repo last modified 2026-09-17
- license
- Apache-2.0
- branch
- main
- tests
- none found
- source
- 935.0 kB
- commit date
- 2026-09-17
by size of tracked source at this commit, file counts in brackets; docs, data and vendored trees excluded
local clone, 2026-10-13 at 27584bf — branch, commit, commitDate, fileCount, hasTests, languages, license, licenseFile, shallow
shallow clone: counts describe the pinned tree, not the history
If you want a small, permissively licensed world model to study or post-train, this is a good one to start from, mostly because of the code. The KV-cache bookkeeping, the overlap-aware eviction, the window-relative RoPE and the event mechanism are compact and documented with the experiments that motivated them. The camera and action recipes train one pathway while leaving the other bit-identical, which makes ablations answerable. The consumer config puts inference within reach of a 24-32 GB card.
I would not pick it for interactive streaming on an L20 until someone publishes a measured frame rate. I would not count on the action interface for robotics or driving yet either: what's trained is one embodiment and a gamepad's worth of lanes, and the output head is zeros. And if motion matters, I'd sample the bidirectional form, which keeps the teacher's 88.8 px bounce instead of the student's 16.6.
The broader result stands: a careful five-stage recipe on a frozen 5B prior and two 48 GB cards gets within a point of several much larger open models on WBench Full. That is worth knowing. It is a statement about the Wan2.2 prior and about distillation recipes having matured, more than about this model's world.
How I checked
I read the ModelScope card, the technical report PDF and the code release, shallow-cloned at commit 27584bf (2026-09-18), and the configs (config.json, transformer/config.json, vae/config.json, inference/*.yaml, post_train/configs/*.yaml). I read the three safetensors headers from the Hugging Face mirror (Astronex-Lab/Astronex-World) by HTTP range request, counted tensors and parameters, and range-read the small graft tensors (the embodiment table, the action head, slices of the modulation and PRoPE projections) to see which were still at their initial values. The header totals 5,359,018,240 parameters including the untrained head; the card's 5.35B is a rounded figure.
The cache sizes, the retrieval rule and the per-block pass count come from reading models/causal_model.py, inference/pipelines/causal_diffusion_inference.py, utils/cache_selection.py and post_train/objectives/camera_diffusion.py. The window widget is a port of that logic to a flat top-down world with five rays instead of 25. The FLOP count is my own arithmetic from the model shapes and counts matrix multiplies only. I did not run the model: I have no L20, and the house rule is not to execute third-party code. The L20 peak throughput is from memory, not a datasheet I could fetch. Leaderboard positions are from the live WBench page (meituan-longcat.github.io/WBench), read on 2026-10-13.