2026-09-18 · 20 min · tpu · jax · inference-optimization · quantization · mixture-of-experts · glm
Kaggle gives a phone-verified account free time on a TPU v5e-8 — the repository
says about twenty hours a week, in sessions Kaggle cuts off at nine, and I have
no account to check that against. The machine is eight chips with sixteen
gigabytes of HBM each.
ARahim3/kaggle-tpu-lab uses that
allocation to serve GLM-5.3-Flash — 320B total parameters, 18B active — from
a notebook, behind a Cloudflare tunnel, speaking both the OpenAI and the
Anthropic APIs, so you can point Claude Code at it. The README says ~64 tok/s on
one stream, 262k context, about sixteen minutes from pressing Run to a URL.
Nothing off the shelf runs that model on a TPU. GLM-5.3-Flash is
45 layers, 34 of them KDA linear attention and 11 sparse MLA,
and the README's explanation is that vLLM's TPU backend has no kernels for the
linear-attention half — which I cannot prove, but which matches
vllm-project/tpu-inference's own release notes, where MLA and XL-MoE support
are still listed as landing. So the author wrote an engine. It is 5,562 lines of
JAX and Pallas under glm53-flash/engine/glm53/, plus 1,989 lines of tests, and
the first commit in the repository is dated 1 September 2026. The GLM engine
landed on the 15th. Two weeks.
I do not have a TPU. Everything in this article that is a throughput number is theirs, and I say so each time. What I can do is check the parts that are made of bytes: the checkpoint, the memory budget, the quantization, and the code. Those checks are the article.
The short version: the memory arithmetic is honest to within a rounding step, the engineering is real, and the README oversells the decode kernel's mechanism, misstates the model's native context by a factor of four, and rounds off a quantization loss it has not measured. I measured it.
The guard in scheduler.py refuses a new stream when free HBM falls under min_free_gb = 0.55. On this reconstruction a fourth 262k set still clears it, by about 40 MB of a 16.9 GB chip. The README says three and the notebook says three; both are describing what happens once a 512-token prefill piece is in flight beside them. I have no TPU, so I cannot settle which number is right.
Why 320 billion parameters is the whole problem
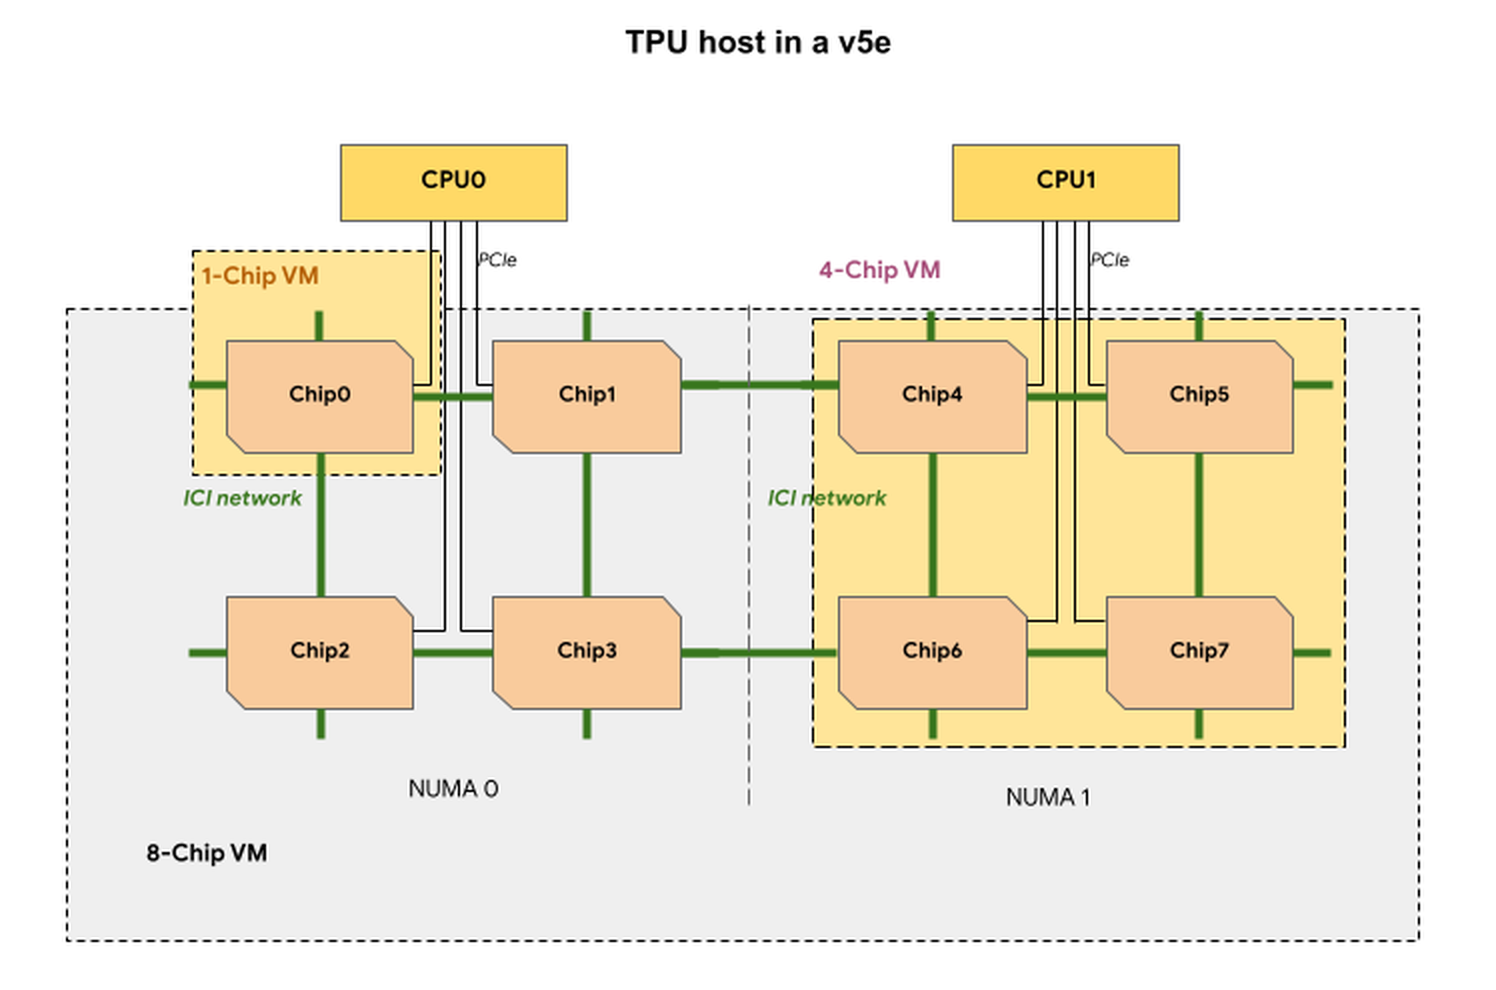
A v5e-8 is 128 GiB of HBM in total, spread over eight chips that talk over ICI.
The engine's own hbm() helper reads bytes_limit off chip 0 and the kernel
logs 16.9 GB usable per chip, so the real ceiling is about 135 GB across the
board.
GLM-5.3-Flash's released weights are native FP8: 314.4B parameters at one byte
plus 6.9B at bf16, which is 328 GB, or 306 GiB. That is not a near miss; it is
2.4× the machine. And the model's shape makes the problem worse
in a specific way. config.json gives n_routed_experts: 288,
moe_intermediate_size: 2048, first_k_dense_replace: 3, so 42 of the 45
layers hold 288 experts of three 4096×2048 matrices each:
42 layers × 288 experts × 3 matrices × 4096 × 2048 = 304,405,807,104 parameters
Against the Hub's own count of 321,323,031,390 total, that is 94.7% of the model in the routed experts alone. The README says "the routed experts are 95% of the weights, so the whole design follows from where they can live." That checks out to a decimal place.
Their answer is to take the experts from Unsloth's GGUF quantization at roughly three bits, keep them resident in HBM in a layout a Pallas kernel can read, and take everything else from the original FP8 checkpoint at int8.
The 110 GB claim, checked against the tensor index
The README's load-bearing number is one sentence: "Unsloth's UD-IQ3_XXS GGUF gives 110 GB of expert weights for the whole model." Everything else in the design follows from whether that is true.
You do not need to download 120 GB to find out. A GGUF file opens with a magic
word, a version, a tensor count, a key-value block, and then a tensor index that
names every tensor with its dims, its quantization type and its offset. Two
range requests per shard gets you the whole inventory. I read the four
UD-IQ3_XXS shards that way — 1,412 tensors — and summed the 126 routed-expert
tensors of layers 3 through 44, which are exactly the ones the serve kernel
loads, because kernel/serve_glm53.py loops for i in range(N_LAYERS) with
N_LAYERS = tc.num_hidden_layers = 45 and never touches blk.45, the MTP
layer.
| bytes | GB | per chip | |
|---|---|---|---|
routed experts, blk.3–blk.44 | 109,867,696,128 | 109.87 | 13.73 |
| after the engine's planar repack | 110,717,042,688 | 110.72 | 13.84 |
| MTP layer experts, never loaded | 2,623,537,152 | 2.62 | — |
| whole GGUF, all four shards | 120,367,571,715 | 120.37 | — |
110 GB is right. It is 109.87 as GGUF blocks and 110.72 once the engine has finished with it, and the README's number sits between them.
The 0.77% the repack adds is worth a paragraph, because it is the kind of detail
that is usually wrong in a README and is not wrong here. engine/glm53/planes.py
splits each GGUF block into dense 32-bit planes with the matrix row on the lane
axis, so a Pallas kernel can dequantize an expert without byte-slicing at odd
offsets. Its docstring claims "no expansion" except for the d field, which is
stored as pairs of f16 bit patterns, one u32 per two blocks. I reimplemented
plane_rows against my tensor index and got exactly that: the only growth is
the down projections whose per-chip slice is a single block, where two bytes of
scale round up to four. 849 MB total. 106 MB per chip. The docstring is precise.
The rest of the budget I had to derive, and the widget above shows how far the
derivation gets. Non-expert parameters come to 8.921B over layers 0–44 plus the
untied embedding and lm_head; at int8 that is 1.12 GB/chip. The vision tower
is the 0.563B of parameters that appear in the FP8 checkpoint but not in the
GGUF at all, which at bf16 is 0.141 GB/chip — and the config comment in
serve_glm53.py says vision: False "saves ~1 min and 0.14 GB/chip". That is
two independent routes to the same number.
Add it up and I reach 15.13 GB/chip against the 15.4 the kernel prints. The 0.28 GB I cannot itemise is XLA's own footprint and the chart shows it as a residual rather than quietly absorbing it.
The format was not a preference
Here is the part I did not expect to be so clean. Unsloth publishes ten dynamic-quant builds of this model. I pulled the expert byte count out of every one of them the same way, and the ladder decides the design on its own.
The expert budget is 14.71 GB/chip. The served build sits 0.87 GB under it once the engine’s planar repack is counted (13.84 GB/chip, not the 13.73 of raw GGUF blocks). The next rung up, UD-Q3_K_XL at 16.80 GB/chip, is over the whole 16.9 GB chip before a single non-expert weight is loaded. So the choice of a codebook format is not a preference — it is the only rung on Unsloth’s ladder above 2.6 bits that fits on a free TPU.
UD-IQ3_XXS is the largest build on the ladder that fits. The next rung up, UD-Q3_K_XL, puts 16.80 GB of experts on each chip — over the whole 16.9 GB before a single non-expert weight, the vision tower or one token of KV cache. UD-IQ4_XS is 17.96. So the codebook formats are not a taste; above 2.6 bits per weight they are the only thing on the shelf that goes in.
That single fact sets up everything that follows, because a codebook format is cheap to store and expensive to read, and the engine pays that bill on every decoded token.
What "3-bit" costs, measured
The README is careful here, and I want to quote it before I take a swing:
The output is that of a 3-bit-expert quantization, not the bf16 model. Agent tasks, long-context retrieval and tool calling behave as expected in our use; a formal comparison against the full model is on the list.
The end-to-end half of that comparison needs a TPU and an eval rig. The weight-space half needs neither, and it is the half nobody ever runs. Unsloth ships both a UD-IQ3_XXS build and a BF16 build of the same model in the same repository, so the ground truth is sitting at a known byte offset.
So I range-read matched slices — the same 512 rows of the same expert of the
same tensor, out of both files — dequantized the quantized one with the engine's
own glm53.iqquant, and measured.
kaggle-tpu-lab's README says of its 3-bit expert quantization: "The output is that of a 3-bit-expert quantization, not the bf16 model... a formal comparison against the full model is on the list." This is the weight-space half of that comparison, which does not need a TPU. I pulled matched byte ranges of the same expert matrices out of Unsloth's UD-IQ3_XXS GGUF and Unsloth's BF16 GGUF, dequantized the first with the engine's own glm53.iqquant, and measured the error against the second. The format that carries the gate and up matrices in 41 of the 42 served layers, IQ2_S at 2.5625 bits per weight, reproduces its bf16 counterpart with a 25% relative Frobenius error and a cosine similarity of 0.970. The down matrices, at IQ3_S, land at 13.9%. The three layers Unsloth spent extra bits on (11, 12, 44) get IQ4_XS down projections at 7.6%.
| tensor | expert | format | bits/w | rel Frobenius | cosine | matvec rel |
|---|---|---|---|---|---|---|
| blk.20.ffn_gate_exps | 0 | IQ2_S | 2.5625 | 0.2500 | 0.970034 | 0.2487 |
| blk.20.ffn_gate_exps | 100 | IQ2_S | 2.5625 | 0.2499 | 0.970074 | 0.2503 |
| blk.20.ffn_gate_exps | 287 | IQ2_S | 2.5625 | 0.2501 | 0.970011 | 0.2500 |
| blk.20.ffn_down_exps | 0 | IQ3_S | 3.4375 | 0.1385 | 0.991102 | 0.1387 |
| blk.20.ffn_down_exps | 100 | IQ3_S | 3.4375 | 0.1384 | 0.991111 | 0.1395 |
| blk.20.ffn_down_exps | 287 | IQ3_S | 3.4375 | 0.1397 | 0.990931 | 0.1399 |
| blk.11.ffn_gate_exps | 0 | IQ3_S | 3.4375 | 0.1375 | 0.991242 | 0.1364 |
| blk.11.ffn_gate_exps | 100 | IQ3_S | 3.4375 | 0.1375 | 0.991239 | 0.1378 |
| blk.11.ffn_gate_exps | 287 | IQ3_S | 3.4375 | 0.1377 | 0.991218 | 0.1394 |
| blk.11.ffn_down_exps | 0 | IQ4_XS | 4.2500 | 0.0764 | 0.997078 | 0.0763 |
| blk.11.ffn_down_exps | 100 | IQ4_XS | 4.2500 | 0.0767 | 0.997051 | 0.0762 |
| blk.11.ffn_down_exps | 287 | IQ4_XS | 4.2500 | 0.0763 | 0.997086 | 0.0760 |
This is weight-space error, not end-to-end quality: a 25% relative error on a gate matrix does not mean the served model is 25% worse, and the routing, the attention stack and the shared expert are untouched by it. It is a lower bound on how far the served weights are from the ones every published GLM-5.3-Flash benchmark was run on, and it is the number the README's "3-bit" rounds off. bits/weight is the GGUF block size: 82 bytes per 256 weights for IQ2_S, 110 for IQ3_S, 136 for IQ4_XS.
The number that matters is the first one. IQ2_S, at 2.5625 bits per weight, carries the gate and up projections of 41 of the 42 served layers, and it reproduces bf16 with a 25.0% relative Frobenius error. The down projections at IQ3_S are 13.9%. The three layers Unsloth spent extra bits on — 11, 12 and 44 — get IQ4_XS down projections at 7.6%.
Two honest caveats. This is weight-space error, not quality: the routing, the attention stack, the shared expert and the hyper-connections are all untouched, and a 25% perturbation of a gate matrix inside a SwiGLU does not translate into anything like a 25% capability drop. And these are three experts out of 288 on two of 42 layers; the variance across the experts I sampled was under 0.1% of the value, which is reassuring but is not a full sweep.
What the measurement does establish is the distance. Every GLM-5.3-Flash benchmark you have read was run on the bf16 or FP8 weights. The ones on this endpoint are a quarter of the way to somewhere else, on the matrices that make up most of the model.
"A dynamic 3-bit mix by layer" is dynamic by matrix, not by layer
While I had the index open I tabulated which format each of the 126 expert tensors actually uses. The README describes it as "Unsloth's dynamic 3-bit mix (IQ2_S / IQ3_S / IQ4_XS by layer)". The mix is real. The by layer is not.
| layers | gate | up | down |
|---|---|---|---|
| 3–10, 13–43 (39 layers) | IQ2_S | IQ2_S | IQ3_S |
| 11 | IQ3_S | IQ3_S | IQ4_XS |
| 12, 44 | IQ2_S | IQ2_S | IQ4_XS |
Thirty-nine of forty-two layers are identical. The allocation varies by the matrix's role — down projections always get a wider format than gate and up — and only three layers deviate at all. That is a more interesting fact than "by layer", and it is Unsloth's design decision rather than this repository's, but the README passes it along unexamined.
The kernel, and why 64 tok/s is not a bandwidth number
This is the part of the repository I most enjoyed reading, and the part the README describes least accurately.
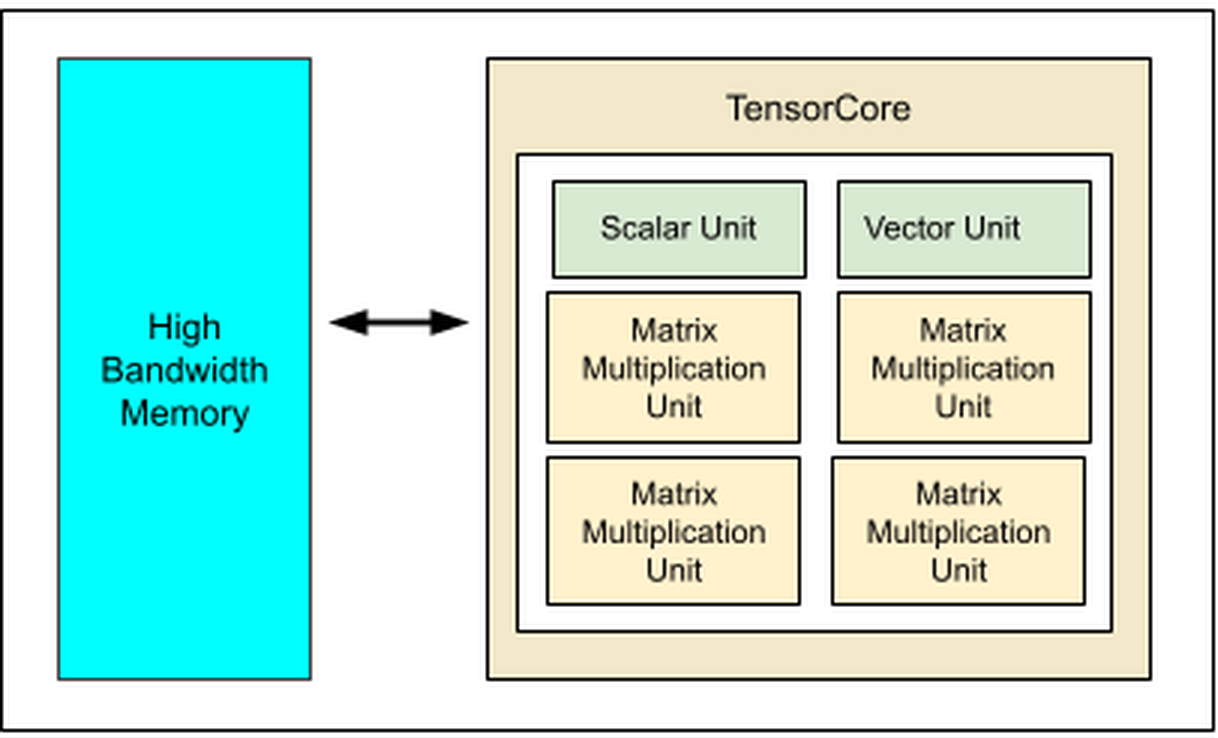
A v5e chip is a TensorCore with one scalar unit, one vector unit and four matrix multiplication units hanging off HBM:
engine/glm53/pallas_moe.py fuses dequantization into the matvec so a
dequantized expert never exists in memory. Per weight, the IQ2_S path looks up a
codebook entry with an in-vreg lane gather, unpacks two level bits and a sign
bit with shifts, converts to float and multiply-accumulates against the
activation broadcast along lanes. The codebook for IQ2_S has 1,024 entries of
8 weights, packed into eight (8, 128) table rows, so _lookup issues eight
take_along_axis gathers and seven selects for each group of eight weights.
IQ3_S is four gathers per group of four. Either way that is about one dynamic
lane gather per weight.
The author clearly knows this is the hot path, because the serve config pins the runtime for it:
# glm53-flash/kernel/serve_glm53.py
"libtpu": "0.0.42.*",            # the image's runtime is 140x slower on gathers
                                 # and cannot run Pallas kernels
"max_len": 262144,               # context capacity (tokens); a multiple of 32
"streams": 4,                    # requests decoded together (one program set per
                                 # batch size, ~2.5 min compile each)
Now put a roofline on it. The notebook's config cell publishes three rates:
"one stream ~65 tok/s, two ~40 each, three ~30 each". Fitting a step time that
is linear in the number of (token, expert) pairs a step touches — 8 experts per
token per layer, 42 sparse layers, so 336 pairs per stream — gives
step(N) = 6.62 ms + 8.97 ms × N, with residuals under 1.5% on all three
points.
1 stream · 336 (token, expert) pairs per step
- step time (fitted)
- 15.6 ms
- same bytes at 800 GiB/s
- 1.75 ms
- per stream / aggregate
- 64.1 / 64.1 tok/s
- HBM utilisation, whole step
- 11.2%
- expert bytes read
- 384.4 MB/chip
- HBM utilisation, expert half
- 5.0%
- weights dequantized, per chip
- 117.8 G/s — about one lane gather each
The fit is the project’s three published rates, nothing more; the fourth row is an extrapolation and the README says a fourth stream does not fit at full context anyway. The number that survives the modelling is the last one: the decode path is nowhere near memory-bound, because at 2.89 bits a weight is a codebook index and turning it back into a number costs a dynamic lane gather.
At one stream the expert half of a step moves 384 MB per chip and takes 8.97 ms. At the v5e's 800 GiB/s that many bytes is 0.45 ms. The engine is running the expert path at about 5% of the memory bandwidth available to it, and the whole step at 11%.
That is not a criticism. It is the point. A 2.89-bit weight is a codebook index, and the engine is issuing roughly 117.8 billion lane gathers per second per chip to turn those indices back into numbers. Whether that is the vector unit's ceiling I cannot say without a profile on real hardware. What the arithmetic does say is that the bottleneck is not HBM: 384 MB in 8.97 ms is not a bandwidth wall on an 800 GiB/s chip. The format that makes 320B fit on a free TPU is the same format that caps decode at 64 tok/s, and the ladder above says there was no other format to pick. If you want the MXUs busy you need weights the MXU can eat, and those do not fit on the chip.
Three things the README gets wrong
The decode kernel's cost is not "distinct experts"
The README describes the two Pallas paths like this:
custom Pallas kernels read them straight into the matrix multiply: a fused dequant-matvec for decode, where the cost is the number of distinct experts a step touches, and a grouped GEMM over the routed rows for prefill.
The prefill half is right. _apply_ragged_kernel calls K.ragged_plan, which
sorts (token, expert) slots by expert, and the sweep path calls
K.active_slots, whose docstring is explicit: "unique routed experts first
(ascending), the rest of the slots repeat the last active id". Deduplication,
by construction.
The decode half has no deduplication anywhere. Here is the dispatch, in
engine/glm53/resident.py:
# glm53-flash/engine/glm53/resident.py — verbatim, with elisions marked
    def apply(self, p, x, idx, w, layer, limit):
        """x [N,D]; idx [N,k] int32 into E; w [N,k] fp32 -> partial MoE output [N,D] ..."""
        gate_q, up_q, down_q = p["gate_q"], p["up_q"], p["down_q"]
        N, k = idx.shape
        if N * k <= self.gather_max_rows:
            if self.use_pallas:
                return self._apply_kernel(x, idx, w, layer, gate_q, up_q, down_q, limit)
            ...

    def _apply_kernel(self, x, idx, w, layer, gate_q, up_q, down_q, limit):
        N, k = idx.shape
        flat = idx.reshape(-1)
        qt_gu, qt_dn = self.qtypes[layer]["gate_q"], self.qtypes[layer]["down_q"]
        Xg = jnp.repeat(PL.pm_x(qt_gu, x.astype(jnp.float32)), k, axis=0)   # [Nk, W, C]
        mv = lambda planes, qt, key, X: K.moe_matvec(planes, qt, self.nblk[key], flat, X, ...)
gather_max_rows is 64 in the serve config and N * k is 8 per stream, so
every decode step takes the first branch. flat is idx.reshape(-1): every
(token, expert) pair, in token order. No sort, no unique. And moe_matvec builds its
Pallas grid straight off it — grid=(Nk, n_lb), one grid step per pair — with
the module docstring saying as much: "computes, for every expert slot i (one
(token, expert) pair)". Pallas will skip a block DMA when consecutive grid
steps ask for the same block, but flat is token-major, so two streams that
happen to route to the same expert land nowhere near each other, and the
dequantization is redone per pair regardless.
At one stream the two descriptions agree, because a token's eight experts are already distinct. At three streams they do not. With 288 experts the gap is small — under uniform routing, three tokens touch about 23.3 distinct experts against 24 pairs, so the published rates cannot tell the two models apart, and I am not claiming the numbers are wrong. The mechanism is described wrongly, and the error grows with stream count and shrinks with expert count. Anyone reading that sentence to plan a batch size is planning against a kernel that does not exist.
262,144 is the engine's context, not the model's
The README says the engine gives you "the model's native 262,144 tokens".
config.json says max_position_embeddings: 1048576. Z.ai's own model card
reports evaluations run at 300K and at 1M context. 262,144 is
CFG["max_len"] in kernel/serve_glm53.py — the engine's cap, and a sensible
one, since the chart above shows each 262k context set costs 0.23 GB/chip and
only a few fit. But it is a quarter of the model's native window, described as
all of it.
5,400 lines is 5,562
Trivial, and in the honest direction: the README says "about 5,400 lines of JAX
and Pallas in engine/glm53/". wc -l on the non-test files gives 5,562, and
the tests add another 1,989. I mention it only because it is the one place the
project undersells itself.
What they got right that almost nobody does
Compile time. On a TPU, an XLA compile can dwarf everything else, and a free-tier allocation makes it a first-order cost — and it is the thing quietly excluded from most published TPU numbers. This README does not exclude it. It puts it in the table:
Time to live endpoint — ~16 min with the serve dataset attached (weights 4 min, warm-up 9 min, the rest is the runtime, the tunnel and Kaggle's own start); ~22 min from the FP8 checkpoint.
Nine of the sixteen minutes are named as compilation, and the "Good to know"
section goes further: the warm-up is ~9 minutes with a prebuilt XLA cache
attached as a Kaggle dataset and ~14 without, because "what the cache cannot
skip is JAX tracing the programs". The warm-up loop in serve_glm53.py compiles
two prefill buckets, four batched decode program sets and four snapshot sizes,
which at the config's own "~2.5 min compile each" is where the nine minutes go.
The tok/s figures are steady-state, post-warm-up, on a warm cache. That is the right way to quote them and the README says which is which. It is the single most common place TPU claims go soft, and this one does not.
One caveat on that: the advertised sixteen minutes assumes you attach the author's prebuilt compile-cache dataset. Build it yourself from the FP8 checkpoint and the README's own number is 22.
What I actually ran
I have no Kaggle TPU, so nothing here is a throughput measurement. What I could run, I ran, on CPU.
The test suite, as far as it goes without torch. The engine claims to run on
eight virtual CPU devices — conftest.py sets
XLA_FLAGS=--xla_force_host_platform_device_count=8 — which is how the tests
work without hardware. Most of the suite needs PyTorch for its reference
implementation and I ran out of disk installing it. The four files that do not:
$ XLA_FLAGS=--xla_force_host_platform_device_count=8 python -m pytest \
    glm53/tests/test_iqquant.py glm53/tests/test_planes.py \
    glm53/tests/test_gguf_reader.py glm53/tests/test_sampling.py -q
..............................................................           [100%]
62 passed in 209.26s (0:03:29)
That includes test_real_samples_match_gguf_py, which checks the engine's
dequantizer against gguf.quants.dequantize — llama.cpp's own reference — on
committed sample bytes.
The committed fixtures are the real weights. Those samples are five .bin
files in engine/glm53/tests/data/, described by a gguf_samples.json that
names each one's source tensor. I computed each tensor's absolute offset from
the shard index, range-read the same byte count out of Hugging Face, and
compared:
| fixture | tensor | bytes | sha256 (first 16) |
|---|---|---|---|
IQ2_S | blk.3.ffn_gate_exps.weight | 2,624 | d2439faeaf446dad ✓ |
IQ3_S | blk.3.ffn_down_exps.weight | 3,520 | 81cf2df0336bd009 ✓ |
IQ4_XS | blk.11.ffn_down_exps.weight | 4,352 | 20e4affcc9e948ad ✓ |
Q6_K | blk.0.attn_k.weight | 6,720 | b410a335977ec35c ✓ |
Q8_0 | blk.0.hc_attn_fn.weight | 17,408 | 9102b8d1ac7d17db ✓ |
All five match upstream byte for byte, and the declared dims match the GGUF's. The test fixtures are real weights at real offsets, not synthetic data with a plausible name.
The decode kernel computes the right thing. Pallas runs under
interpret=True on CPU, and moe_matvec is written to allow it. So I took two
real experts of blk.20.ffn_gate_exps.weight off Hugging Face, packed them with
the engine's own planes.pack_planes, ran the shipped kernel, and compared
against dequantize-then-matvec:
planes: {'qs': (256,128), 'sg': (256,128), 'qh': (64,128), 'sc': (64,128), 'd': (16,128)}
pallas moe_matvec (interpret, CPU) out (2, 128) in 17.7s
max |kernel - dequant_rows@x| / max|ref| = 2.279e-07
KERNEL MATCHES REFERENCE
Not a TPU, not a timing, and interpret mode does not exercise Mosaic's tile-alignment rules. But the arithmetic the kernel performs on real 3-bit codebook weights is correct to float32.
Where this leaves it
Fifteen days separate this repository's first commit from its current HEAD, and in that time it put a 320B mixture-of-experts on hardware you get for free by verifying a phone number. Whether it is the first engine to run this model on a TPU I cannot prove — the project claims it only "as far as we know", and I found nothing to contradict it. The memory claim, the one everything else hangs on, is accurate to 0.12% against the tensor index, and the design choice behind it turns out to have been forced rather than chosen. The code is better than the README, which is the right way round and rarer than it should be.
The README's decode sentence is wrong about its own kernel. Its context number is off by 4×. And the quantization it ships is a quarter of the way from bf16 on the matrices that dominate the model — a number that was sitting in a byte range the whole time, waiting for someone to subtract.
If you run this on a TPU, the two numbers I would most like from you are a real decode rate at four streams and a short-context needle test against the bf16 model. I could not get either.
What would change my mind
5 claims above, and what would falsify each
110 GB of expert weights is accurate.
A recount of the UD-IQ3_XXS tensor index that disagrees with 109,867,696,128 bytes over
blk.3–blk.44, or evidence that the serve kernel loadsblk.45’s experts after all — it would add 2.62 GB and 0.33 GB/chip. Unsloth requantizing and reuploading the build would also move it; my read is dated 18 September 2026.The decode path does not deduplicate experts across streams.
A sort or a unique-ing step between
idxandK.moe_matvecthat I missed, or a Pallas revision where the pipeline elides a repeated block index that is not adjacent in the grid. Either would make the README’s sentence right and this section wrong.IQ2_S sits 25% from bf16 in relative Frobenius error.
Rerunning the same range reads on more experts and more layers and getting materially different numbers, or a bug in
glm53.iqquantthattest_iqquant.pydoes not catch — though it checks against llama.cpp’s own reference, so that bug would have to be in both.The decode path runs at roughly 5% of HBM bandwidth.
A profile on an actual v5e-8 showing the expert kernels DMA-bound rather than VPU-bound. My figure is arithmetic on three published rates and a byte count, not a trace, and a different fixed/variable split would move it. The direction holds — 384 MB in 8.97 ms is not a bandwidth limit on an 800 GiB/s chip — but the exact percentage is not.
UD-IQ3_XXS is the largest Unsloth build that fits on a v5e-8.
A build I have not counted, a non-Unsloth quantization between 2.9 and 3.5 bits, or an engine change that frees more than 1.9 GB/chip — offloading the vision tower and running one context instead of three would get close.