2026-10-16 · 20 min · mixture-of-experts · pretraining · training · scaling-laws · distributed-training · microsoft
A 2:03 narrated explainer, drawn in code. Every number and picture in it is this article's own; the sources are below.
› transcript
Hi, I'm Pumice! Microsoft AI just finished pre-training MAI Base Two. Here is how it works, and whether its numbers add up. The trick is making expert imbalance cheap: it costs a little time, never memory or dropped tokens. Each token is routed to seven of five hundred and twelve experts, plus one shared expert. Experts sit in groups, each with a fixed number of token slots, so memory never changes. A hot expert borrows empty slots from its neighbours. What still overflows runs in another round. Nothing is dropped and nothing crashes. A load balancing loss still nudges the router. In round zero every group has tokens, and communication overlaps the compute. In round one only two groups overflow. The round count is global, so the third waits. Muon needs whole matrices, but the momentum is sharded. Each GPU updates its own slice of the momentum. One exchange hands every GPU a set of complete matrices. It orthogonalises them locally. A second exchange sends the updates home. It all costs about two percent of a step. Here is the formula. Training cost is about six times active parameters, eighty billion, times training tokens, fifty trillion. That is the work the cluster has to deliver. Sixteen thousand GPUs, thirty-eight days, twenty-one percent utilisation, eighty-nine percent goodput. The sides agree within about five percent. Microsoft reports matching DeepSeek's base model with four to twelve times fewer FLOPs, measured on its own test sets. Imbalance became a scheduling cost, not an outage. To recap: fixed memory with extra rounds, Muon by resharding, and numbers that close. Every source is in the full article. I'm Pumice. Bye!
Why read this
Solidtop 85%MAI-Base-2 from Microsoft's own report: the dropless MoE, Muon at 16k GPUs, a 6ND check that closes, and what the 4.2-12.3x is measured on.
- Original analysis
- A new technique
- Concrete numbers to act on
Training & RLNothing to runProprietaryPractitioner model
How this was scored
- Is it new?
- 2 of 3: A real new idea, method or capability
- Can I trust it?
- 2 of 3: Measures key facts from files, code or configs
- Can I run it?
- 0 of 3: Closed, nothing to run
- Will I understand it?
- 2 of 3: Mechanism from first principles with figures
- Can I act on it?
- 2 of 3: A concrete recipe, numbers or comparison
- Will it last?
- 1 of 3: Relevant for months
- Does it affect many?
- 1 of 3: A specialist community
- Only here?
- 2 of 3: A teardown or measurement few others did
Score 56 of 100, ranked 397 of 577 rated articles. Each question is answered 0–3 by hand, and a 3 is rare. How articles are scored
On 15 October 2026 Microsoft AI published a lab note, Frontier Pre-training at Microsoft AI, with a 13-page PDF. It announces that pre-training of MAI-Base-2 is finished: a mixture-of-experts base model with 80B active and 2.8T total parameters, trained on 50T tokens over 38 days on 16k GB200 GPUs. It is a base model only. Post-training is still running, there are no downstream benchmarks, and the weights are not public.
The summary most people saw was bycloud's post: Muon with a smooth loss, a model that "didn't care about expert imbalance", the same pre-training quality as DeepSeek-V4-Pro-Base with 4.2-12.3x fewer FLOPs, 21% MFU and 89% goodput. Every number in this article comes from Microsoft's PDF or from DeepSeek's own model card, not from that post. Each one is labelled:
- reported: the publisher's figure, not re-run;
- reasoned: my arithmetic on reported figures;
- measured: read from a file myself. Nothing here can be run. There are no weights to load.
Short version: the systems numbers are internally consistent, and the 6ND arithmetic closes to within about 5%. The architecture is legible from the table Microsoft printed. One of bycloud's lines is a misreading: Microsoft cared about expert imbalance enough to build a scheduler around it. The 4.2-12.3x claim is real, but it lives on Microsoft's own held-out evaluations and its own scaling law, and the spread across those evaluations is the most informative thing about it.
The claims, checked against the PDF
| bycloud's line | What the PDF says | Status |
|---|---|---|
| used Muon, smooth loss | Muon on non-embedding 2D parameters, AdamW on the rest; Figure 5 shows a loss curve with none of MAI-Base-1's spikes | reported, holds |
| didn't care about expert imbalance | a multi-round dropless MoE that runs overflow tokens in extra rounds, plus a load-balancing loss batched across layers | misread |
| 4.2-12.3x fewer FLOPs than DeepSeek-V4-Pro-Base | 4.2-12.3x, from scaling-law projections on four held-out bits-per-byte evaluations | reported, holds as stated |
| 2.8T parameters, 38 days, 16k GB200s | 80B active / 2.8T total, August and September 2026 | reported |
| 21% MFU, 89% goodput | MFU normalised by 2.5 PFLOPS, GB200's BF16 peak, excluding rematerialisation and optimizer FLOPs | reported, closes (below) |
| 50T training tokens | 50T-token mixture, 18% of it vision-language data | reported |
The model
Microsoft printed a side-by-side table of MAI-Base-1 and MAI-Base-2. The rows that matter, all reported:
| MAI-Base-1 | MAI-Base-2 | |
|---|---|---|
| Active / total parameters | 35B / 1T | 80B / 2.8T |
| Layers | 78 | 102 |
| Hidden dimension | 6656 | 8704 |
| MoE layout | alternating dense FFN and MoE | MoE in every layer |
| Routing | 0 shared + 8 of 512 routed | 1 shared + 7 of 512 routed |
| MoE down-projection dimension | 3072 | 4096 |
| Expert FFN dimension | 10240 | 8704 |
| Attention heads, KV / Q | 8 / 80 global (every 6 layers), 8 / 80 local | 2 / 96 global (every 6 layers), 16 / 96 local |
| Embeddings | tied | untied |
| Training tokens | 30T | 50T |
| Optimizer | AdamW | Muon (non-embedding 2D), AdamW |
| FP8 | tensor-wise delayed scaling | MXFP8 E4M3 |
| Vision | text only | native VLM, encoder-free |
A few things follow from that table.
It is sparser. 80B of 2.8T is 2.9% of the weights touched per token, against 3.5% for MAI-Base-1 (reasoned). Each token picks 7 of 512 routed experts, 1.4%, plus one shared expert that every token passes through. If you want the basics of routing first, the MoE from scratch piece builds a router line by line, and the mixture-of-experts architecture page has the diagram.
The experts live in a smaller space. The table lists a "MoE down projection dimension" of 4096 and notes that the shared expert "is not down/up projected". My reading, which the PDF does not spell out: a token's 8704-wide hidden state is projected down to 4096 before it is dispatched to the routed experts and projected back up afterwards. That roughly halves the bytes each token moves in the all-to-all. Kimi K3's LatentMoE makes a similar trade.
Attention is mostly local. One layer in six is global, and the global layers have 2 KV heads for 96 query heads. The other layers are sliding-window, with 16 KV heads. Microsoft does not give the window or the training sequence length, and does not discuss the choice. The obvious effect is a small KV cache at long context: the attention and KV-cache page explains why the few global layers dominate it.
The ladder formula reproduces the table. Microsoft says each rung of its scaling ladder is set by its layer count alone. Hidden size is , and the query-head count is rounded to the nearest multiple of 16. Plug in the two production models. and , both exact. 102 rounds to 96 query heads and 78 rounds to 80, both matching (reasoned). So MAI-Base-2 is literally rung L102 of the ladder, which is how Figure 3 labels it.
"Didn't care about expert imbalance": what they actually did
In an MoE layer the router decides how many tokens each expert gets, and nothing forces that number to be even. Hot experts get more than their share. Frameworks usually choose one of two answers:
- Drop. Give each expert a fixed capacity and drop the overflow tokens; they skip the layer. Memory is fixed, but the model loses work. Microsoft reports that "dropping tokens leads to worse performance."
- Pad. Allocate enough memory for the worst-case expert. Nothing is lost, but memory is sized for a rare spike. Microsoft found that dynamic routing also fragmented memory, and that memory could otherwise have gone to less activation recomputation.
MAI-Base-2 does a third thing, which the PDF calls multi-round dropless MoE. The experts on each expert-parallel rank are put into groups. Each group runs one or more dispatch → compute → collect rounds, with a fixed per-expert token capacity. An expert that receives more than its capacity processes the overflow in another round. Before that happens, an overloaded expert may borrow unused capacity from a quieter expert in the same group. The backward pass recomputes per group on the same multi-round schedule. Memory stays fixed whatever the router does. Capacity is a dial between memory and extra rounds, and Microsoft sets it so that steady state is a single round.
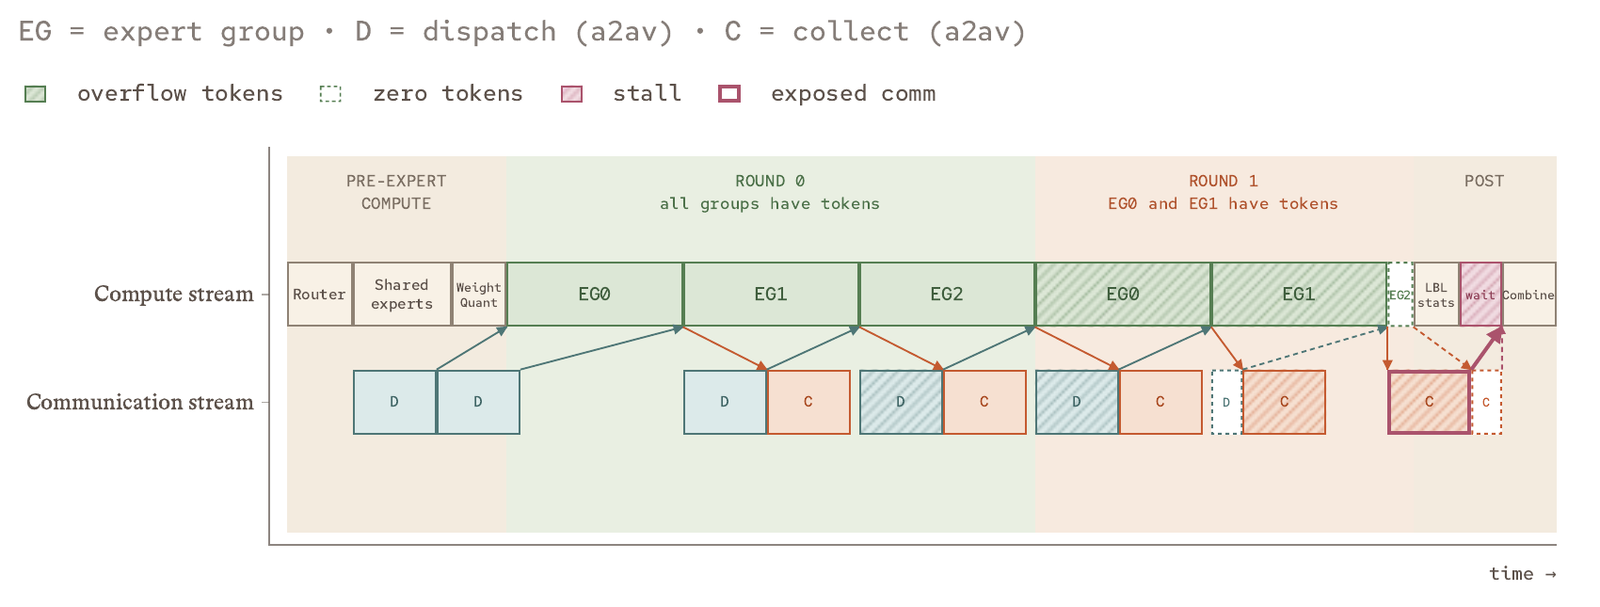
Two details in that figure answer the bycloud line. The round count is global: one overflowing group makes every group run another round. And the post-expert block is labelled LBL stats, the load-balancing-loss statistics. The text confirms it: Microsoft batches "load-balancing loss across layers, replacing per-layer all-reduces with a single batched reduction." So imbalance is still penalised during training. What changed is that a bad step costs an extra round of time instead of a crash or dropped tokens. "Didn't care" is the wrong summary. "Made it non-fatal" is closer.
The widget uses made-up loads on eight experts. Raise the routing skew and the hottest expert passes the capacity line. Dropping would lose those tokens. Padding would size every expert's buffer for that one expert. The multi-round schedule keeps memory at experts × capacity and pays in rounds. Larger groups let the hot expert spill into its neighbours' unused slots, so fewer rounds are needed. That borrowing is why the grouping exists.
The same section explains why MAI-Base-2 is MoE in every layer when MAI-Base-1 alternated. Microsoft says MoE-everywhere always had a FLOPs advantage. On MAI-Base-1, though, the implementation made it slower in wall-clock time. Fixing memory fragmentation and per-expert overhead raised the MFU of the MoE layers from 24% to 35% (reported). The overhead work grouped GEMMs and NVLink traffic per expert group, kept token metadata on the device, and did all-to-all over symmetric memory. That made every-layer MoE pay off on the clock too. Microsoft calls the metric behind this choice efficiency gain: compute to reach the baseline's loss, counted in FLOPs or in wall-clock time. It reports deciding mainly on the wall-clock version.
Muon at 16k GPUs
Muon replaces a 2D weight's momentum update with its nearest orthogonal matrix, computed by a few Newton-Schulz iterations. The catch at scale is that Newton-Schulz needs the whole matrix. ZeRO-style sharding splits momentum across data-parallel ranks, so no GPU has a whole matrix.
Microsoft's fix, following prior work, has four steps (reported):
- each GPU updates its FP32 momentum shard and casts it to BF16;
- one all-to-all, batched over parameters of the same shape, gives each GPU ownership of a subset of full momentum matrices;
- each GPU orthogonalises its matrices locally with a symmetry-aware Newton-Schulz kernel;
- a second all-to-all sends the updates back to their shards, which cast them to FP32 and apply them.
Router weights are replicated instead of sharded and get an all-gather after Newton-Schulz. Resharding metadata is cached, which matters in a model with "thousands of identically shaped parameters."
The cost after optimisation was 165 ms, 2.1% of the average iteration (reported), against a communication-bound theoretical floor of 55 ms. That pins the iteration length: 0.165 / 0.021 ≈ 7.9 s per step (reasoned). At the run's average token rate, worked out below, that is about 134M tokens per step and about 372k steps over 50T tokens. This assumes the iteration time was constant, which the PDF does not claim (reasoned).
Muon is not what separates MAI-Base-2 from DeepSeek-V4-Pro. DeepSeek's own model card lists the Muon optimizer as one of V4's changes (reported). Both models in the headline comparison were trained with it.
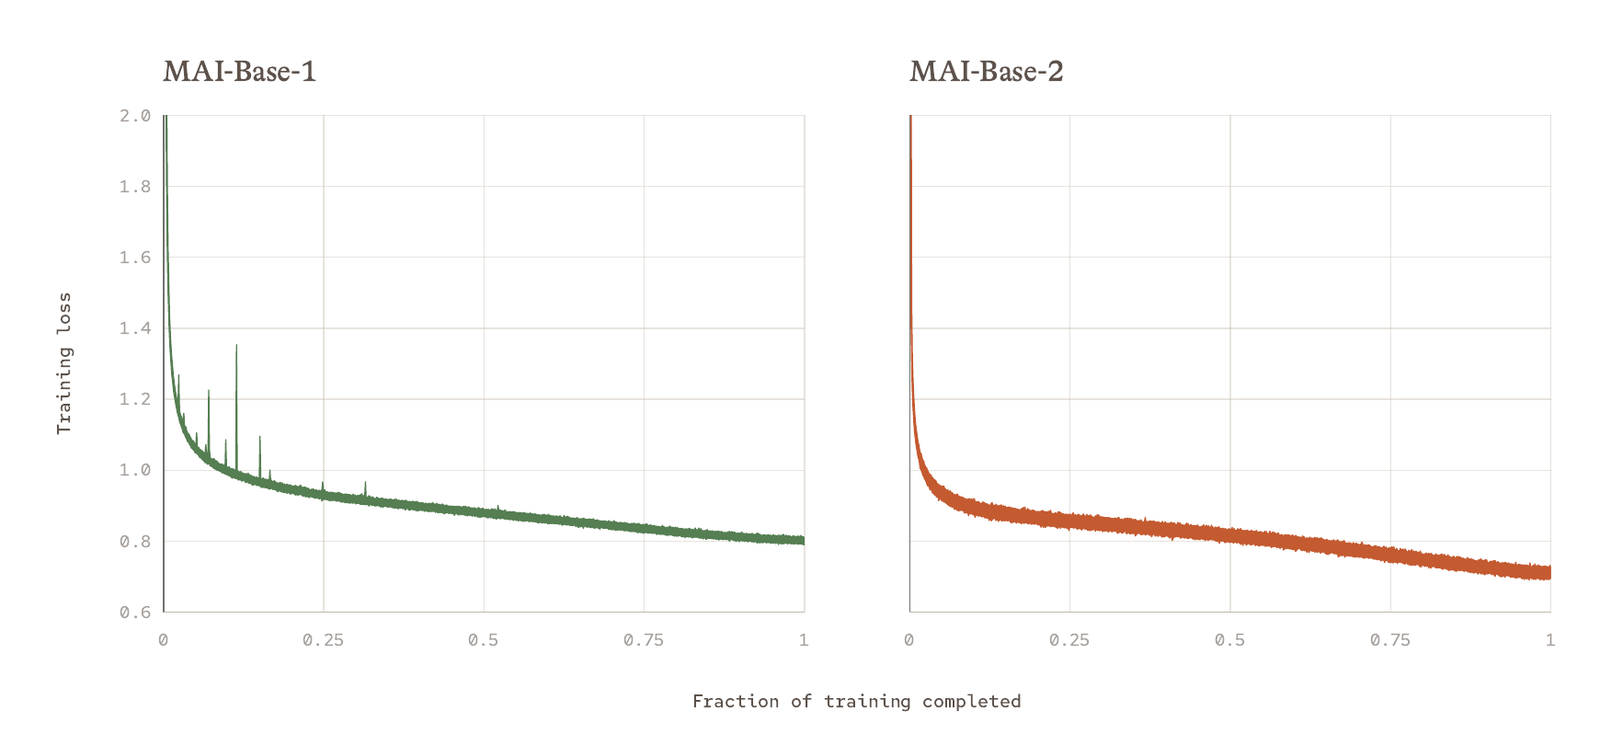
What Microsoft credits for the smooth loss is Muon plus activation gradient clipping. Ordinary clipping rescales the whole batch's weight gradient when one outlier blows up the norm, which also shrinks every well-behaved example. Microsoft clips gradients on activations at selected points instead, so only the outlier is affected. Its Figure 8 shows the gain growing with scale, reaching +28% efficiency at the L42 rung (reported). Most changes they test give a roughly constant gain. Clipping is also a data-debugging tool: their Figure 9 is a code sample whose licence header was cut off mid-sentence by a preprocessing bug, found because its gradient was clipped.
Do the systems numbers add up?
This is the part a reader can check without trusting anyone. Training compute for a transformer is about FLOPs. is the active parameter count, is the token count, and the 6 is 2 for the forward pass plus 4 for the backward pass. A cluster delivers its peak rate times the wall-clock time times the fraction of peak it actually used. If Microsoft's numbers are consistent, the two sides should meet.
The numbers (reasoned, from reported inputs):
| Quantity | Value |
|---|---|
| Needed, | FLOPs |
| Wall clock, 38 × 86,400 | 3,283,200 s |
| Peak over the run, 16,384 GPUs × 2.5 PFLOPS | FLOPs |
| × 21% MFU | |
| × 21% MFU × 89% goodput | |
| needed ÷ delivered, 16,384 GPUs | 0.955 |
| needed ÷ delivered, exactly 16,000 GPUs | 0.978 |
With goodput applied, the run delivered what needs to within 2-5%, depending on whether "16k" means 16,000 or 16,384. The small surplus is about the size you would expect from attention FLOPs, which leaves out and an MFU count normally includes. Without goodput the cluster would have done about 18% more work than needed. So the 21% reads most naturally as MFU over productive time, with the 11% of lost time, about 4.2 days, counted separately. Microsoft does not say this in words; the arithmetic says it.
Three more things the arithmetic shows:
- Per GPU, the productive rate is 50T ÷ (3,283,200 s × 0.89) ≈ 17.1M tokens/s across the cluster. That is about 1,044 tokens/s per GPU at 16,384 GPUs, and 6 × 80B × 1,044 ≈ FLOP/s, 20% of 2.5 PFLOPS (reasoned). It is the same number seen from the other side.
- The denominator is BF16. The run's matmuls use MXFP8 E4M3, and on Blackwell the dense FP8 tensor-core rate is twice the BF16 rate (NVIDIA's spec). Against an FP8 peak of 5 PFLOPS, the same run reads as about 10.5% MFU (reasoned). Microsoft states its normalisation, which many reports do not. Compare MFU figures only when they share a denominator.
- Rematerialisation and the optimizer are excluded. Recomputed activations are real work the GPUs did, so hardware utilisation was higher than 21%. MFU is defined to count only the model's own FLOPs.
The reconciler starts at Microsoft's stated numbers. Change one input and the "implied MFU" readout shows what the others would need to be for the story to hold. Switch the peak to FP8 to see how far the denominator moves the headline.
What "4.2-12.3x fewer FLOPs" is measured on
This is the claim that travelled, so it is worth reading the method closely. Microsoft evaluates base models by bits per byte (BPB) on held-out text, because BPB does not depend on the tokenizer. There are four evaluation sets: held-out code from Microsoft's own codebase, and STEM, Math and Q&A sets commissioned from vendors. All four were decontaminated against the training data. Figure 1 compares the base models on them.
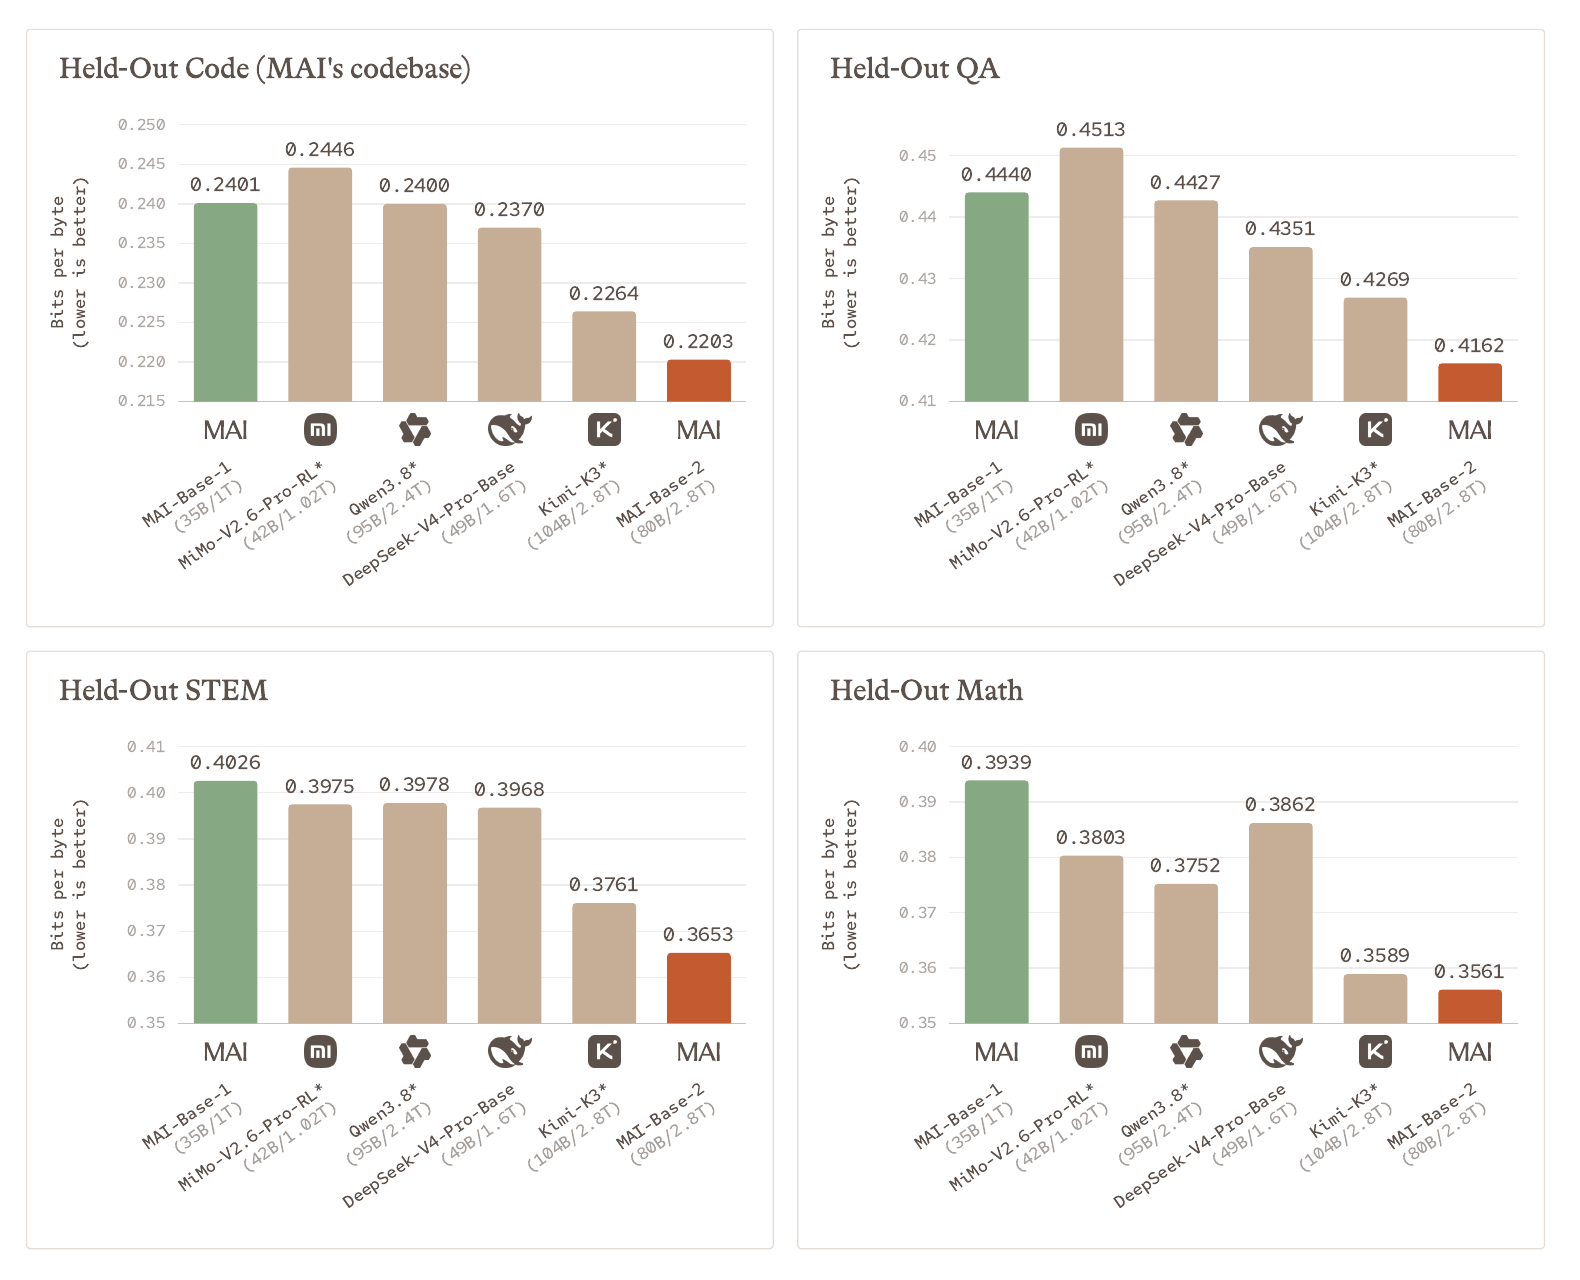
Read the axes before the bars. Each panel starts near the lowest value, so the gaps look larger than they are. Against DeepSeek-V4-Pro-Base, MAI-Base-2's BPB is lower by 7.0% on code, 4.3% on QA, 7.9% on STEM and 7.8% on math. Against Kimi K3, the closest model, it is lower by 2.7%, 2.5%, 2.9% and 0.8% (reasoned from the printed values). Kimi K3, Qwen3.8 and MiMo-V2.6 appear only as post-trained checkpoints, and Microsoft notes that post-training may affect BPB. See the site's pieces on Kimi K3, MiMo-V2.6 and Qwen3.8's open weights for what those models are.
The FLOPs-efficiency number comes from a different step. For each of the four evaluations, Microsoft fits a scaling law of BPB against training FLOPs over its ladder (L18 to L42, plus MAI-Base-2 itself). It then asks how much compute a model on that ladder would need to reach DeepSeek-V4-Pro-Base's BPB. Dividing DeepSeek's actual training compute by that number gives the efficiency ratio.
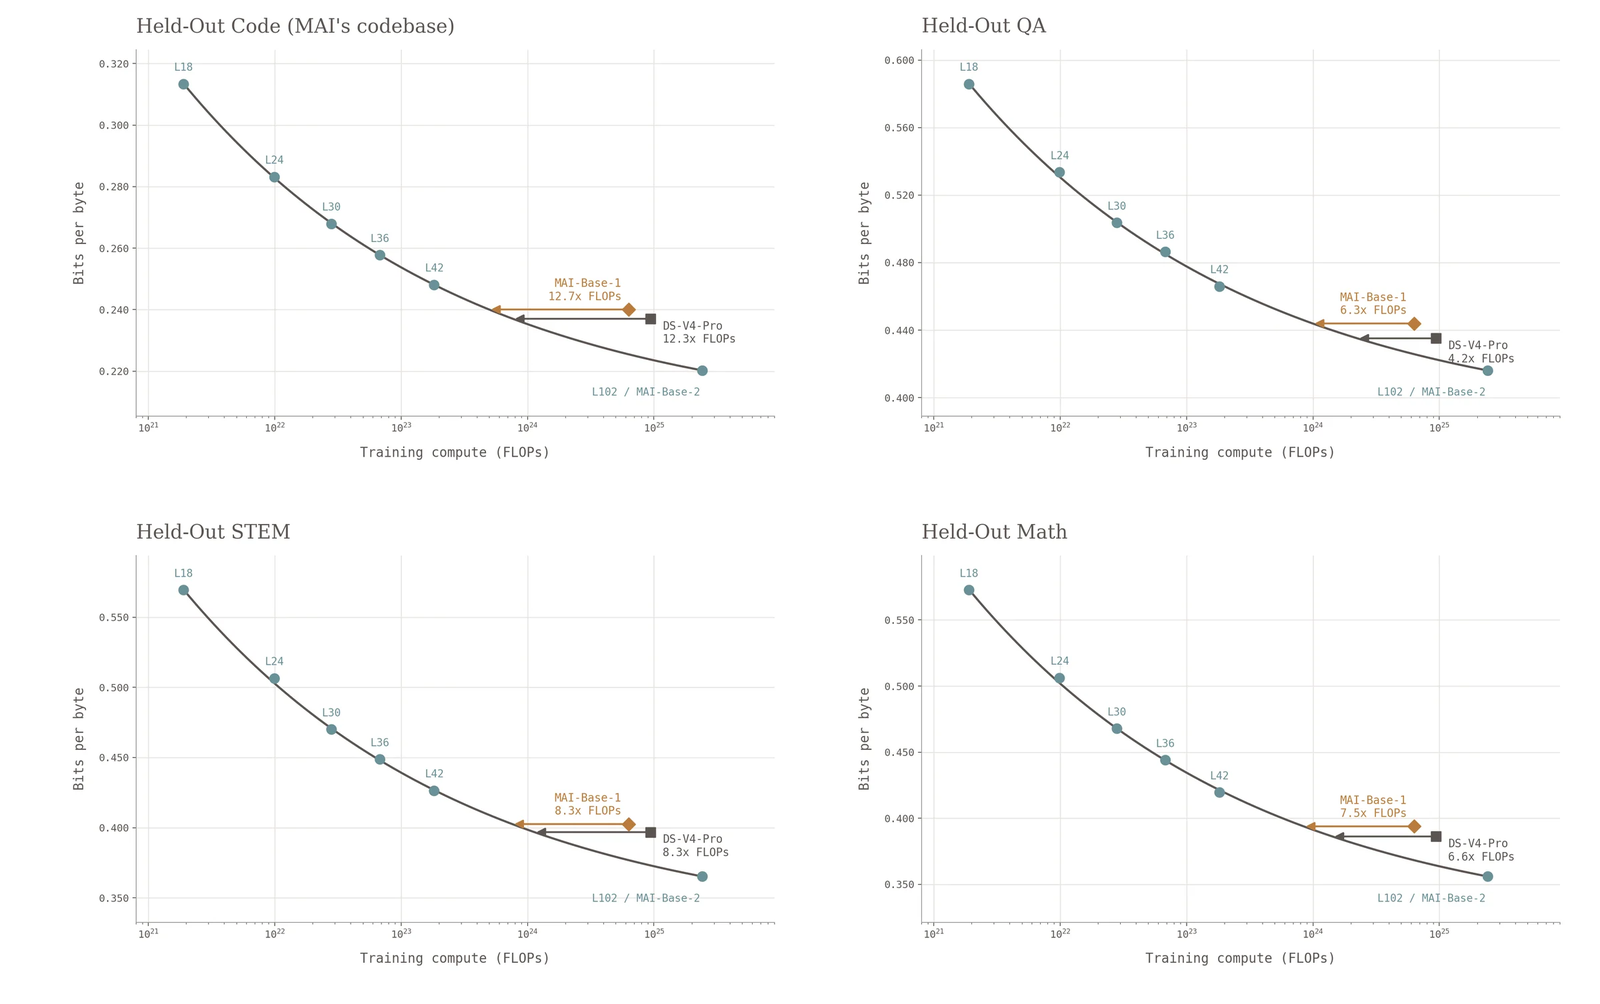
The per-evaluation numbers are in the plot labels, not the text (reported):
| Held-out set | vs DeepSeek-V4-Pro-Base | vs MAI-Base-1 |
|---|---|---|
| Code (Microsoft's codebase) | 12.3x | 12.7x |
| QA | 4.2x | 6.3x |
| STEM | 8.3x | 8.3x |
| Math | 6.6x | 7.5x |
What I make of it:
- DeepSeek's compute is easy to estimate, and the plot agrees. DeepSeek's card gives 49B activated parameters and pre-training on "more than 32T" tokens (reported). FLOPs (reasoned, a lower bound). The DeepSeek point in Figure 3 sits just under . The MAI-Base-1 point sits where would put it. Microsoft does not print the compute it assumed for DeepSeek, but the plot is consistent with plain .
- The matching compute is small. At 4.2-12.3x, the MAI recipe needs roughly to FLOPs to match DeepSeek (reasoned). MAI-Base-2 itself used , about 2.55x DeepSeek's compute. So the BPB lead in Figure 1 has two causes: a better recipe, and about two and a half times the training compute. Microsoft says as much: it "put that saving into training a larger model."
- The spread follows the data. The largest ratio is on Microsoft's own code, and the training mixture is 45% code (Figure 10 below). The smallest is on vendor-written Q&A. A lab's recipe looks best on the distribution it trains hardest on. That does not make the number false. It means "4-12x" is a range over four evaluations Microsoft chose, and its top end is the one closest to home.
- It is interpolation, which is good. Including MAI-Base-2 in the fit keeps every matching point inside the fitted range instead of extrapolating beyond it. The cost is that the "efficiency" is a property of one fitted curve per evaluation, with no error bars given.
- Base versus post-trained. DeepSeek-V4-Pro-Base was the only released base checkpoint over 1T parameters, which is why it is the reference. The comparison is like for like there, and only there.
Scaling science: ladders, source scaling and hyperparameter laws
Two methodological pieces deserve a mention because they are what Microsoft credits for a run whose loss was "smooth over the full training horizon."
Source scaling. A ladder holds tokens per active parameter (TPP) fixed. But the full run repeats some datasets: Figure 10 shows a large share of repeated tokens. A small rung trained on fewer tokens would see each dataset fewer times, which favours under-regularised choices that later overfit at scale. Microsoft's fix is to shrink the pool of unique samples on small rungs, so every dataset is repeated the same number of times at every scale. The PDF's example: a dataset repeated 8 times over the 50T run is looped 8 times over 1/10 of the data in a 5T run. Microsoft calls this "key to scaling up to a 2.8T parameter model reliably."
Hyperparameter laws. Learning rate and weight decay are coupled, so Microsoft sweeps against , fits a 2D quadratic, and models the minimum. The reported laws are:
The first has exponent −1 in steps: the decoupled weight-decay time scale is a fixed fraction of training. The second has roughly −0.5 in steps, the familiar "multiply LR by when you double the batch" rule (reported). The PDF's plot prints the same fit to one more digit (−1.505, 0.174, −0.572), so the text has simply rounded.
I can evaluate these for MAI-Base-2, with stated caveats (reasoned). TPP = 50T / 80B = 625. Take the ~372k steps estimated above and natural logs; the figure's axes only make sense in natural log. That gives and . Microsoft did not publish its batch schedule, so treat these as the order of magnitude, not the setting. The dropout law, , evaluates to about 0.25 at 80B under the same natural-log reading. That is a lot of dropout for a pre-training run. It fits a recipe built around repeated data, but the PDF does not say where the dropout is applied, so I cannot check it further.
The data
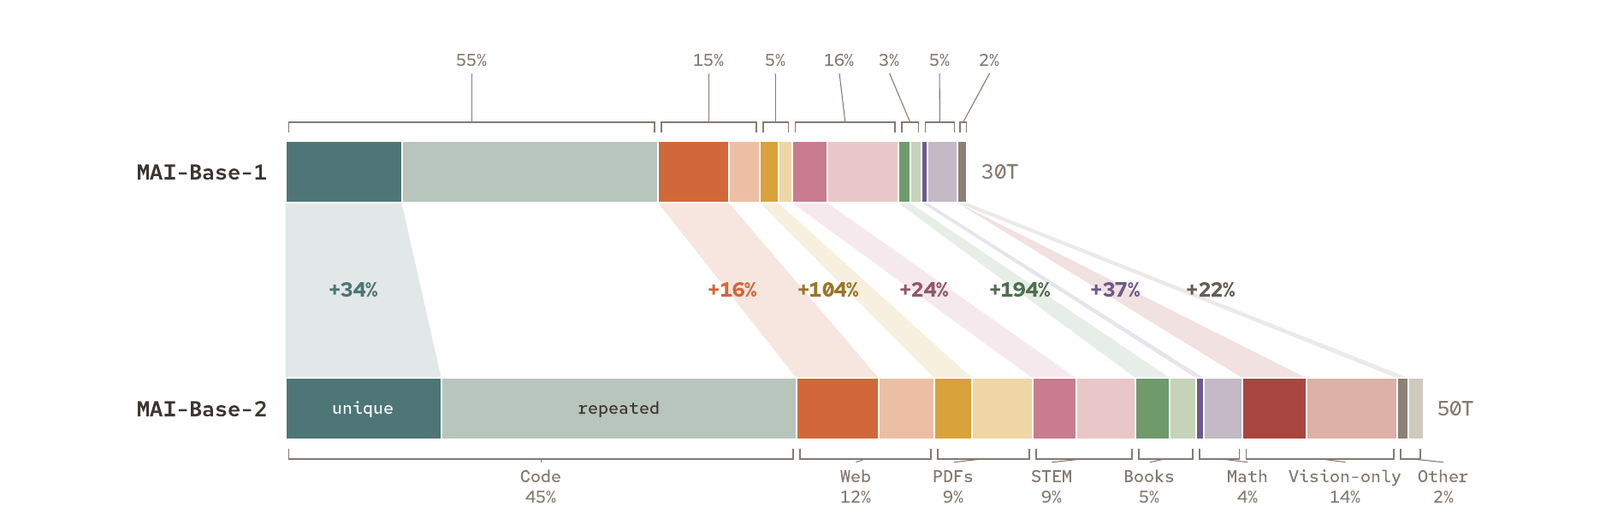
All reported: the unique-token corpus grew by about 36% over MAI-Base-1. The web crawl has a March 2026 knowledge cutoff. Embedding-based diversity sampling was used to favour novel data. There is no distillation from other models. MAI-Base-2 is natively multimodal with no separate vision encoder. Its vision-language corpus holds 4.5T unique tokens, and with repetition it makes up 18% of the 50T mixture. Code is 45% of the mixture, roughly 22.5T tokens (reasoned), and a large share of it is repeated. That matters for reading the code result above.
What is not here
- Weights. Not released. Microsoft says its data provenance "will enable us to license our model weights to trusted partners through Foundry." That is licensing, not open weights. The comparison is against open models, but the model itself is closed. It belongs with Microsoft's other in-house models such as MAI-Image-2.5 and MAI-Voice-2.
- Downstream results. BPB only. No MMLU-style accuracy, no code pass rates, no post-trained model.
- The training setup. No sequence length, attention window, batch schedule or parallelism layout.
- Uncertainty. The efficiency ratios are single numbers from single fits.
The take
This is an unusually concrete pre-training report from a frontier lab. It states the size, the cluster, the days, the MFU with its denominator, and the goodput. Those numbers survive the first test anyone should run: for 80B active parameters and 50T tokens is FLOPs, and 16k GB200s at 21% of BF16 peak for 89% of 38 days deliver -. The architecture table and the ladder formula agree to the digit.
The interesting engineering sits under the slogans. "Didn't care about expert imbalance" is really a dropless MoE with fixed memory and a global round count. Imbalance became a scheduling cost instead of an outage, which is what let every layer be MoE. Muon at this scale is mostly a resharding problem, solved at 2.1% of the step. The 4.2-12.3x is real on Microsoft's terms: four of its own held-out BPB sets, one fitted curve each, with the top of the range on its own code. It is also not the whole lead. MAI-Base-2 spent about two and a half times DeepSeek-V4-Pro's compute, and that shows in Figure 1 too.