2026-10-06 · 19 min · agents · harness · benchmarks · rust
Why read this
Hightop 30%Re-aggregates OpenHuman's benchmark logs on tasks all three harnesses solved: model time is equal; its lead is start-up and fewer calls, and it solves fewer.
- Original, source-checked analysis
- Concrete numbers to act on
- Open code or weights
Agents & harnessesAPI onlyPractitioner tool
How this was scored
- Is it new?
- 1 of 3: An incremental tweak
- Can I trust it?
- 3 of 3: Reproduces the headline result, or shows from primary files it is wrong
- Can I run it?
- 2 of 3: Open code or weights with real limits
- Will I understand it?
- 2 of 3: Mechanism from first principles with figures
- Can I act on it?
- 2 of 3: A concrete recipe, numbers or comparison
- Will it last?
- 1 of 3: Relevant for months
- Does it affect many?
- 1 of 3: A specialist community
- Only here?
- 3 of 3: The only place this analysis exists
Score 68 of 100, ranked 122 of 445 rated articles. Each question is answered 0–3 by hand, and a 3 is rare. How articles are scored
Two posts crossed my feed on 5 October. One, from @exploraX_, says OpenHuman "is the #1 trending tool on GitHub right now. that's because it beat OpenClaw and Hermes on efficiency. it's built to be more lightweight, uses less RAM & CPU, and delivers results much faster." It quotes @marcusyul, who ran "Summarize my emails" with "the exact same prompt" on the "same inbox, same task" and found "the speed gap is wild", adding that OpenHuman shows "your context window live" and "what each session costs".
Those are four claims: lighter on RAM and CPU, faster, a live context view, and trending at number one. Each can be checked against something. I cloned tinyhumansai/openhuman at 60a0343, openclaw/openclaw and NousResearch/hermes-agent at their 6 October heads, and the vendor's separate benchmark repository tinyhumansai/openhuman-benchmarks at 35af7e8. I ran none of them. Everything below comes from reading code, re-adding up committed logs, and stepping through the posted video one frame per second.
The short version: the repository is more careful than the posts. It ships a controlled cross-harness benchmark, a contamination warning on its own results, and a findings file listing its own bugs. The posts kept the favourable rows.
- license
- GPL-3.0
- branch
- main
- tests
- 1167 files
- source
- 45.3 MB
- commit date
- 2026-10-06
by size of tracked source at this commit, file counts in brackets; docs, data and vendored trees excluded
local clone, 2026-10-06 at 60a0343 — branch, commit, commitDate, fileCount, hasTests, languages, license, licenseFile, shallow, testFileCount
shallow clone: counts describe the pinned tree, not the history
What OpenHuman is
OpenHuman is a Rust core with four front ends: a Tauri desktop app, the same single-page app in a browser, a ratatui terminal client, and a Rust library (openhuman-embed). The README pitches it as "lightweight, modular, and pluggable into whatever LLM, memory, or search engine you already run."
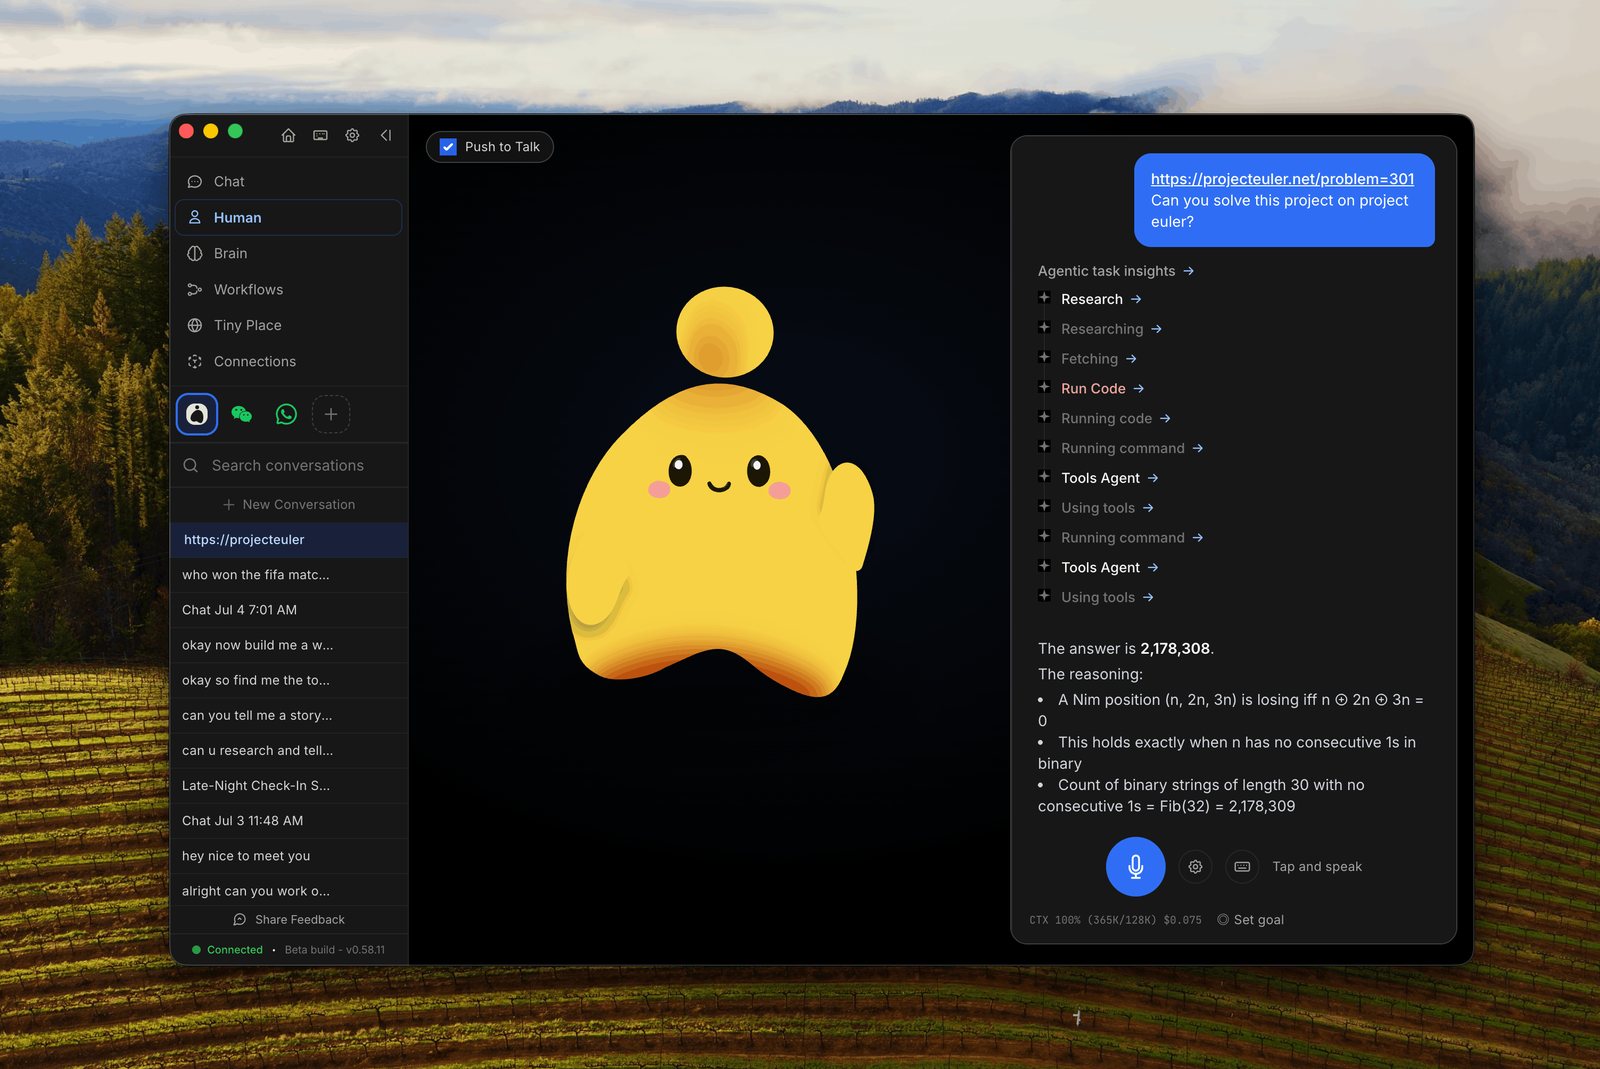
The part that matters for the efficiency claims is the shape of the process. OpenHuman runs its core in-process: one Runtime per process, then any number of Agents on it, each with its own provider, tools, prompt and sandbox. OpenClaw is a TypeScript daemon on Node 24 or later. Hermes Agent is Python (the repo has 8,170 .py files against 3,015 .ts, measured), with sub-agents run as separate subprocesses. A Rust binary with agents as tasks inside one address space should use less memory than a Node process or a Python interpreter per agent. The rest of this article is mostly about whether that becomes speed.
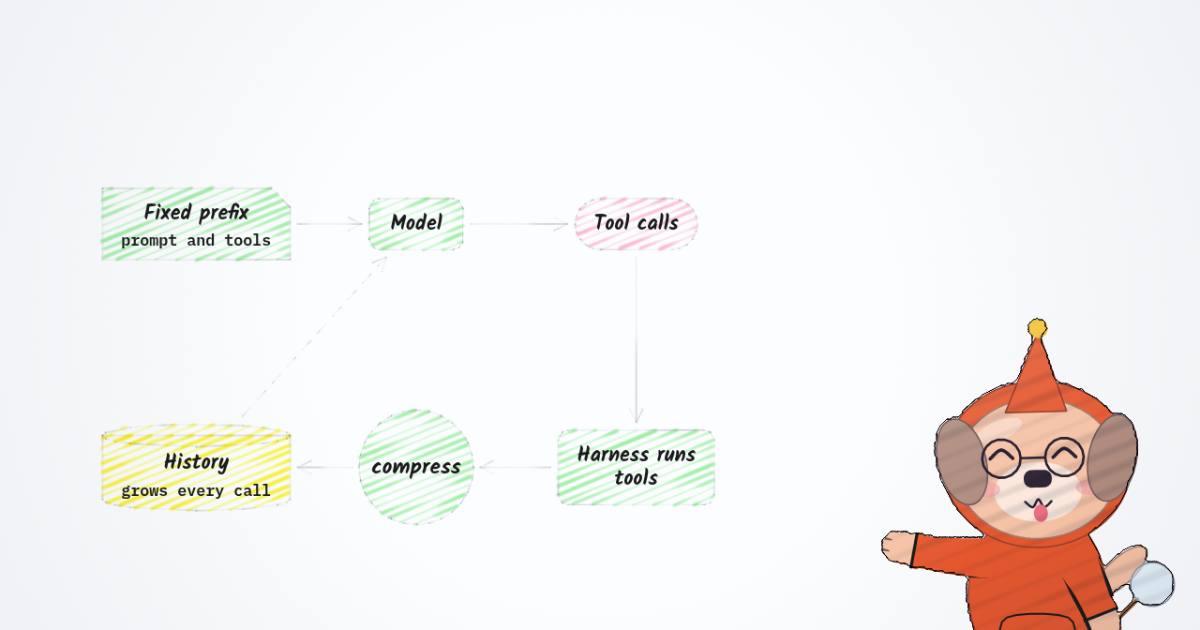
Inside the core, a turn is a tool-calling loop borrowed from a vendored crate, tinyagents. The model gets a system prompt and a set of tool schemas. It either answers or emits tool calls. The harness runs those calls, appends the results, and asks again. Three OpenHuman pieces sit on that loop:
- Tool dispatch. Tools go to the model either as JSON schemas in the API's
toolsfield (thenativedispatcher) or rendered as text into the prompt (the olderpythondialect). The benchmark pinsnative, because the text dialect "leaked tool calls into the reply" and scored 3/10 in the first run (reported,RESULTS.md). - Tool search. With 215 core tools plus 1,000 Composio actions available, OpenHuman retrieves candidate tools rather than sending every schema, and can let Jev, a small decision model, pick among them (62.0% top-1 against BM25's 22.5%, reported). I covered Jev in Five Jev harnesses, for a model that cannot write.
- TokenJuice. Every tool result of 2,048 bytes or more is classified (JSON, diff, HTML, search hits, code, log, plain text) and compressed by a matching compressor before the model sees it. When the compression is lossy and the original is about 500 tokens or more, the original goes to a cache and the model gets a
⟦tj:<hash>⟧marker to fetch it with (gitbooks/features/token-compression.md). This one shows up again in the email demo.
None of this is exotic; Agent harnesses: engineering the loop around the model covers the general shape. What a harness controls is how many tokens go into each call, how many calls a task takes, and how long the harness itself takes between them.
Why one harness can be faster than another on the same model
Hold the model fixed and a task's wall time has three parts:
where is the number of model calls, is the time of call (prefill of the prompt, then generation), and is everything that is not a model call: process start-up, tool execution, the harness's own work between calls. Call 's prompt is
where is the fixed prefix (system prompt plus tool schemas, re-sent every call) and is the conversation so far, which grows with every tool result. A harness can be faster in three ways: fewer calls (), cheaper calls (smaller , or fewer generated tokens per call), or less time outside the model. With prompt caching, a large costs much less than its size suggests, because the identical prefix is a cache hit after the first call. That is why "smaller system prompt" by itself rarely explains a big speed gap. The harness effect makes the same point with a controlled swap.
So the question for OpenHuman is not "is its prompt smaller" (it is) but which of the three terms its lead comes from.
The vendor's benchmark
OpenHuman's own repository says, in docs/harness-comparison-2026-07-22.md, that "the only fully measured, reproducible numbers in this comparison are ours", and that the >1 GB OpenClaw figure "appears only in ZeroClaw's competitive marketing". That document compares OpenHuman's measurements against other projects' self-reported numbers. The better evidence lives in a separate repository, openhuman-benchmarks, which runs Claude Code, Codex, OpenCode, OpenClaw, Hermes Agent and OpenHuman on the same tasks behind a metering proxy. The proxy pins the model, the provider and the reasoning level on every request. It holds the only real API key, measures latency and tokens from the wire, and counts each harness's first-request prompt with the o200k_base tokenizer. Every task container is limited to 4 vCPUs and 8 GB. That is a better-controlled comparison than most I see.
The latest committed SWE-bench run is swe-x86-1: deepseek/deepseek-v4.1-flash at high reasoning, ten SWE-bench Verified instances, one attempt each. The rows that matter here (reported, from results/swe-x86-1/summary.md):
| metric | OpenHuman | OpenClaw | Hermes Agent |
|---|---|---|---|
| resolved | 7/10 | 9/10 | 10/10 |
| system prompt + tool schemas (tokens) | 944 + 3,647 = 4,591 | 5,656 + 1,990 = 7,646 | 4,457 + 8,789 = 13.2k |
| LLM calls, all tasks | 114 | 198 | 195 |
| task wall p50, own solved tasks | 19.8 s | 1m 02s | 58.5 s |
| cold start to first call p50 | 814 ms | 5.54 s | 10.0 s |
| CPU time per solved task | 1.31 s | 26.7 s | 16.1 s |
| peak RAM, process memory | 68 MB | 1.57 GB | 816 MB |
| avg RAM incl. page cache | 296 MB | 1.11 GB | 4.14 GB |
| cost per solved task | $0.0077 | $0.01 | $0.0082 |
| total cost, all tasks | $0.05 | $0.10 | $0.08 |
Read alone, that table backs the posts. Three things in the same repository weaken it.
Ten tasks, and the vendor says so. The summary's own footnote: "Small samples: treat differences as indicative, not a ranking." RESULTS.md is blunter: "Ten tasks is a smoke test: a one-task difference is noise."
The per-task KPIs are measured over each harness's own solved tasks. OpenHuman's p50 of 19.8 s is a median over the 7 tasks it solved. Hermes's 58.5 s is over all 10, including the hardest ones OpenHuman failed. That is not the same population.
The benchmark README carries a contamination warning that names swe-x86-1: task containers had open internet access, and several harnesses in the DeepSWE runs fetched the reference solution. The warning is mainly about DeepSWE, but it lists this run among the affected ones, so resolve rates here are upper bounds.
There is also an earlier run. The first report (RESULTS.md, 1-2 October, on deepseek-v4-flash at medium) has OpenHuman slower: a wall p50 of 83.8 s against OpenClaw's 54.3 s and Hermes's 56.7 s. It resolved 5/10 against 7/10 and 8/10, with a cold start of 5.6 s. The vendor marks that setup as superseded, and its chart is the only one rendered in the repo:
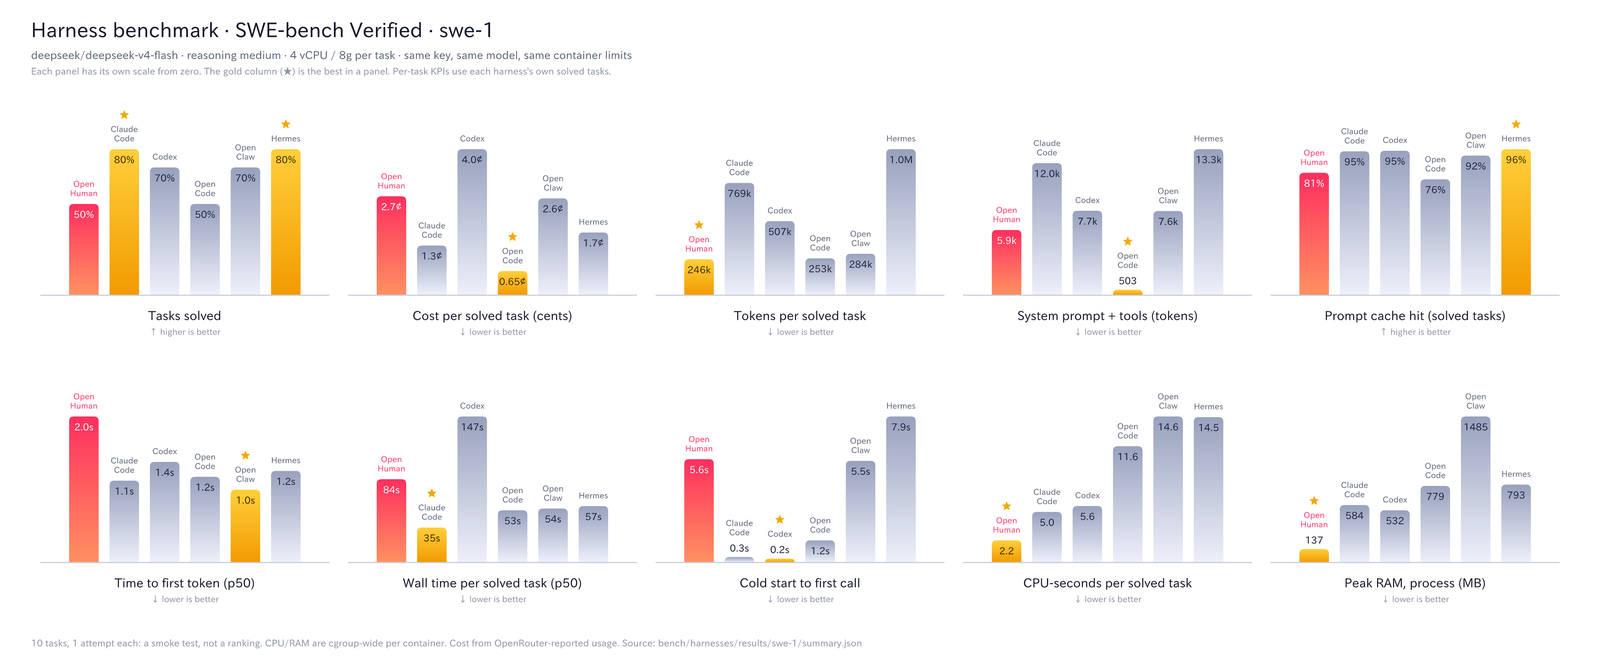
Between the two runs the model, the reasoning level, the provider pinning and OpenHuman's tool dispatcher all changed. "Faster" flipped sign within a week of the vendor's own data: it is a property of a configuration, not of the harness.
Where the seconds actually went
The run's raw records are committed: one JSON per task (result.json, with wall time and cgroup CPU and memory) and one line per model call in results/meter.jsonl (prompt, cached and completion tokens, request time). That allows a fairer cut than the summary's: the six tasks that OpenHuman, OpenClaw and Hermes all solved, the same six for each. Over those six (measured, my aggregation of the committed logs):
| per task, six common tasks | OpenHuman | OpenClaw | Hermes Agent |
|---|---|---|---|
| mean wall time | 36.1 s | 51.7 s | 60.5 s |
| time inside model calls | 34.6 s | 38.9 s | 39.2 s |
| time outside model calls | 1.4 s | 12.8 s | 21.2 s |
| model calls | 11.2 | 15.0 | 18.8 |
| mean seconds per call | 3.09 | 2.59 | 2.09 |
| prompt tokens per call | 9,714 | 16,412 | 23,359 |
| prompt tokens per task | 108.5k | 246.2k | 439.9k |
| cache hit | 90.2% | 94.0% | 94.7% |
| completion tokens per task | 5,525 | 5,280 | 4,153 |
The time each harness spends waiting on the model is nearly the same: 34.6, 38.9 and 39.2 seconds. OpenHuman's lead is the other column. It spends 1.4 s per task outside the model; OpenClaw spends 12.8 s and Hermes 21.2 s. The cold-start figures account for much of that: 814 ms, 5.54 s and 10.0 s at p50 (reported). Part of Hermes's number is the rig itself. Its adapter, bundles/adapters/hermes.sh, copies the installer's whole Python and Node tree into a writable home before launching, and a comment there says "This copy is part of hermes's measured cold start."
The second source is call count: 11.2 calls against 15.0 and 18.8. Smaller prompts are a real but secondary effect. Each OpenHuman call carries 9,714 prompt tokens against 16,412 and 23,359, so prefill is cheaper, but over 90% of those tokens are cache hits in all three. And OpenHuman's individual calls are the slowest of the three, 3.09 s against 2.59 s and 2.09 s, because it generates more per call: 493 completion tokens per call against 352 and 221 (reasoned from the table).
The fixed prefix is about half of every harness's prompt bill: for OpenHuman, 47% for OpenClaw, 57% for Hermes (reasoned). A smaller matters, but it matters the same way for everyone. The widget below runs the model from the previous section on these measured inputs. It assumes the history grows by a constant number of tokens per call, fitted so that the mean matches the measured average, which makes it arithmetic on measurements rather than a measurement.
swe-x86-1); the totals at other call counts are arithmetic on them. Switch to same call count: OpenHuman's calls are the slowest of the three, so its lead on time shrinks to a few seconds at 15 calls and reverses past about 20.With each harness's own call count, the widget reproduces the table: OpenHuman about 36 s, OpenClaw about 52 s, Hermes about 60 s. Force all three to the same number of calls and the picture changes. At 15 calls OpenHuman's lead is about four seconds ( s against 51.7 s and 52.6 s, reasoned). Past about 20 calls it is the slowest of the three, because its per-call time is the highest. "Faster" here means starts quicker and stops sooner. Stopping sooner also has a cost: two of OpenHuman's three failures, both SymPy tasks, ended with an empty patch after 21.4 s and 25.9 s, where all six other harnesses in the run solved both, spending between 36 s and 299 s on them (measured, result.json and grade.json). A harness that gives up early has a short wall time.
On RAM and CPU there is no catch worth the name. 68 MB of peak process memory against 1.57 GB and 816 MB, and 1.31 CPU-seconds per solved task against 26.7 and 16.1, are differences of an order of magnitude (reported). They follow from the architecture: a Rust core against a Node daemon and a Python runtime. They matter when you run many agents on one box. The README's fleet sweep reports about 1.8 MiB of marginal memory per extra in-process agent (reported). One caveat: the page-cache column is closer, 296 MB average for OpenHuman against 236 MB for Codex, because the repository and the test run's files count too. "Lightweight" also describes the running process, not the code: 2,878 Rust files and 618,514 lines of Rust, with 825 crates in Cargo.lock (measured).
The email demo, frame by frame
The quoted post's video is 19 seconds long. A stopwatch in it runs past 1:08, so it is sped up roughly fourfold. It shows two windows side by side. The left is the Hermes Agent desktop app; OpenClaw does not appear, despite the "@openclaw KILLER" headline. The right is OpenHuman. Both get the same prompt, "can see my last 24 hours of email And summarize that? Use Composio GMAIL connection.", and both run deepseek-v4.1-flash (the Hermes picker shows medium reasoning; OpenHuman's shows no level).
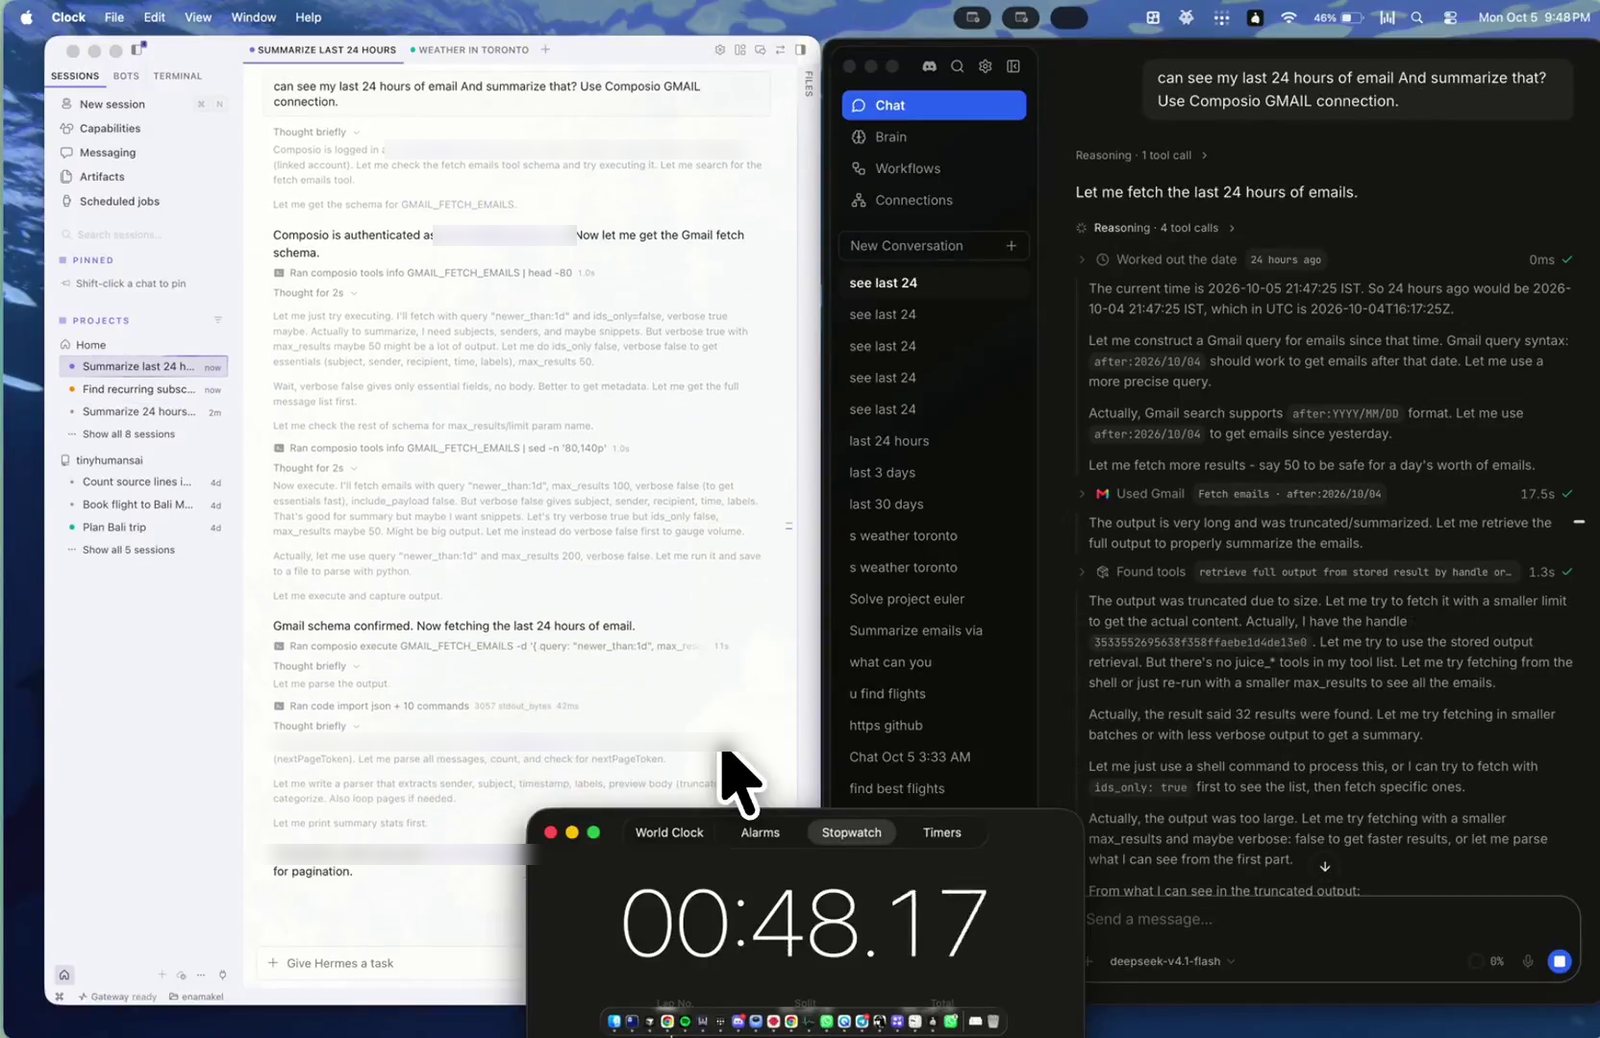
Three things are visible in the frames:
- The two agents did not fetch the same mail. OpenHuman queried Gmail with
after:2026/10/04, a calendar-date filter, and reported 32 results. Hermes usednewer_than:1dand parsed 20 messages. Same prompt, different inputs. - OpenHuman summarised a compressed view. TokenJuice cut the Gmail result, the agent looked for a way to fetch the original, found that the retrieval tool was not in its tool list, and wrote "From what I can see in the truncated output". Hermes wrote a Python parser over the full result set and paged through it. One of them did less work, and it was the faster one.
- The gap is small. OpenHuman's summary is complete on screen at the 1:03 mark. Hermes is still writing its summary at 1:08 and completes it within roughly the next ten seconds of stopwatch time. That is a gap of several seconds on a run of a little over a minute.
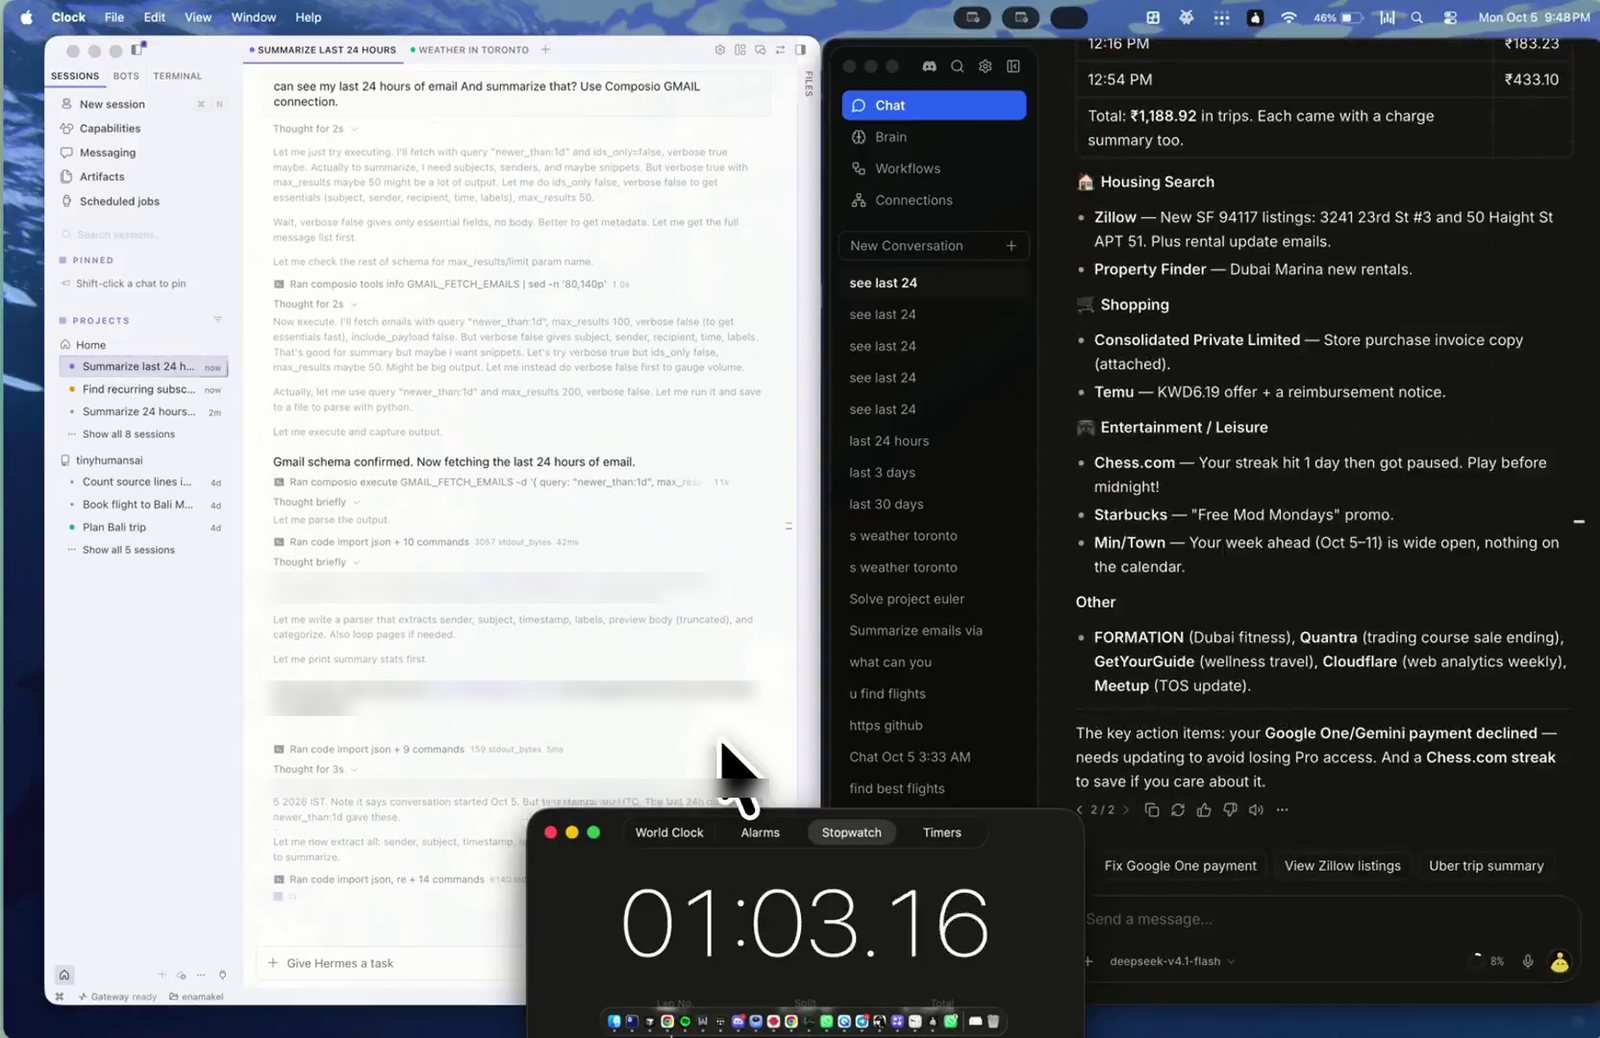
On provenance, I can only report what is visible. The OpenHuman sidebar lists five earlier sessions titled "see last 24". Under the post, the author's reply to "How did you measure the speed gap" is "same prompt at the same time and timed both, and the summaries were on par". I have no way to know who recorded the video. As a measurement, it is a single sped-up run, on inputs that differed, with one side working from a lossy view.
"Your context window live"
What the app shows is in app/src/features/conversations/aui/ContextUsage.tsx and crates/openhuman-core/src/agent/context_breakdown.rs. The composer has a ring that reads the thread's last-turn token usage against the model's window, falling back to an assumed 200,000 tokens. Behind it is a popover that splits the prompt into system, tools and history. The code is frank about the limits. The file's header says "The live per-round turn_cost socket event is not handled by the frontend yet, so the ring moves once per turn, not per round", which matches the video: 0% during the whole run, 8% after it. The system and tools slices are bytes divided by four (EST_BYTES_PER_TOKEN = 4, "a divisor, not a tokenizer"), and the breakdown is fetched only when you open the popover, because building it means rebuilding the agent.
It is a useful readout, and not unique. OpenHuman's own prompt_size.rs says it was "Modelled on Hermes' hermes prompt-size". Hermes's desktop app has a "Context meter" with a category breakdown (system prompt, tool definitions, skills, memory, MCP, conversation). OpenClaw's documentation describes "the chat composer's context ring popover", plus /usage cost and per-session estimated cost. All three harnesses in the comparison show you this.
The same prompt_size.rs contains a number the benchmark does not: the desktop orchestrator "renders ~37 KB of prompt text next to ~112 KB of advertised tool schema" (reported, a code comment). At four bytes per token, that is on the order of 37,000 tokens of fixed prefix (reasoned), against the 4,591 in the benchmark, which runs the core headless with Composio disabled. The email demo ran the desktop product with Composio enabled. I could not measure that configuration without running it, and the vendor's own life-scenario log reports a different figure, a "~21 KB system prompt". So the benchmark's prompt sizes describe a trimmed coding setup, not necessarily the app in the video.
"#1 trending on GitHub"
GitHub's trending page is a rolling window and keeps no history, so a past rank cannot be checked from GitHub itself. The README says "Within one week of launch, OpenHuman became the number one trending repository on GitHub for nine days in a row" (reported). What can be checked: the repository was created on 18 February 2026 and had 41,013 stars on 6 October, against 391,483 for OpenClaw and 251,542 for Hermes Agent (measured, GitHub API). Trending ranks growth, not size, so a younger and smaller repository can top it without being bigger. "That's because it beat OpenClaw and Hermes on efficiency" is a causal claim no data can support. Trending rankings come from star velocity, not from benchmarks.
What holds
| claim | verdict | evidence |
|---|---|---|
| uses less RAM and CPU | holds | 68 MB vs 1.57 GB / 816 MB peak process memory; 1.31 vs 26.7 / 16.1 CPU-s per solved task (reported, vendor's controlled rig) |
| delivers results much faster | half true | 36.1 vs 51.7 / 60.5 s on the six common tasks (measured), with the model time nearly equal; the lead comes from start-up and call count, reverses at equal call counts, and was the other way round in the first run |
| cheaper | holds, narrowly | $0.0077 vs $0.01 / $0.0082 per solved task (reported) |
| beat them on efficiency, overall | does not hold | 7/10 resolved against 9/10 and 10/10 in the same run (reported) |
| the email demo shows a wild gap | does not hold | several seconds on one sped-up run, different Gmail queries, one side summarising a truncated result |
| shows your context window live | half true | a per-turn ring with byte/4 estimates; Hermes and OpenClaw ship the equivalent |
| #1 trending | unverifiable | 41,013 stars, created 2026-02-18 (measured); rank history not kept by GitHub |
The lesson I take is about harness overhead. When three harnesses drive the same model, the time spent in model calls comes out within five seconds of each other. The differences are in how quickly the harness gets out of the way and how soon it decides it is done. OpenHuman is very good at the first. The second is a trade-off, and the posts reported only its upside.
If you are choosing a harness, clone openhuman-benchmarks, read meter.jsonl instead of the summary, and cut it to the tasks every harness solved. If you run many agents per machine, the memory result is the one worth acting on. Related: DeepSeek Harness, which refuses to send a request it cannot replay from its log, and Genex, ffmpeg-skill and rdsh, on where harnesses check the agent's work.