2026-07-18 · 10 min · agents · orchestration · pricing

Why read this
Solidtop 85%The effective-input-price equation and six harness mechanisms behind a vendor's 41% cost cut, with the small-sample and self-evaluation caveats spelled out.
- Widely used
- A lasting reference
- Concrete numbers to act on
Agents & harnessesAPI onlyProprietaryPractitioner paper
How this was scored
- Is it new?
- 1 of 3: An incremental tweak
- Can I trust it?
- 1 of 3: Spot-checks a few numbers
- Can I run it?
- 0 of 3: Closed, nothing to run
- Will I understand it?
- 2 of 3: Mechanism from first principles with figures
- Can I act on it?
- 2 of 3: A concrete recipe, numbers or comparison
- Will it last?
- 2 of 3: A reference for a year or more
- Does it affect many?
- 2 of 3: A widely used model, tool or lab release
- Only here?
- 1 of 3: Some original analysis
Score 48 of 100, ranked 485 of 577 rated articles. Each question is answered 0–3 by hand, and a 3 is rare. How articles are scored
The line I keep hearing is that per-token prices fall every quarter, so agent costs will sort themselves out. The invoices say otherwise. This paper — The Harness Effect from a Writer AI team (Muayad Sayed Ali et al., corresponding author Waseem AlShikh) — runs the clean experiment I wanted someone to run: hold the model fixed, change only the orchestration layer around it, and measure the bill. The result is that the orchestration layer — the harness — moves cost per task more than switching between the cheapest and most expensive model on the menu does.
One caveat up front, because it is load-bearing: the harness under test is Writer's own, and Writer ran the evaluation. I read the numbers as directional, not as a neutral benchmark. What makes it worth reading anyway is the mechanism — the paper formalizes why orchestration sets token economics, and the formalization is provider-agnostic.
Token maxing
The paper names the failure mode first. Token maxing is buying capability with tokens: longer reasoning traces, more agent turns, wider tool payloads, larger replayed contexts — so that tokens per task grow faster than task value. Falling per-token prices mask the pattern without fixing it. Total spend rises anyway.
The bill for one agentic task is a sum over its k turns:
where are the input/output prices per token and the tokens at turn . The input side is the part the orchestration layer builds:
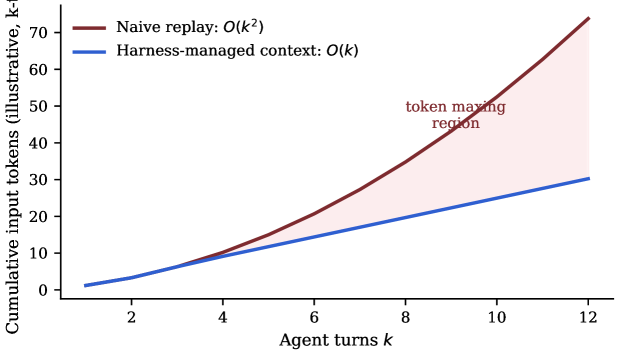
Here is the trap. If every turn replays the full transcript, the history term grows with , so the cumulative input over a task grows as . A harness that compacts and caches history keeps it near . The gap between those two curves is spend that buys no quality — and because the per-token price is falling the whole time, the total keeps climbing quietly. Drag the horizon and watch it happen:
The bill, and the one price that actually moves
The lever the harness pulls hardest is prompt caching. Providers serve a previously seen prompt prefix from cache at roughly a tenth of the base input rate. If a fraction of input tokens are cache reads billed at multiplier , the effective input price is
so a harness that keeps near 1 pays about a tenth of list price on the dominant input term. The point the paper makes well: is not a model property and not a provider favor. It is a function of how byte-stable your prompt prefix is across turns — which is set entirely by the orchestration layer. On an identical-prefix call the harness served 99.9% of prompt tokens as cache reads (7,876 of 7,886). That is the whole game: shape the prompt so the expensive term is almost always a cache hit.
The controlled swap
The experiment is deliberately boring, which is why it is convincing. Twenty-two locked evaluation tasks. Six foundation models — Claude Sonnet 4.6, Gemini 3.1, Gemini Flash 3.5, Qwen 3.6, GLM 5.1, Palmyra X6. Each model runs the tasks twice: once under a frozen conventional production loop, once under the Writer Agent Harness. Nothing else changes — same tasks, same judges, same price table. Only the orchestration layer swaps. Flip it:
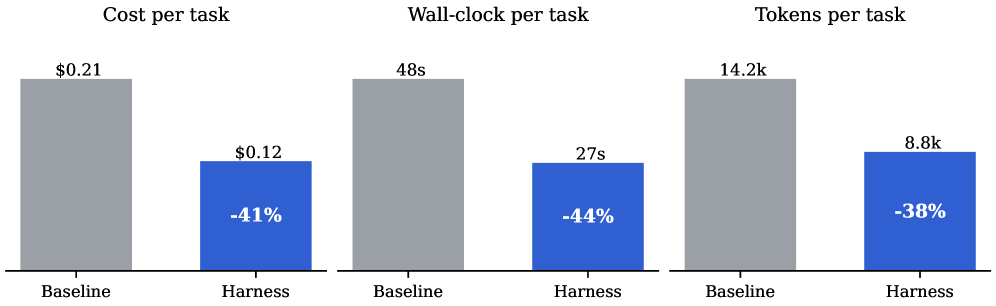
Blended across all six models and 22 tasks, replacing the loop with the harness cuts cost per
task 41% ($0.21 → $0.12), median wall-clock 44% (48s → 27s), and tokens per task 38%
(14.2k → 8.8k) — with task-completion quality at parity (0.78 → 0.81, directional at this
sample size).
Two derived numbers make the parity concrete. Quality per dollar rises 82%. And throughput — task-completions per million tokens — nearly doubles:
Everyone gets cheaper
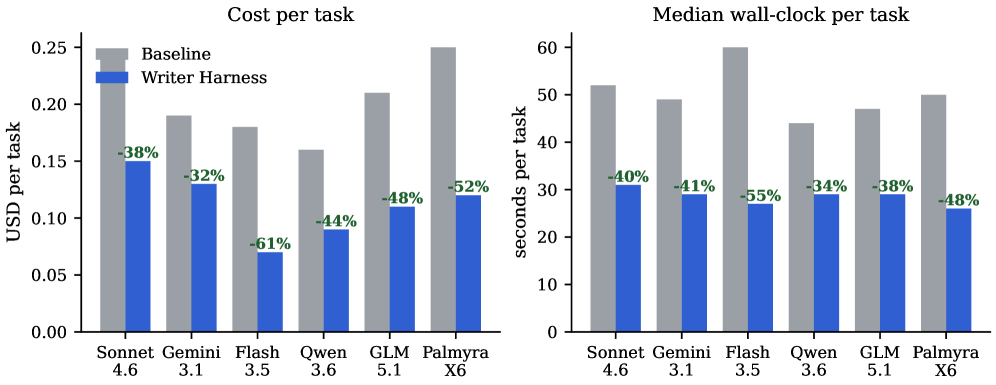
The efficiency win is not a quirk of one model. Under the swap, every model's cost and latency fall — cost by 33% to 61%, latency by 33% to 55%. The effect is a property of the orchestration layer, not of any model.
Harness leverage
Now the finding that made me want to write this up. Efficiency is model-invariant, but the quality gain from the same orchestration upgrade is not — it scales almost perfectly with a model's baseline strength. Plot each model's mean quality gain against its baseline capability and the points fall on a line: over . The paper calls it harness leverage. Stronger models extract more from the same harness. Scrub the models:
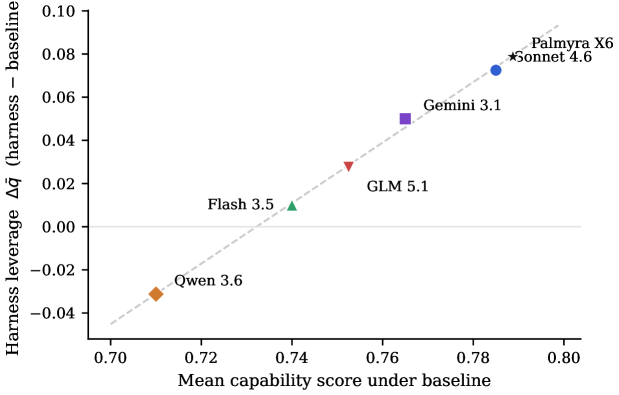
The honest edge of this: across 48 capability×model cells, 30 improve, 11 are flat, and 7 regress — all of them in the three smaller models, concentrated in orchestration-heavy capabilities (tool use over MCP, playbooks, presentations). Qwen 3.6 comes out net negative on quality (−0.031). It is still 44% cheaper. So the harness is a strict efficiency win everywhere, and a quality win that grows with the model you point it at.
Six mechanisms behind the effect
The paper decomposes the harness into six mechanism families. None of them is exotic — they are the unglamorous orchestration glue, which is exactly why they are easy to leave on the table:
- Cache-shape discipline — the two-zone prompt. A byte-stable prefix (tool-schema catalog, stable system prompt, append-only transcript) carries the provider's cache breakpoints; everything volatile is confined to a tail that is rebuilt each turn and structurally excluded from caching. This is what pushes toward 1 in the effective-price equation.
- Structured, incremental, cache-aware compaction. Shrink history without breaking the cache prefix — compact the middle, keep the front byte-identical.
- Context offload. Tool outputs land in a store the model can reference, not in the prompt. Tokens the model never pays to re-read.
- Zero-token waiting; durability as economics. Durable execution so a pause, retry, or long-running tool call does not replay the whole context to resume.
- Failure-spend governance. Cap what a failing or looping run can burn before it is stopped. Most runaway bills are failures, not successes.
- A model-agnostic floor. The five above set an efficiency floor under any model — which is what makes the savings a property of the layer, not the checkpoint.
How other harnesses compare
The paper also scores six widely used agent systems on the same axes — vendor-integrated clients, orchestration libraries, multi-agent conversation frameworks, and open personal harnesses — from public documentation rather than head-to-head runs. The pattern is that most frameworks implement some mechanisms and leave the rest "to the application to build and budget." Cache-shape discipline and failure-spend governance are the two most often missing, and they are two of the biggest levers. Treat that table as a design-time source study, not a measurement.
What it is worth at fleet scale
The reason this matters past a single task: the per-task delta multiplies by volume, and by every
model you run. Apply the blended cost gap to monthly task volume and at one million agent tasks
per month the harness is worth about $90k/month over the baseline — $1.08M/year — and the
gap widens linearly with volume. An organization does not run one model; it runs a fleet, present
and future. The harness is the one component whose efficiency multiplies across all of them.
The take
Strip the framing and the useful claim is narrow and testable: for agentic workloads, the orchestration layer is a first-class cost object, and most of the cost is in prompt shape, not model choice. The effective-input-price equation is the part I will actually use — it says the expensive input term is a cache hit if and only if your prompt prefix is byte-stable across turns, and that is an engineering property you control. Efficiency came out model-invariant (every model 33–61% cheaper); quality came out capability-dependent (r = 0.99 with baseline strength). I would want an independent harness and a second workload before trusting the exact percentages. But the direction matches what I see in production: the token bill is set less by which model you picked and more by how you assemble the context you hand it.
Source: "The Harness Effect: How Orchestration Design Sets the Token Economics of Enterprise Agentic AI" (Muayad Sayed Ali et al., Writer AI, 2026) — arXiv 2607.06906. Figures 1, 3, 4, and 6 are reproduced from the paper for commentary. Benchmark numbers are quoted as reported; the interactive diagrams illustrate the mechanisms and use the paper's headline values.