2026-10-06 · 18 min · explainer · agents · retrieval · information-retrieval · context-management · benchmarks · rust · open-source
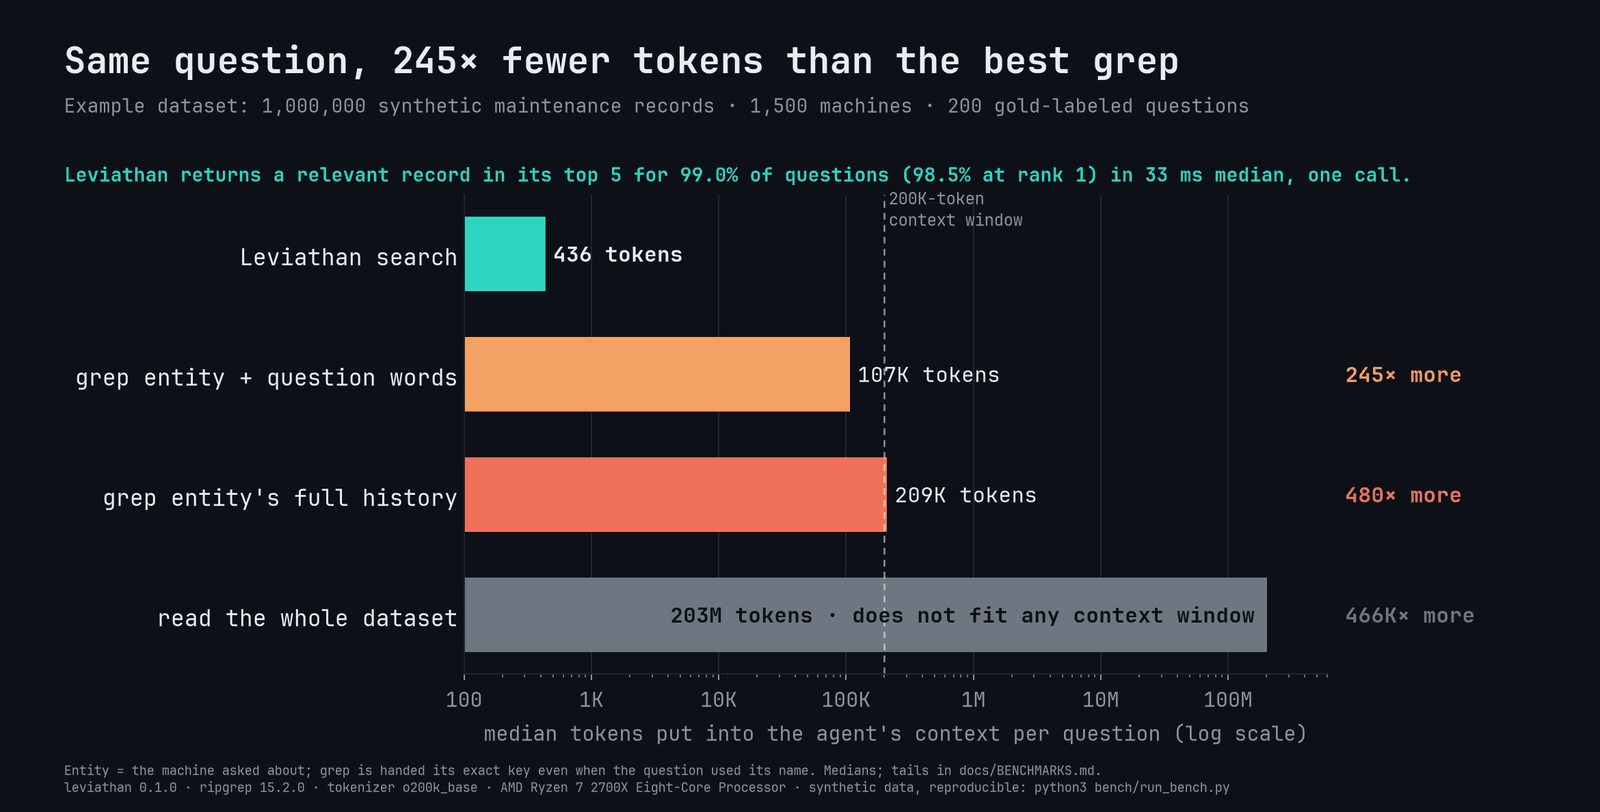
Joshua Baker's launch post reads: "I'm open sourcing Leviathan: an indexer that lets AI agents search a database of any size without reading it. At 1M records it hands your agent 436 tokens instead of 107,000, and it finds the answer 99% of the time." The thread adds that it is one Rust binary, that it returns "short, cited result cards. About 450 tokens per answer whether you have 10K rows or 1M", and, to its credit, that "Under ~100K rows grep is honestly fine."
- license
- Apache-2.0
- branch
- main
- tests
- 1 file
- source
- 254.4 kB
- commit date
- 2026-10-06
by size of tracked source at this commit, file counts in brackets; docs, data and vendored trees excluded
local clone, 2026-10-06 at 702ea92 — branch, commit, commitDate, fileCount, hasTests, languages, license, licenseFile, shallow, testFileCount
shallow clone: counts describe the pinned tree, not the history
I cloned elstongun/leviathan at commit 702ea92 (5 October 2026) and read all of it: 4,477 lines of Rust in src/, the 869-line generator in bench/synth, the Python harness and the per-question results file. There is no Rust toolchain on my machine and I do not build third-party code here, so I did not run it. Measured below means I computed it from a file in the repository, reported means it is the project's own figure, and reasoned means it is my arithmetic on the other two.
The short version:
- The engine is SQLite FTS5 with BM25, not a custom index. What is new is the packaging around it: an entity (a customer, a host, a machine) becomes one synthetic token, so "search inside this machine's history" is an intersection of two posting lists rather than a filter over every match.
- The answer is five cards, each a set of capped fields plus the one sentence of the record that best matches the question. The ~450 tokens is a consequence of five cards and a 300-character cap. Nothing in the code counts tokens (measured).
- The token numbers hold as a description of what the tool prints: 436 median and 602 worst case at 1M records, against 107,122 and 9,691,544 for the better grep baseline (reported). They would hold on almost any data, because they are set by the caps.
- The 99% top-5 figure is real for a benchmark built to be answerable. The data is synthetic, the 200 questions per scale come from 65 phrasings that share most of their words with the records they target, every question has at least 4 relevant records (median 89.5), and the ranking config boosts the very fields that define a relevant record (all measured).
- "Zero tokens until called" for the skill is nearly true. The MCP server's tool list costs 638 tokens per session (reported); the skill's description, which an agent harness keeps listed, is 72 words (measured).
Why grepping a big table does not fit
An agent with a shell answers "what fixed this machine last time?" the way a person at a terminal would: rg for the machine's id, read what comes back, maybe narrow by a keyword. That works while the output is small. The trouble is that output scales with the entity's history, not with the question.
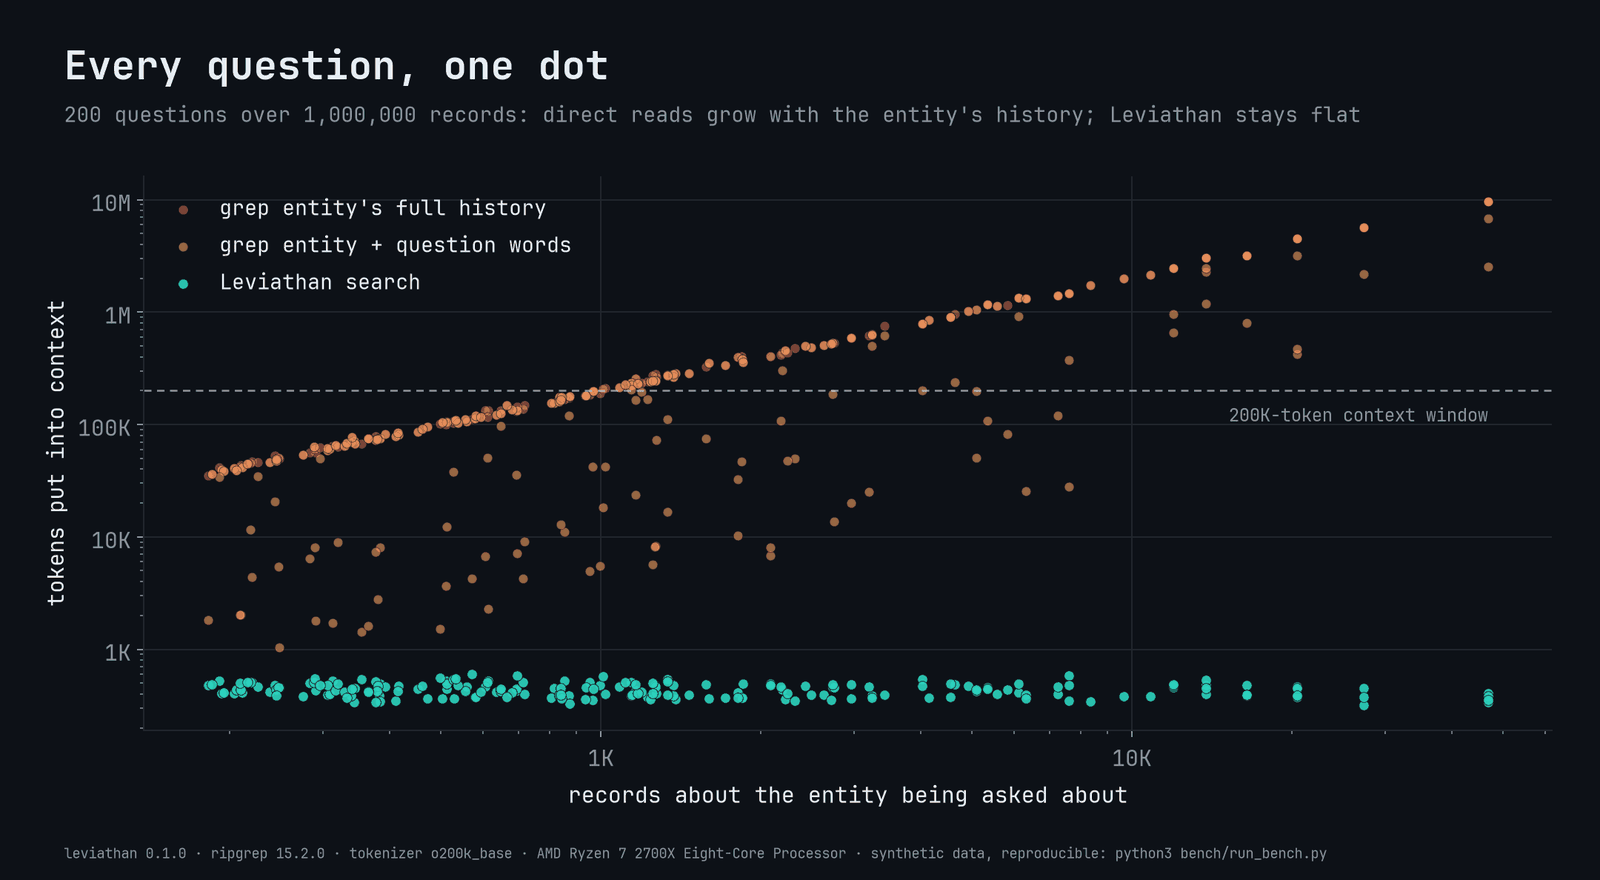
The benchmark makes this concrete. Its 1M-record file is 678 MB and 203,226,517 tokens (reported), about 203 tokens per record (reasoned). Across the 200 questions at that scale, the median machine has 1,015 records of history and the busiest has 46,850 (measured from results.json). rg for the busiest machine's id prints 9,691,544 tokens (reported). Even the median history, 209,412 tokens, does not fit a 200K-token window (reported), and half of all the histories do not.
There is a second wall before the context window. Coding-agent harnesses cap a tool's output; the benchmark uses 30,000 characters as "a common tool-output cap in coding agents". Past the cap the output is simply truncated, so a grep that technically contains the answer may not show it to the model. At 1M records the full-history grep holds a relevant record in its first 30,000 characters for 83.0% of questions (reported). I have written about the same pressure from the other side, where a cheap classifier does the reading for the agent, and about the loop that re-sends every tool result on every later turn, which is why a 100K-token read early in a session costs far more than 100K tokens.
The index: one SQLite file, four FTS5 columns
leviathan index streams records into a single SQLite database, built as <index>.building and renamed over the live file only on success. The schema in src/index.rs is short enough to quote. A records table keeps each record's id, group, date, a boost and the raw JSON for display. The full-text index is one virtual table:
-- src/index.rs, schema version 2
CREATE VIRTUAL TABLE record_fts USING fts5(
    title, body, names, tags,
    content = '', contentless_delete = 1,
    tokenize = 'porter unicode61'
);
INSERT INTO record_fts (record_fts, rank) VALUES ('rank', 'bm25(2.0, 1.0, 0.5, 0.0)');
Four columns, four weights. title is the record's headline field, weighted 2. body is every other searched string, weighted 1. names holds the group's key and name, weighted 0.5, and is only searched when no group is given. tags is weighted 0: it never contributes to a score, and that is the point. contentless means FTS5 stores the token postings but not the text, which lives once, in records.doc. The porter tokenizer stems English words, so "tripping" and "trips" meet at "trip".
The trick is in tags. Each record gets one token per group and one per filter value, a 64-bit FNV-1a hash written as text: g plus 16 hex digits for a machine, f plus 16 for a pair such as status = closed. A scoped search becomes a single FTS5 expression:
tags : "g<hash of CMP-B03>" AND {title body} : ("grinding" OR "noise" OR "gearbox")FTS5 evaluates that as an intersection of posting lists. A median machine's 1,015 records are found through the index, not by scoring all one million matches for "noise" and throwing most away. The code comment says it plainly: scoping and filtering "are posting-list intersections on synthetic tokens, so they cost less as they narrow."
BM25 in one paragraph
The score is BM25, which I have walked through term by term before. For a query and a record :
is how often the term appears in the record, with FTS5 multiplying each column's count by its weight. rewards rare terms, penalises long records, and and are fixed at 1.2 and 0.75 in FTS5 (reported, SQLite's FTS5 documentation). Two properties matter here. A word that appears in every record (the machine's own name, inside its own history) scores nearly nothing, which is why names is dropped from scoped searches. And a word has to appear to count at all: BM25 is lexical. The project's own limitations section puts it well: "A question that says 'weeping' where the records say 'leak' relies on its other words." For the alternative, see a grep whose pattern is a proposition.
From a question to a ranked list
src/query.rs runs the same steps every time:
- Resolve the group. Exact key, then case-insensitive key, then normalised name, then substring, then fuzzy (Sørensen-Dice similarity of at least 0.6). The first tier with any match wins; more than one candidate in it is reported as ambiguous with exit code 3. It never guesses.
- Parse the question. Lower-case word tokens, 54 stopwords removed, quoted phrases kept whole,
-wordexcluded. Words are ORed: any may match, and BM25 sorts out which matched best. - Rank. FTS5 returns the top 100 by BM25 (ten times the request, at least 100). Each score is multiplied by the record's boost, then re-sorted, newest first on ties.
- Fall back, loudly. If nothing in the group matches, the same query runs against every other group, and those cards are labelled
OTHER MACHINE. - Say how much there was. The header always reads
shown N of M, and an empty result says "none found, not none exist".
The boost is a config knob. In the benchmark's mapping, a record gets 1.15 if it has a real resolution, a step note, a part number or a labour note, plus 0.03 if it is closed. Placeholders such as "done" and "see notes" count as missing everywhere: they are not indexed, not shown and do not earn the boost. FTS5's bm25() returns negative numbers, best first, so multiplying by 1.18 makes a good record more negative and pushes it up.
The card, and where 450 tokens comes from
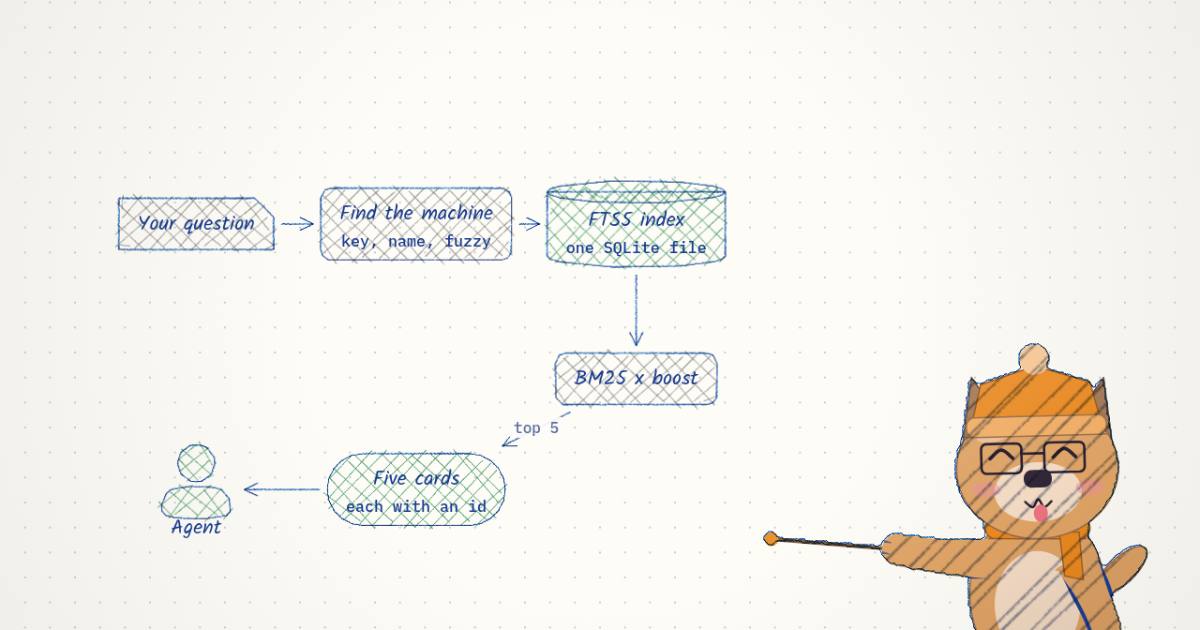
Ranking picks five records. The card decides what of each the agent reads. src/card.rs builds it from the mapping:
- Header: rank, id, date, relevance. The id is the citation, and
leviathan get <id>returns the full record. - Title: the headline field, on one line, cut at 240 characters or the cap, whichever is smaller.
- Display fields: each configured field, multiple values joined with
;, cut at--max-chars(default 300). Fields of 40 characters or fewer share one line. - Match: the searched text is split into sentences (only at
.!?;followed by a space, so4.2.1survives). Anything already on the card is skipped. The sentence matching the most distinct query words wins, compared on a crude prefix stem, and is cut to the cap around its first hit.
The builder below is that logic ported line for line, on one record assembled from the benchmark generator's own templates. Switch the question and the match: line changes; tick the placeholder box and the resolution disappears from both the card and the index.
[1] ML-1412087 · 2023-11-15 13:05 · rel (bm25 × boost)2nd shift: Grinding noise from gearbox on drive side. Root cause likely wear, recommend adding to service plankind: corrective · status: closed · parts.name: Pillow block bearing UCP207resolution: Gearbox oil low and milky; drained, flushed, refilled with ISO 220, scheduled oil analysissteps.text: Check oil level and condition; Vibration reading on bearingsmatch: Noise / vibration
With the first question, the card is 453 characters: the summary, a line of kind, status and the part, the resolution, the step list, and match: Noise / vibration, from the failure codes (measured, from the port). The same record as one JSONL line, as rg would print it, is 913 characters (measured). So a card is roughly half a raw record. The saving is not compression; it is selection: 5 records out of the machine's 1,015.
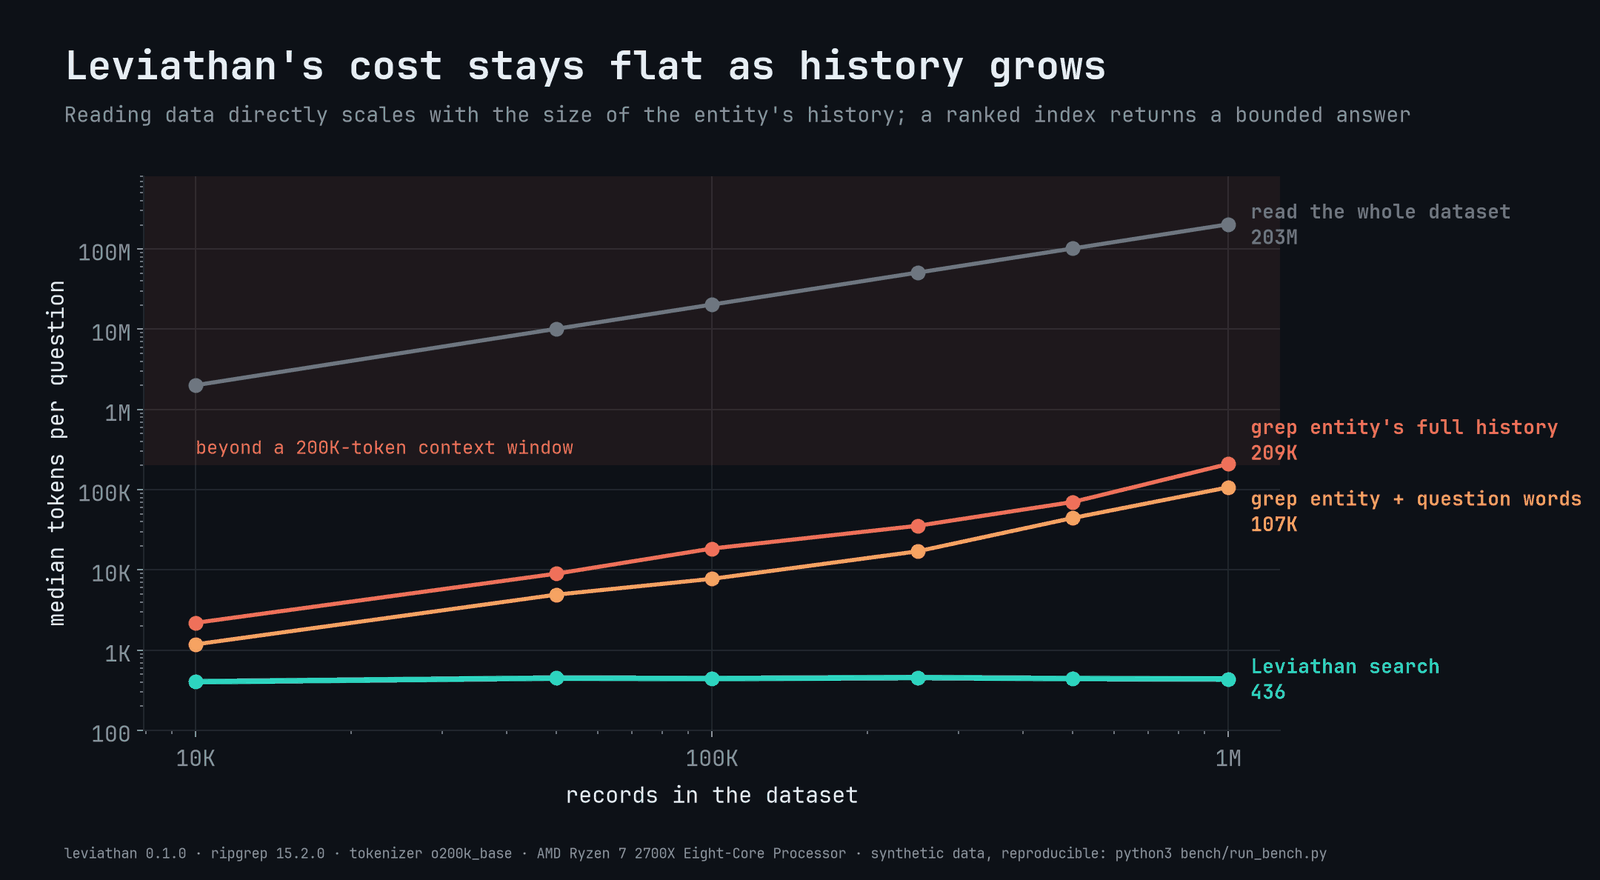
That also explains the flat line in the project's chart. An answer is at most -n cards, and each card is at most a header, a 240-character title, one capped line per display field and a capped snippet. With the benchmark's five display fields and the defaults, the ceiling is about 11,000 characters for five cards, roughly 2,800 tokens at four characters a token (reasoned). Real records are shorter than the caps, so the benchmark's median sits at 436 and its worst at 602 (reported). The answer does not grow with the dataset because nothing in it can. Raise -n to 50 (the maximum) or the cap to 600 and the "450 tokens" moves with you. That is a property you want, but it is a design choice, not a measurement.
Schema inference, and the CLI versus MCP
leviathan init profiles the first 2,000 records and writes a commented leviathan.toml. The rules in src/infer.rs are conservative and readable. An id is a short field present in 99% of sampled rows with every value distinct. A group has at most a quarter as many distinct values as rows and a name that looks like one (customer, host, …) or a sibling name field (customer.id beside customer.name). A filter has 2 to 50 distinct values averaging 40 characters or fewer. Free text is anything averaging 20 or more characters or 3 or more words. Other databases arrive through their own CLIs on standard input (psql … | leviathan index -), so Leviathan never holds credentials. The benchmark does not use the inferred mapping; it uses the hand-written examples/maintenance/leviathan.toml, which matters below.
On integration, the thread argues "MCP schemas tax every session whether you use them or not. A skill file costs zero tokens until it's called." The MCP server registers four read-only tools whose descriptions include a summary of the dataset, 638 tokens per session at 1M records (reported). The skill is a 3,550-byte SKILL.md. Agent harnesses that support skills keep each skill's name and description in context so the model knows it exists, and Leviathan's description is 72 words (measured). Not zero, but a fraction of the MCP cost, and the body loads only when used. This is the same trade I covered in how skills are packaged and found.
Does the benchmark support the claims?
The harness, bench/run_bench.py, is clean and honest about its baselines. For each question it runs leviathan search -g <machine as asked> "<question>" -n 5 and two ripgrep strategies, counts tokens with tiktoken o200k_base, and checks whether any returned id is in the gold set. The grep baselines are handed the exact machine key even when the question used a human name, an advantage a real agent would not have. The documentation lists its own limitations before anyone else can. The questions worth asking are about the data and the gold labels.
1M records · median · Leviathan hit@5 99.0% · click a column to read its values
The token claims stand on their own. They do not depend on the benchmark being hard: five capped cards are about 450 tokens on any data with records of this length. The comparison with grep is fair in the sense that matters: grep's output really does scale with history, and the tails (p90 of 1,415,519 tokens for grep plus words at 1M, reported) are where an agent falls over.
The accuracy claim is where the setup matters. Here is what bench/synth does, from the source:
- The questions come from a short list. The catalog has 27 failure modes, and each carries two to three "ask" phrasings, 65 in all (measured). A question is one of those, optionally prefixed with "again", "what fixed", "how did we fix" or "tech says". The generator's comment says the two vocabularies "overlap only partially, as they do in real logs". I matched each ask's content words against its own mode's symptoms, fixes, steps, codes and part names on a five-letter prefix: every one of the 65 shares at least one word, and 39 share all of them (measured). "grinding noise from gearbox" is asked about records whose summary reads
"Grinding noise from gearbox on {side}". That is not a criticism of the generator's honesty; it is the reason a lexical ranker does well on it. - Every question has many right answers. Questions are drawn from (machine, failure mode) pairs weighted by how many evidence records they have, so busy pairs dominate. At 1M records the fewest relevant records for any question is 4 and the median is 89.5 (measured). One reply to the launch thread asked for a benchmark with one relevant record per question; this one contains none.
- The search space is the machine, not the million. Every question names its machine, and all 200 at 1M resolved to the right one (measured). Ranking then happens inside a median of 1,015 records, of which a median of 11.7% are relevant (measured). Picking 5 records from the machine's history at random would put a relevant one in the top 5 about 40% of the time (reasoned, averaging over the 200 questions). Leviathan's 99% is far above that, so the ranking is doing real work; the question is how much of the remaining gap is the easy vocabulary.
- The boost knows the answer key. A record is relevant when it has "a real resolution, executed steps, parts or a technician note" (reported). The mapping's 0.15 boost goes to records with a real resolution, a step note, a part number or a labour note (measured,
examples/maintenance/leviathan.toml). The two lists are nearly the same. On real data you would write the same boost, because the useful records are the ones that say what was done, but it means the benchmark rewards a config written with the gold definition in view. - Accuracy rises with scale because questions get easier. hit@1 goes from 90.0% at 10K to 98.5% at 1M (reported). The project attributes this to more relevant records per question and better term statistics; the first is the larger effect by construction.
A detail in the per-question file is revealing. At 1M, the 25 questions with 10 or fewer relevant records all hit at rank 1, and both top-5 misses are questions with 26 and 106 relevant records (measured). Rarity is not what breaks it on this data. With 200 questions per scale, one question is half a percentage point, so 99.0% against 97.5% at 10K is three questions.
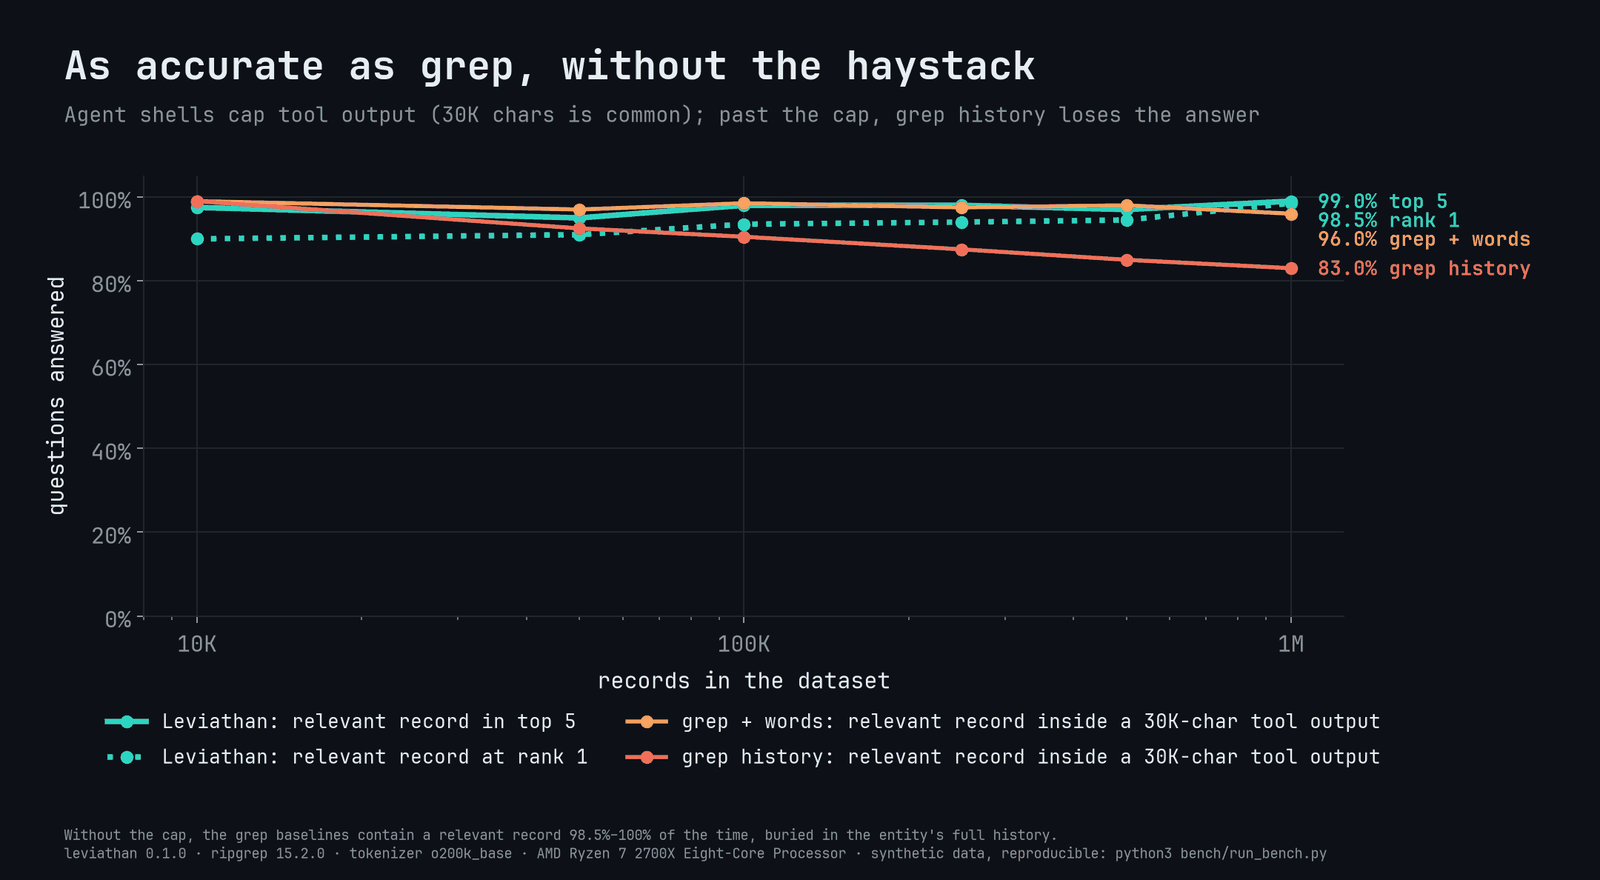
What the benchmark does not measure is also listed by the project: no model reads the output. hit@5 says a relevant card was on screen, not that an agent used it correctly. The latencies are one run on a 2018 Ryzen 7 2700X: 33.4 ms median for Leviathan at 1M against 88.9 ms for grep, and at 100K the two are level, 14.5 ms against 14.1 ms (reported). The index is about 1.8 times the source, 1.2 GB for the 678 MB file, built in 52 seconds on one thread (reported).
Where I would use it
The shape it is built for is common: tickets per customer, incidents per host, work orders per machine, where a question names an entity and asks about one kind of event in its history. For that, the design is sound: lexical ranking scoped by a posting-list intersection, honest output (shown N of M, labelled fallbacks, exit 3 on ambiguity rather than a guess), atomic rebuilds, upsert for daily changes, and one file to ship. The reply on the thread that said "you are just using FTS5 and BM25" is correct and beside the point. The useful part is that someone did the mapping, the group resolution and the card budget carefully, and wrote down where it breaks.
What I would want before trusting the 99% on my own data:
- My own questions. Write 50 from real tickets, phrased the way people actually ask, including the ones that share no words with the write-up. That is where BM25 loses and an embedding index (or a memory layer that rewrites what it stores) wins.
- Rare events. Questions with one relevant record, which this benchmark never asks.
- Questions without an entity. "Which machines had VFD faults after the March firmware update?" spans groups, and the project says datasets without a natural group "behave differently".
- An agent in the loop. Tokens saved only matter if the agent answers as well from five cards as from a grep it can page through. The project lists this as roadmap.
The thread's own advice is the right summary. Under about 100,000 rows, grep plus a keyword is fast and, at a median of 7,750 tokens (reported), usually affordable. Above that, history outgrows the window, and an index that hands over five ranked, capped, cited records is the cheaper thing to read. Just read the 99% as "on a synthetic log with friendly questions", and test the questions that matter to you.