2026-10-13 · 28 min · benchmarks · agents · agentic-coding · 3d · pricing
Why read this
Hightop 30%Rebuilds AA-3D's Bradley-Terry fit from its own data: three, not four, are tied at the top, the 0.92 leans on three weak models, and failed scenes cost nothing.
- Checked against the source
- Widely used
- A new technique
Evals & benchmarksRuns in a browserPractitioner dataset
How this was scored
- Is it new?
- 2 of 3: A real new idea, method or capability
- Can I trust it?
- 3 of 3: Reproduces the headline result, or shows from primary files it is wrong
- Can I run it?
- 1 of 3: API-only, gated or restrictive licence
- Will I understand it?
- 2 of 3: Mechanism from first principles with figures
- Can I act on it?
- 2 of 3: A concrete recipe, numbers or comparison
- Will it last?
- 1 of 3: Relevant for months
- Does it affect many?
- 2 of 3: A widely used model, tool or lab release
- Only here?
- 2 of 3: A teardown or measurement few others did
Score 68 of 100, ranked 143 of 513 rated articles. Each question is answered 0–3 by hand, and a 3 is rare. How articles are scored
For a year the way people compared models at 3D has been a screenshot thread. Someone asks for a pelican riding a bicycle, or a spinning black hole, or a playable pinball table, posts what three models made, and the replies argue about lighting. It is fun and it measures nothing, because nobody controls the prompt, the tools, the time or who is judging.
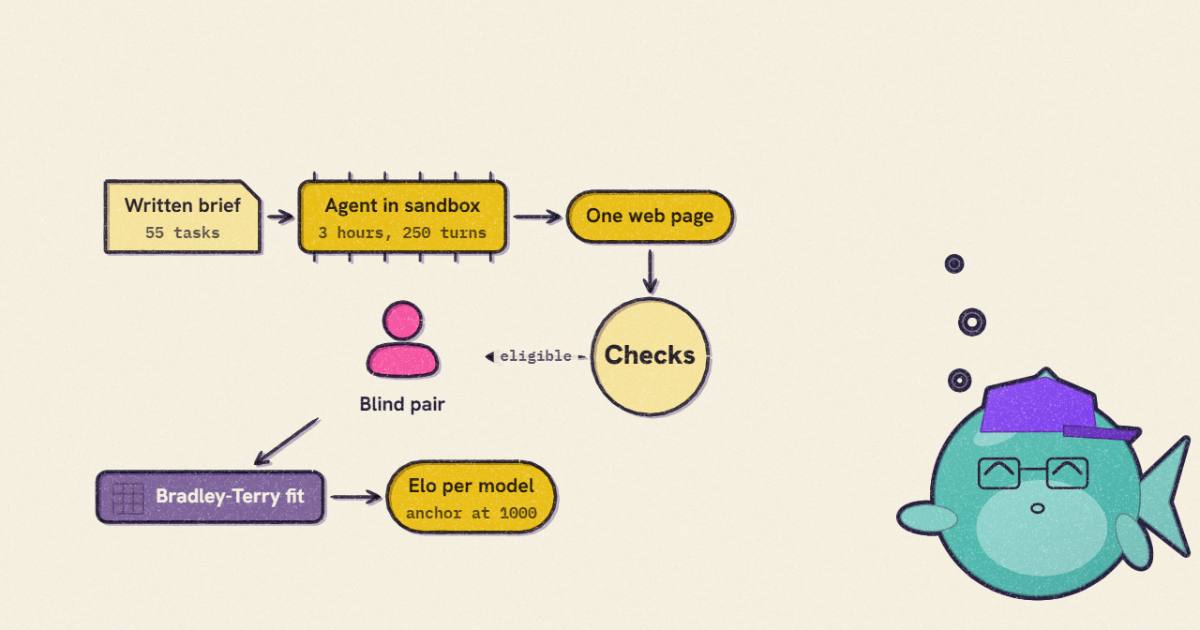
Yesterday Artificial Analysis turned that into a benchmark. AA-3D gives 21 models the same 55 written briefs, the same offline sandbox and the same three-hour clock, has each one build a three.js web page, and asks a recruited panel to pick between two scenes built from the same brief without knowing who made them. The votes become an Elo rating. Claude Sonnet 5.5 is first at 1194, and the post's first finding is that "four models are statistically tied at the top: Claude Sonnet 5.5 (1194), Claude Opus 5.5 (1190), GPT-6 Astra (1165), and Claude Fable 5.1 (1131)."
I wanted to know how much a leaderboard like this can actually tell apart. A human-preference arena is a statistics problem wearing a nice interface: everything rests on a Bradley-Terry fit and the intervals around it. AA publishes more than most arenas do. The methodology page names the estimator, the leaderboard embeds every model's rating, interval, win rate by domain, cost and tool use in the page, and the launch article lists every scene. That was enough to rebuild the fit and check the claims against AA's own numbers.
Most of it holds up, and the analysis around the leaderboard is better than the leaderboard. Three things don't hold up so well. The "four tied" sentence uses overlapping intervals as the test, which is the wrong one, and AA's own rank-range column disagrees with it. The correlation with general intelligence is real but leans on three very weak models. And a model that fails to produce a scene loses nothing for it.
What a model is asked to build
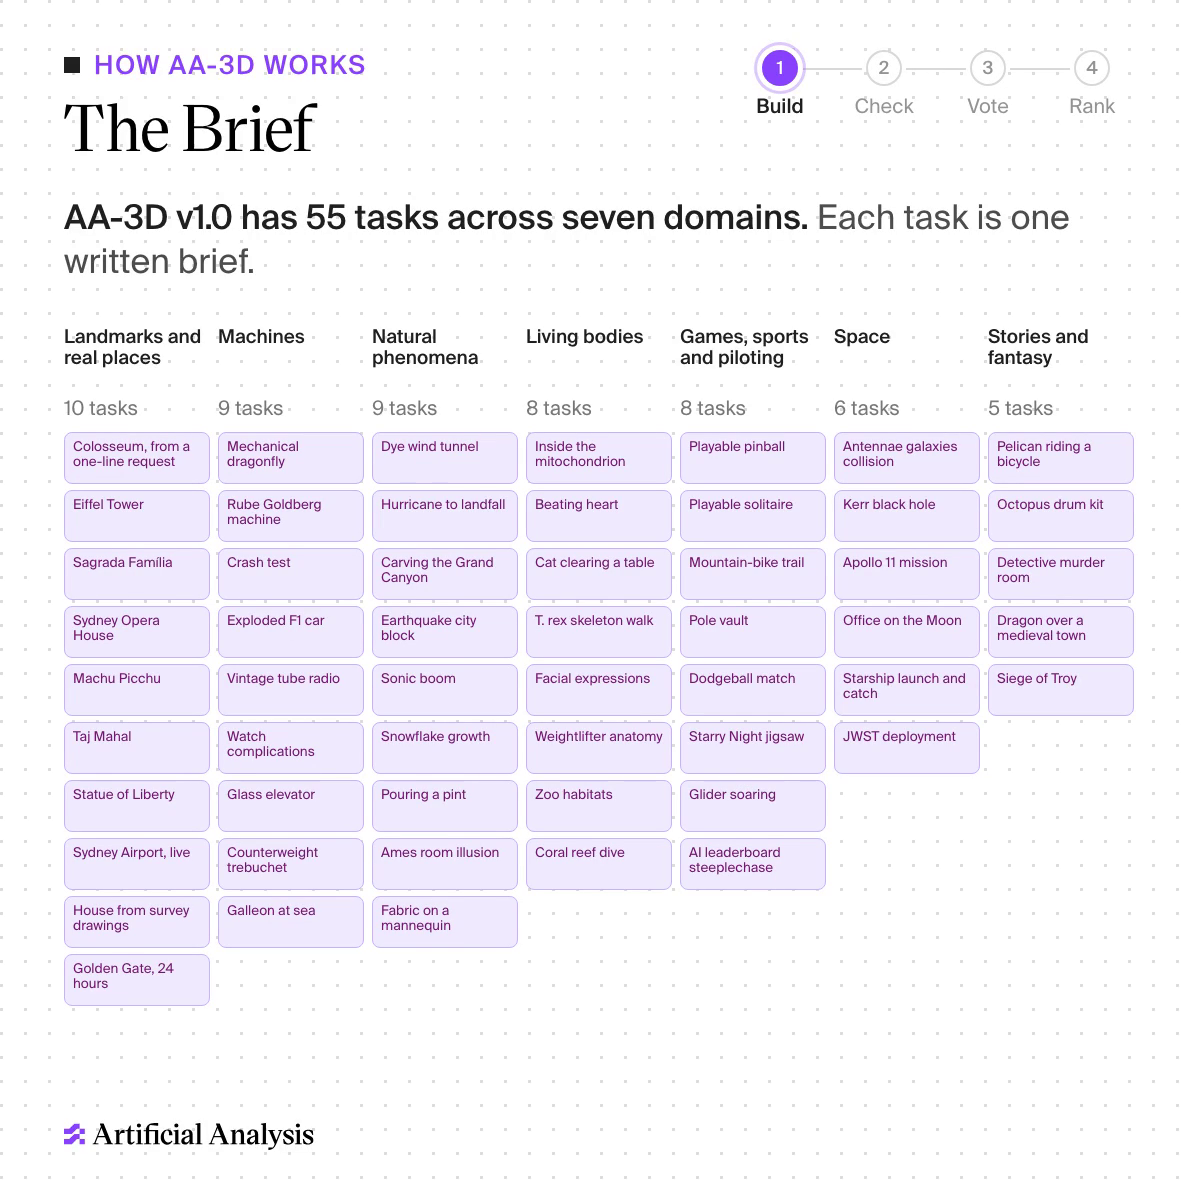
The task set is 55 briefs across seven domains: landmarks and real places (10), machines (9), natural phenomena (9), living bodies (8), games, sports and piloting (8), space (6), and stories and fantasy (5). The briefs are deliberately the kind of thing people ask for: the Colosseum "from a one-line request, as a typical user would ask for it", a counterweight trebuchet you load and fire at a castle, a beer pour with a developing foam head, a Kerr black hole with "the cinematic presence of Gargantua". Two are in-jokes. One asks for a steeplechase in which the runners are language models placed month by month from the Artificial Analysis leaderboard, another for an Artificial Analysis office on the Moon. And yes, the pelican is there.
A brief has a fixed shape: what the scene must show, how people should interact with it, and how it starts. The one AA shows in full is the T. rex: an "anatomically accurate, fully articulated T. rex skeleton walking through a three-dimensional scene", with foot contact, weight transfer and a counterbalancing tail coordinated "so the skeleton reads as a moving animal rather than independently oscillating bones", plus a pause, free inspection, a scrubbable walk cycle and an attack on another animal. It's a hard brief, and one a panelist can only judge by eye.
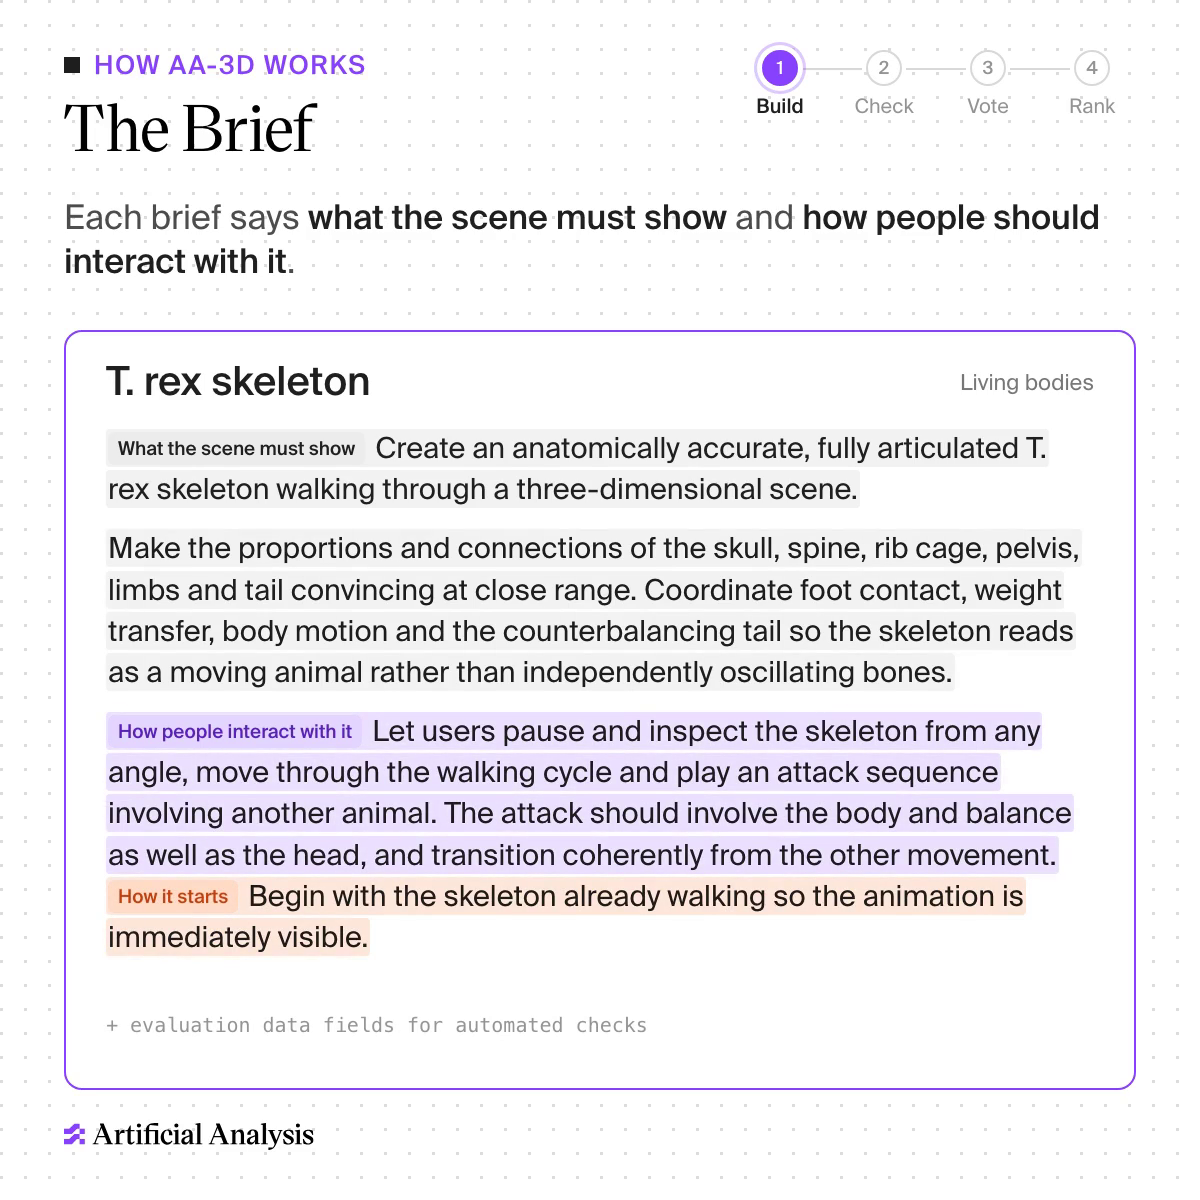
Only the one-line summaries of the other 54 are public, along with the scenes themselves. The shared "delivery contract" every task gets, the system prompt and those automated-check fields are not. So you can look at every result but you cannot rerun the benchmark, which matters for what "independent" can mean here. I come back to it at the end.
The sandbox, and the harness under it
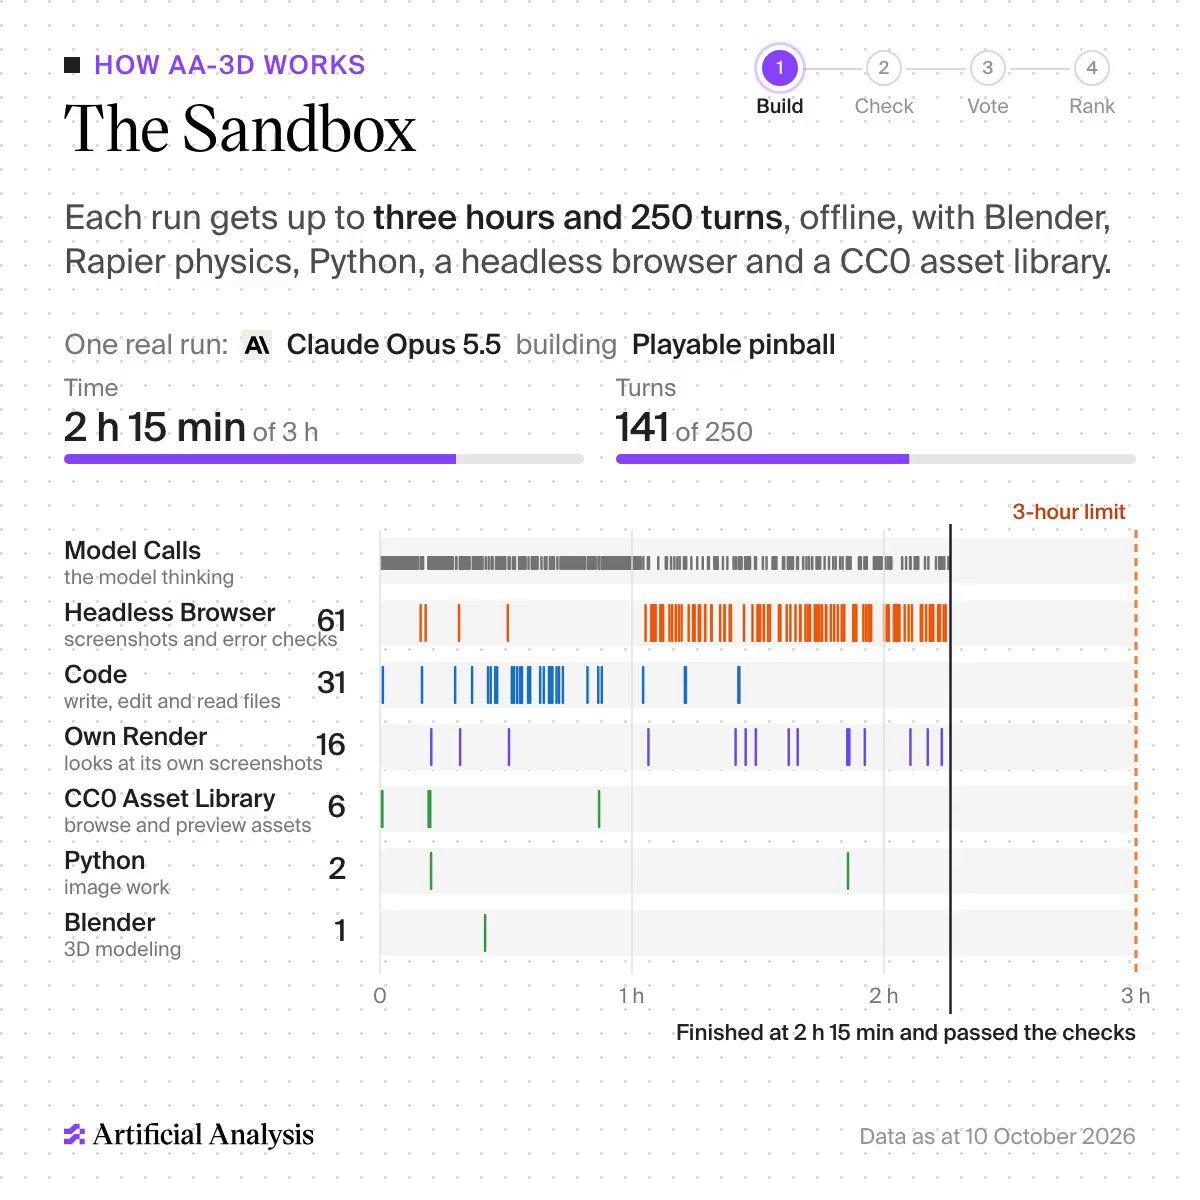
Each model runs as an agent in Stirrup, AA's open-source agent harness, one sandbox per task with no network. The methodology page lists the box: 4 CPU cores and 8 GB of memory, no GPU, WebGL rendered in software, three.js 0.186.0, Rapier 0.20.0 and Blender 4.5 (both optional), Python 3, Node.js 22 and a headless Chromium for self-testing. There is an optional CC0 library of lighting, materials, models, characters and animation clips from Poly Haven, ambientCG, Kenney, Quaternius and KayKit. Output is one HTML page with its assets, up to 200 MiB. One attempt per task, up to 250 turns, three hours.
I cloned Stirrup (commit 247f24d, MIT) to see what a "turn" is, since turn counts show up all over AA's analysis.
A turn is one assistant message, which can carry several tool calls; _get_turn_count in src/stirrup/core/agent.py
(lines 198 to 201) literally counts AssistantMessage objects. Three defaults in src/stirrup/constants.py shape
a long run like this one, if AA kept them. The context is summarised once it passes 70% of the window (CONTEXT_SUMMARIZATION_CUTOFF = 0.7, line 22). From 20 turns before the limit, the agent gets a "You have N turns remaining" message every turn
(line 23). And by default any image the agent looks at is shrunk to one megapixel before the model sees it (RESOLUTION_1MP,
line 26, applied in core/models.py line 162). That last one means the model is judging its own scene from a
downscaled screenshot rendered by a software rasteriser, while the panel sees it in a real browser on a real GPU.
The repository is the general harness. Nothing 3D-specific is in it: no brief, no delivery contract, no browser check. So I can say how the loop works and not what the agent was told.
AA's replays add the texture that a leaderboard hides. On one task GPT-6 Astra has a complete page after 6 minutes and finishes at 68; Claude Sonnet 5.5 shows nothing until minute 42 and works until 2 hours 58 minutes. Sonnet writes 6.2 times the output tokens of Astra on that run and costs 1.3 times as much, $14.93 against $11.62, because its list prices are a fifth of Astra's. Across the benchmark, browser tests take 82% of tool time: at 33 to 38 seconds each they fill about 25 of the 30.7 minutes of tool time per scene, while writing code is 6%. An agent that builds a three.js page spends most of its wall clock looking at it.
Who gets a vote: the eligibility gate
Before a scene can be voted on, a headless browser with software rendering gives it up to 60 seconds to load and draw, and it must keep rendering, show a non-blank image and run offline without errors. Then a person reviews it. Fail either step and the scene is out.
The methodology does not spell out what happens next. A scene that is out simply has no votes. Bradley-Terry only sees the comparisons that happened, so a model that fails a brief is rated on the briefs it passed. I counted the scenes in the launch article's explorer: 1,030 of the 1,155 possible (21 models times 55 briefs). GPT-6 Sol and Muse Spark 1.3 have all 55. Claude Sonnet 5.5, the leader, has 47; the eight missing are the Sydney airport, the tube radio, the watch complications, the mountain-bike trail, the pole vault, the glider, the James Webb telescope deployment and the pelican. Claude Opus 5.5 has 50, Nemotron 3 Ultra 36.
I can't tell from public data why those eight are missing. Some may have failed the check, some may have run out of time, and the explorer may not list every built scene (AA says GPT-6 Luna "builds all 55 scenes", and the explorer shows 54). AA's own detail analysis mentions 1,008 scenes plus 23 that break on the voting page, which is 1,031, so the counts are close but not identical. Either way the leaderboard answers "when it produces a working scene, how good is it?" and not "how often does it produce one?". Those are different questions for anyone who will use the model unattended, and a completion rate next to each Elo would answer the second.
The vote
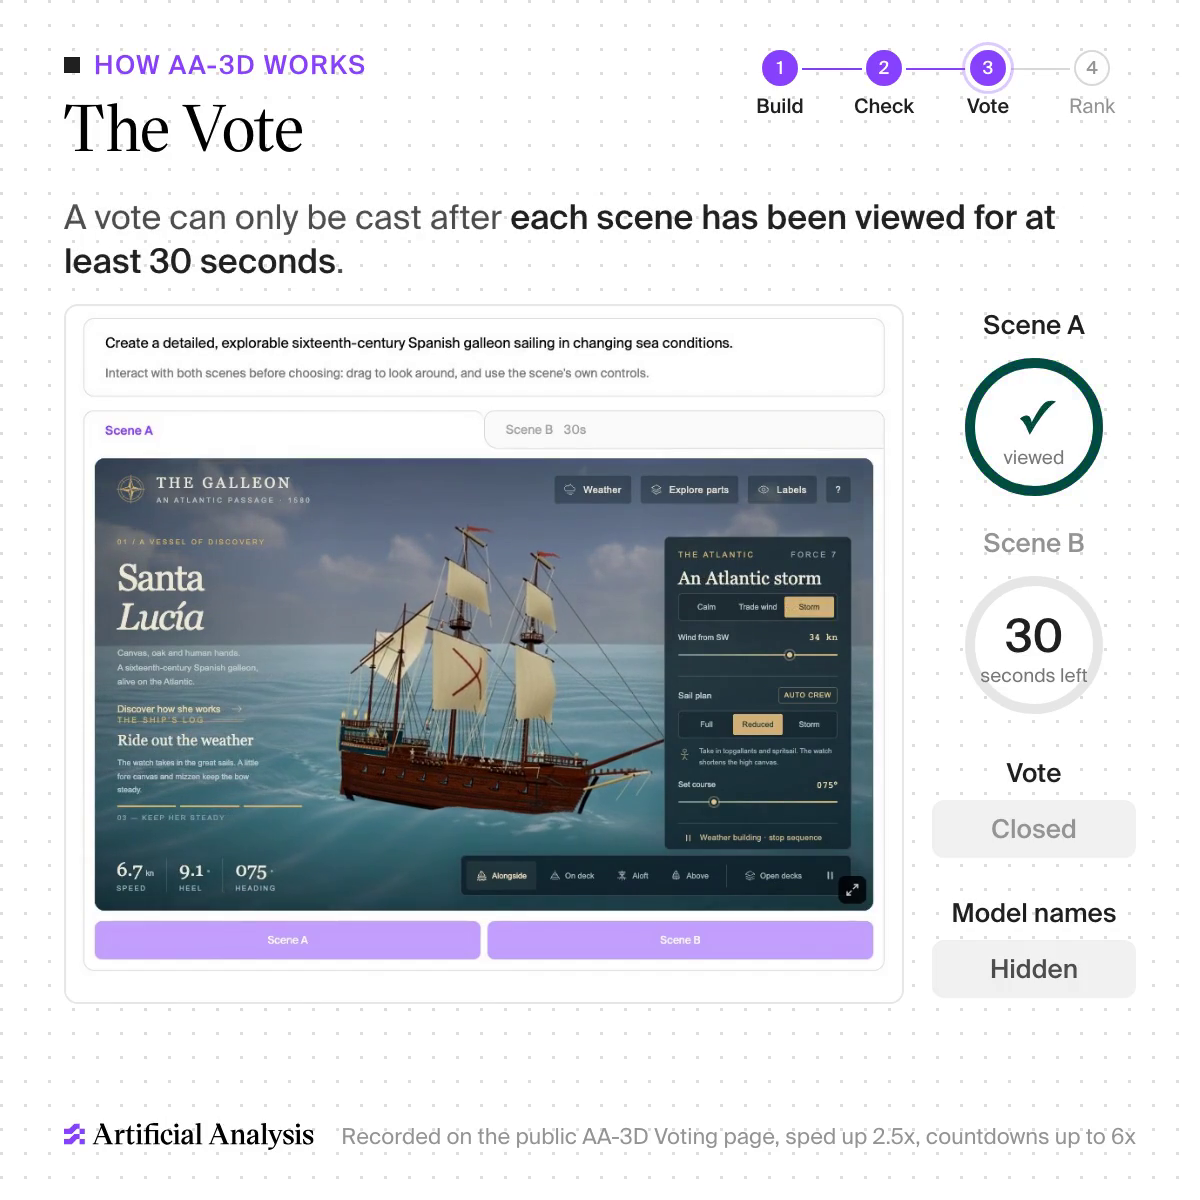
A panelist sees two scenes built from the same brief by two different models, interacts with both, and picks one. The vote unlocks only after each has been open for at least 30 seconds. Names are never shown, even after the vote. About one comparison in four has "a strong consensus answer" and works as a check; a session that fails those checks is thrown out with all its votes, and the check votes themselves are not counted. Public votes on the try-it-yourself page do not count either. The result is "over 10,000 counted votes from over 1,000 panelists", covering all 210 pairs of the 21 models.
This is a careful protocol. The 30-second floor and the hidden checks are exactly what an open arena lacks. But it is worth being clear about what a vote is: one person's preference after half a minute or so with each of two scenes. Thirty seconds is enough to see the lighting, the detail and how many controls there are. It is not enough to play a pinball game properly, check whether a weightlifter's organs are where they should be, or notice that a "Late Bronze Age" Troy has the wrong walls. I'll come back to what that does to the ranking.
From votes to a rating
Bradley-Terry is a short idea. Give each model a strength and say the chance that beats depends only on the difference:
Then pick the strengths that make the observed votes most likely. If is the number of times beat , the log-likelihood is , and maximising it is a small convex problem: Newton's method converges in a handful of steps. Only differences are identified, so one model is pinned. AA pins GPT-6 Luna at 1000, then rescales to Elo points, where 400 points is a factor of ten in the odds:
It is called Elo for familiarity, but nothing is updated vote by vote as in chess. The fit sees all the votes at once, so their order does not matter. AA's methodology says every vote is weighted equally here, and that its Image, Video and Music arenas use a different, power-law weighted fit.
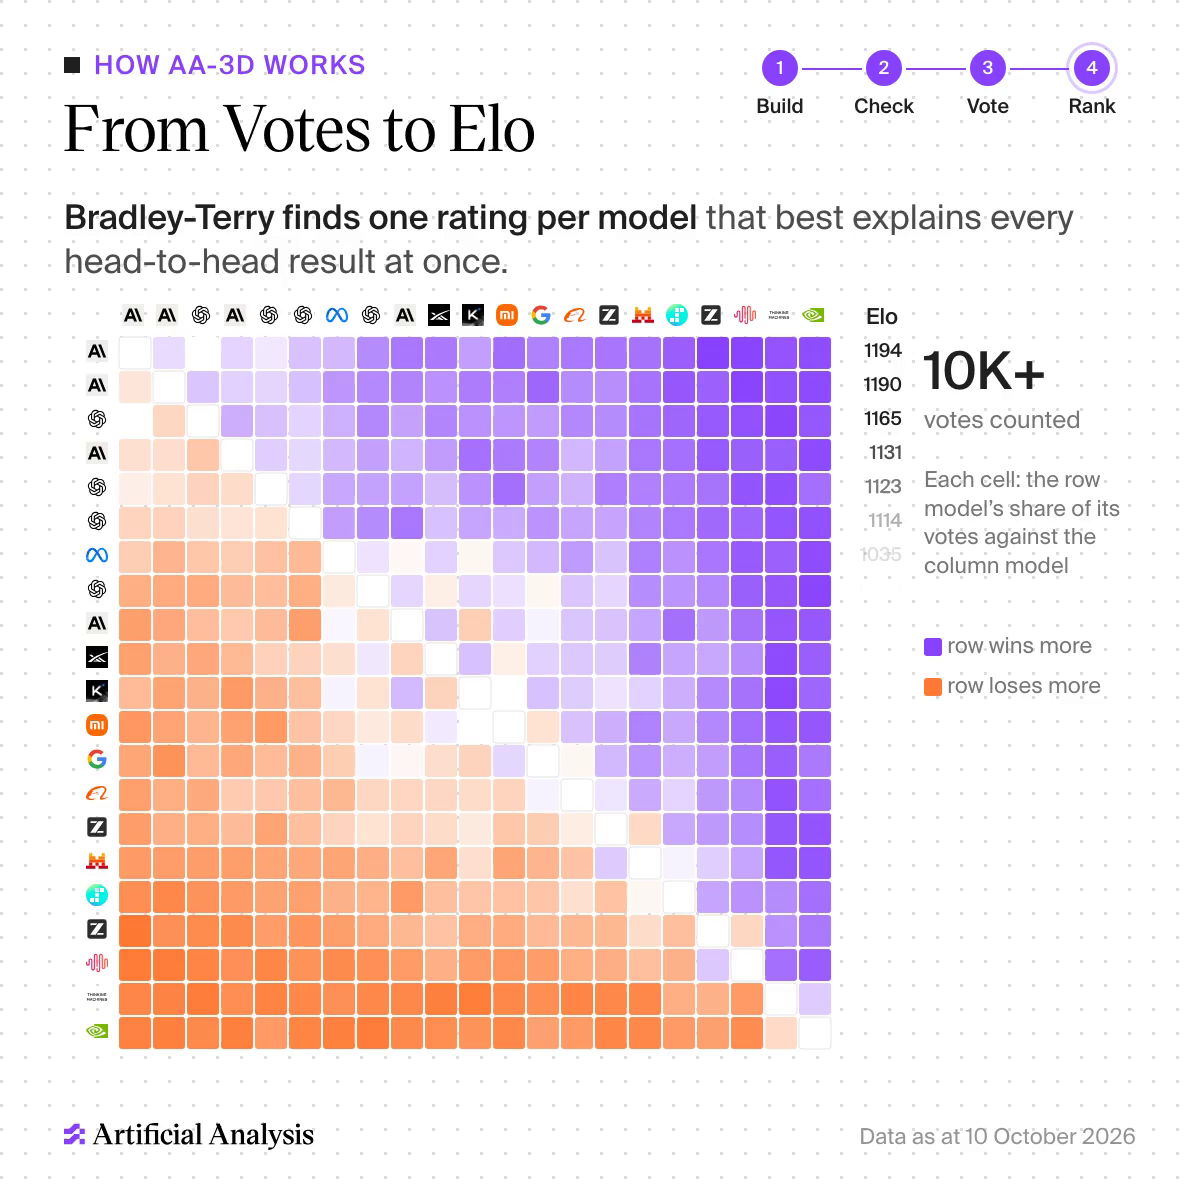
The anchor matters more than it looks. Luna's own row on the leaderboard shows no interval, because it is fixed. Every other "±" is therefore the uncertainty of that model's gap to Luna. Keep that in mind for the next section.
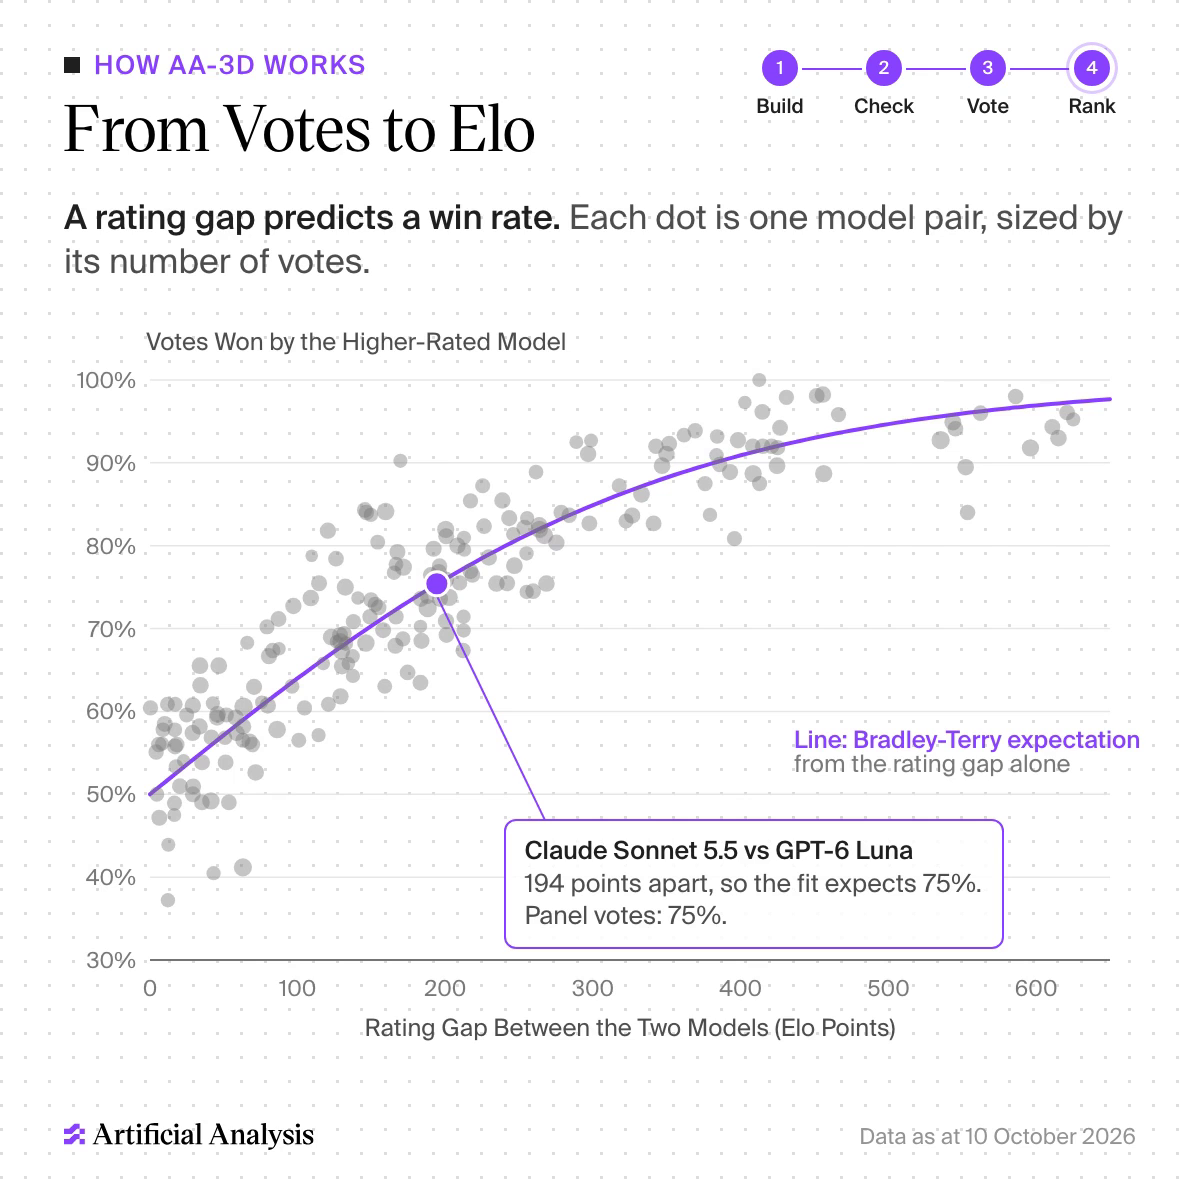
I checked the scale against the data. AA's leaderboard embeds each model's win rate in each domain. If the ratings are on the 400-point scale above and the panel paired models roughly evenly, a model's overall win rate should be its average expected score against the other twenty. For Sonnet that is 76.7%, and its domain win rates, weighted by scene count, average 76.5%. Inkling: 12.0% predicted, 12.0% observed. Across all 21 models the two never differ by more than two points. AA's own chart makes the same point pair by pair: Sonnet and Luna are 194 points apart, the fit expects 75%, and the panel gave Sonnet 75%.
What "statistically tied" should mean
AA charted the leaderboard with the claim drawn on.
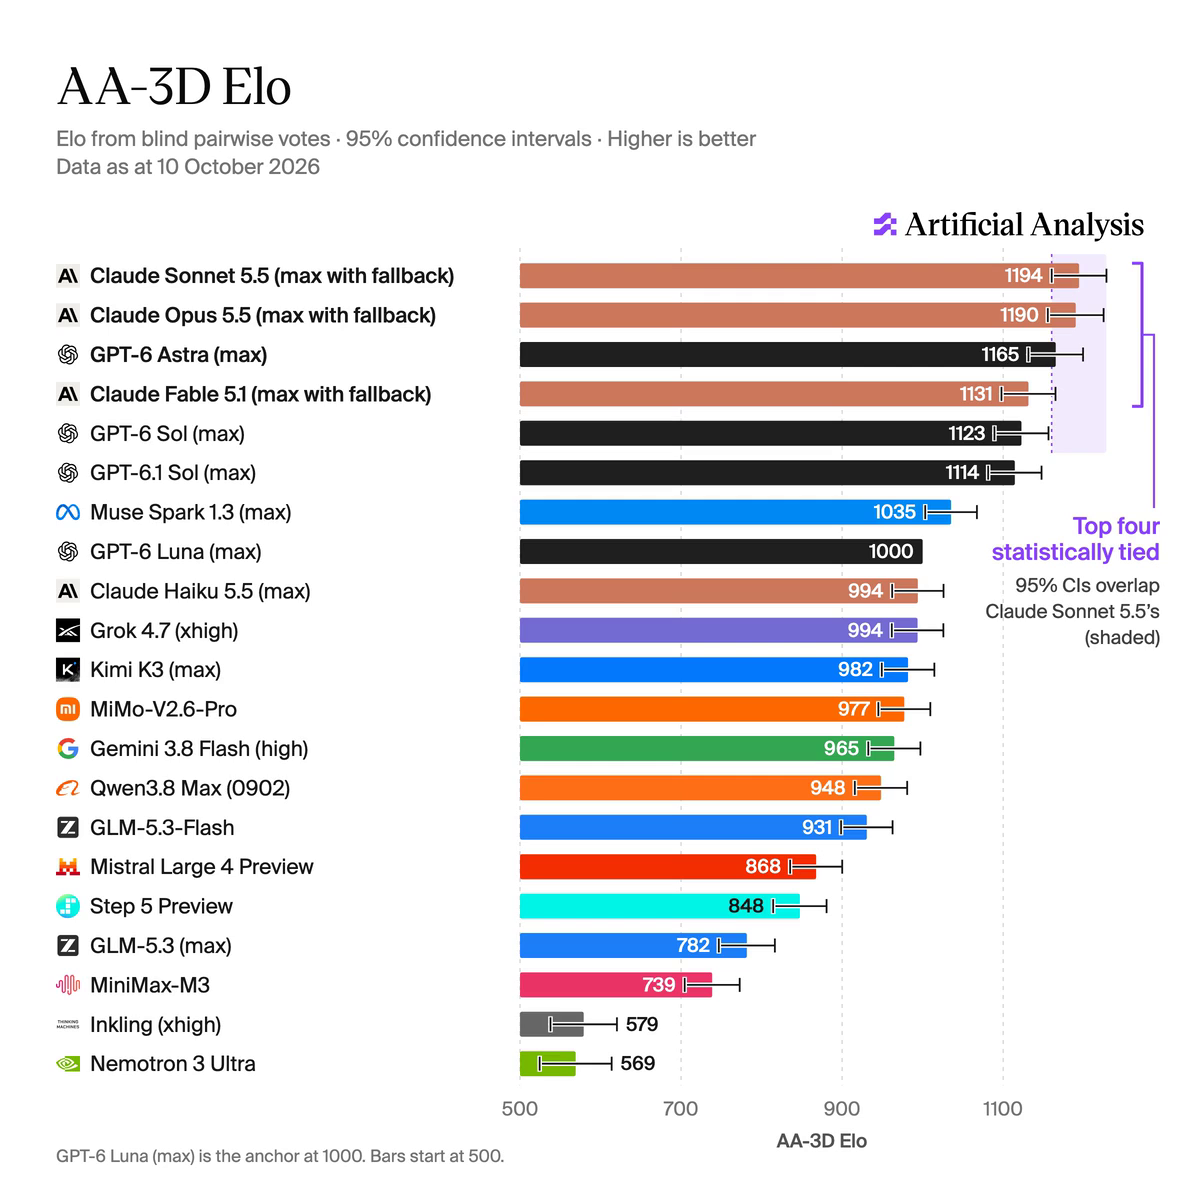
The published intervals are ±32 to ±45. I wanted to know whether they are what 10,000 votes should give, so I simulated it: take the published ratings as the truth, draw 10,000 votes between uniformly random pairs, fit Bradley-Terry anchored at Luna, and read the intervals off the inverse Hessian. Over 20 draws a model's interval comes out at about ±36, and the bottom two widen to the mid-40s because their votes are lopsided and carry less information. AA publishes ±34 at the top and ±41 and ±45 for Inkling and Nemotron. The intervals are honest.
The test is the problem. Two 95% intervals that overlap do not mean two models are indistinguishable. What decides it is the interval of the difference, and when both ratings are measured against the same anchor, they share Luna's uncertainty. The covariance subtracts out, and the interval on a gap ends up about the size of a single model's interval rather than 1.4 times it. In my simulations it is about ±37 for every top pair. Against that:
- Sonnet minus Opus is 4 points. Tied, and nowhere near separable.
- Sonnet minus Astra is 29. Tied.
- Astra minus Fable is 34. Tied, just.
- Sonnet minus Fable is 63, and Opus minus Fable 59. Separated.
So at this vote count the top is three models, with Fable fourth and level with Astra, GPT-6 Sol and GPT-6.1 Sol. AA's own leaderboard says the same thing in a column the launch post does not use. Its "Range", described as "the range of plausible rankings based on this model's Elo confidence interval", gives Sonnet and Opus 1 to 3, Astra 1 to 4, and Fable 4 to 6. A model whose plausible ranks start at 4 is not tied for first.
None of this changes who is good. It is a narrower point about the sentence everyone will quote: "four statistically tied" is true only under a test that is too lenient, and the table one click away shows it.
The widget below runs the same fit in your browser. It starts with 10,000 simulated votes drawn from the published ratings. Add votes and watch the intervals shrink by the square root; start from zero and watch them open up; cast a run of upsets by hand and see how little one model's rating moves when everything else is pinned by thousands of other votes. The bottom panel tests the pairs that matter with the difference interval.
Two things to try. First, switch pairing to "near neighbours" and add 10,000 votes. Pairing each model with models rated close to it tightens the intervals on the gaps at the top, where the question is, while the intervals against the distant anchor get wider. AA does not say how it pairs; its matrix covers all 210 pairs, which suggests something close to uniform. Second, try separating Sonnet from Opus. A 4-point gap needs an interval of ±4, and with only direct comparisons near even odds that takes about votes between those two models alone. With 10,000 votes spread over 210 pairs, each pair gets about 48. The order of the top two is not something this panel can settle, and AA does not claim it can.
Is it just intelligence again?
The second finding is that AA-3D tracks AA's general Intelligence Index closely: "each point on the Artificial Analysis Intelligence Index is worth about 18 Elo (Pearson 0.92)", a tighter fit than Terminal-Bench 4.0 (0.81) or SciCode (0.76). If that were the whole story, a 3D benchmark would be an expensive way to re-measure intelligence.
The leaderboard page carries each model's Index, Terminal-Bench 4.0 and SciCode scores, so I refitted it. With all 21 models the slope is 17.9 Elo per Index point and Pearson's r is 0.923. Terminal-Bench gives 0.81 and SciCode 0.76, exactly as stated. The residuals match too: GPT-6 Luna sits 141 above the line, GPT-6 Sol 93, GPT-6 Astra 46, and GLM-5.3 197 below.
Then I dropped the three models with an Index under 30: MiniMax-M3, Inkling and Nemotron 3 Ultra, the three weakest on both axes. The Index correlation falls to 0.79. Terminal-Bench falls to 0.63 and SciCode to 0.41. The ordering survives, so the Index still tracks AA-3D better than either single benchmark, but a good share of the "0.92" comes from three points at the bottom-left corner, which any two capability measures would agree on. Among the 18 models a person would actually choose between, the Index explains about two-thirds of the variance in AA-3D Elo, against the 85% that a 0.92 implies.
It is also less surprising than it sounds that an index beats any single benchmark. The Intelligence Index averages ten evaluations, Terminal-Bench and SciCode among them, so its noise is lower by construction. The interesting part is the residuals. The GPT-6 family builds better scenes than its Index predicts, by 46 to 141 points. GLM-5.3, which cannot view images and so never sees its own scene, falls 197 below; AA notes that its sibling GLM-5.3-Flash, which can, scores 149 higher with a lower Index. That residual looks like a fact about 3D, and about whether the agent can look at its work.
What thirty seconds of looking rewards
The best section of AA's launch article is the one where they take their own leaderboard apart, and it tells you what a preference panel is measuring.
Detail wins. The most detailed fifth of scenes in each task, by four screenshot measures, has screenshots twice as large (168 KB against 84 KB) and is a third as empty, and wins 63% of its votes against 31% for the least detailed fifth. Control count tracks Elo with a Pearson of 0.90: the top five show a median of 15 to 20 buttons and inputs, the bottom three 6 to 8. Models that look at their own render early rank higher (Spearman 0.82 across the 19 that can view images): the top five first look after a median of 10 to 13 turns. Reading files and docs goes the other way, with a Pearson of −0.74.
AA is careful about cause. Elo alone predicts 61% and 33% for those detail fifths, so most of the detail effect is "strong models build detailed scenes". Within one model, a scene one standard deviation more detailed wins only about 1.5 points more of its votes. Of 86 scene measures, 11 survive multiple-comparison correction, and none moves votes by more than 4 points.
I read that as good news and a warning. Good news, because the panel is not trivially fooled: a weak model cannot buy votes by cranking up the polygon count. The warning is what the measured things have in common. Detail, controls, visual polish and how soon the agent checked its own screenshot are what a person notices in half a minute. Nothing in the protocol checks whether the brief was met. The T. rex brief asks for anatomical accuracy and an attack sequence that "should involve the body and balance"; a panelist can reward the skeleton that looks most impressive without knowing whether its pelvis is right, or ever finding the attack button. Frame time does not separate anyone either: every model's median frame takes under 1.3 ms of GPU time on AA's test machine, far below the 16.7 ms a 60 fps frame allows, so nobody is losing votes to jank on that machine. Whether that holds on a phone, nobody measured.
We have seen this pattern on the site before. On Artificial Analysis's image arena, the Ming-Image-0.1-Design "#1 among open-weight models" claim held in 3 of the arena's 20 views, and in the category it was quoted for the same model was 16th of 129 once closed models went back in. Kimi K3 held first on WebDev Arena while sitting eighth on Text Arena, which says more about what each arena's voters reward than about the model. Preference Elo is real information about preference. It is a different quantity from "meets the spec", which is what rubric-graded evaluations such as AA's Harvey LAB-AA try to measure. Even AA's GDPval-AA, which grades office work, ranks by blind pairwise Elo; the Claude Haiku 5.5 piece plots it against cost.
The domain table is where to be most careful.
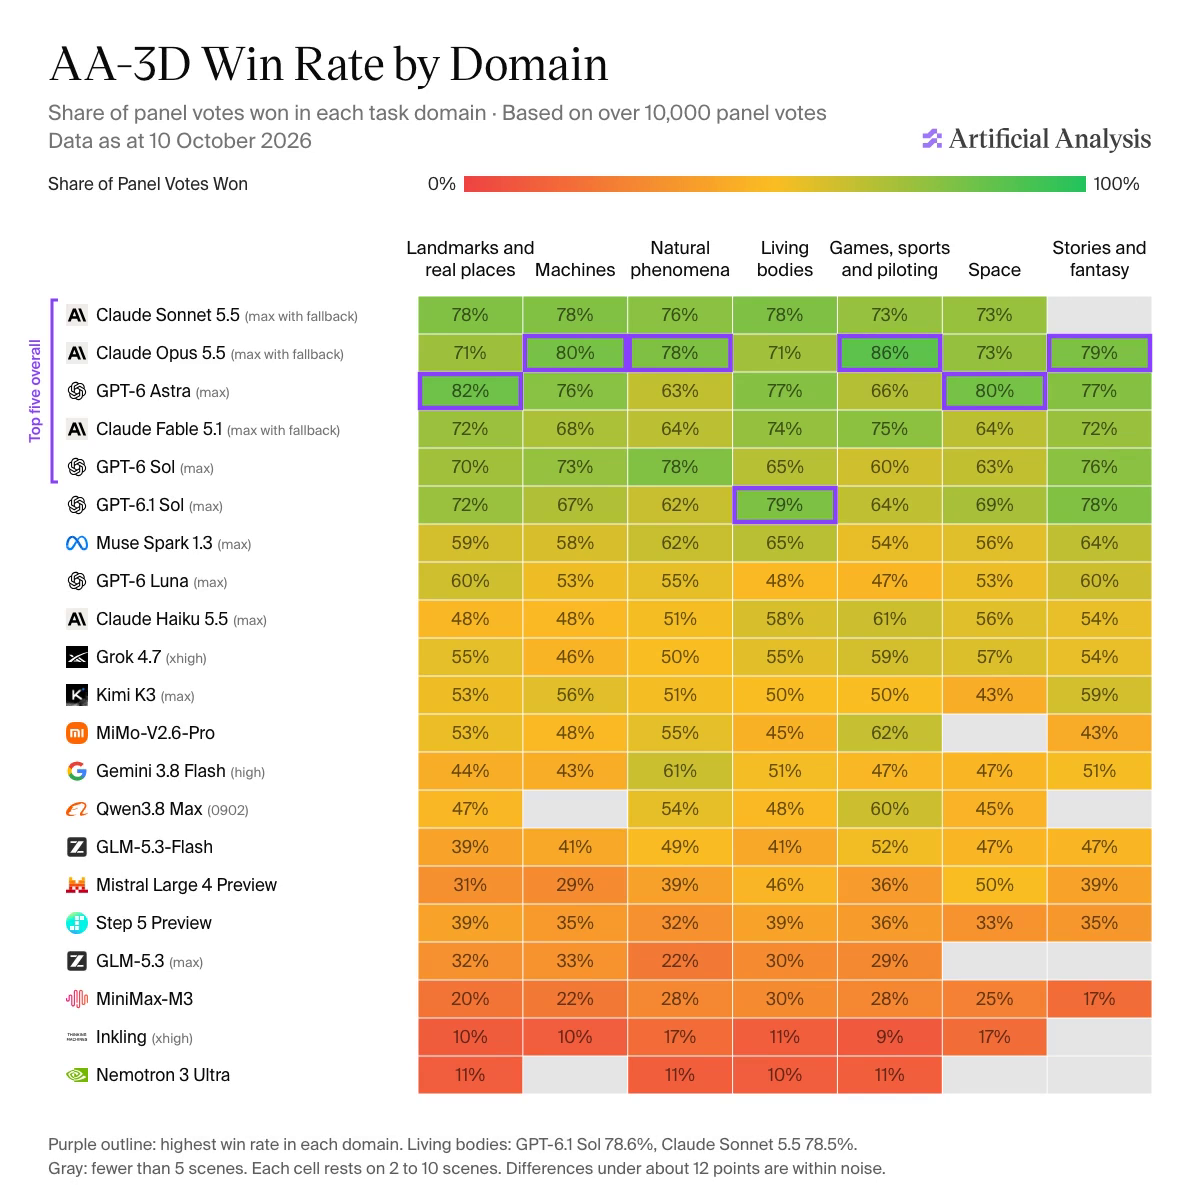
AA says a top-five model has the highest win rate in six of seven domains, and that in living bodies GPT-6.1 Sol (78.6%) ties Sonnet (78.5%). With seven or so scenes per cell and a 12-point noise floor, the honest reading is narrower: the top five are good everywhere, which AA also says, and no domain result says a model is a specialist. Sonnet's empty stories-and-fantasy cell is the eight-missing-scenes problem again: it has four scenes there, under the five-scene floor, because the pelican is one of the missing.
What a scene costs
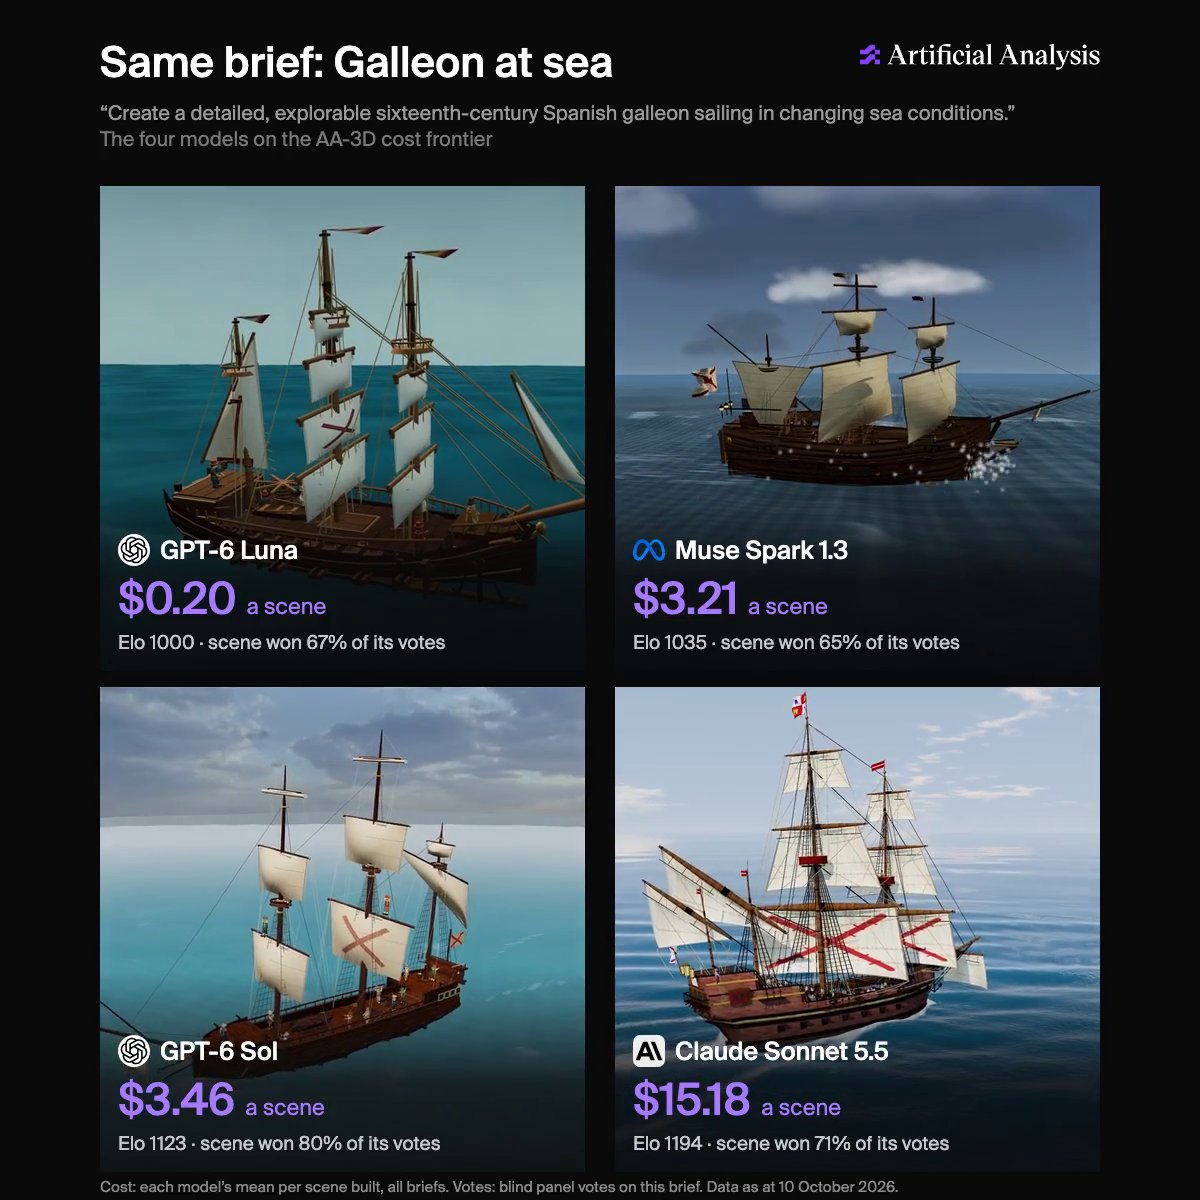
AA prices every scene from token counts, split into fresh input, cache reads, cache writes, reasoning and answer. A scene costs from $0.20 (GPT-6 Luna) to $32.08 (Claude Fable 5.1). Input is 69% of the spend, because an agent resends its context every turn; input is 97% to 99% of all tokens, mostly read from cache. I recomputed the cost frontier from the embedded per-scene costs and it matches: GPT-6 Luna at $0.20 and 1000, Muse Spark 1.3 at $3.21 and 1035, GPT-6 Sol at $3.46 and 1123, Claude Sonnet 5.5 at $15.18 and 1194. Kimi K3 spends 68 times what Luna does per scene for a slightly lower rating.
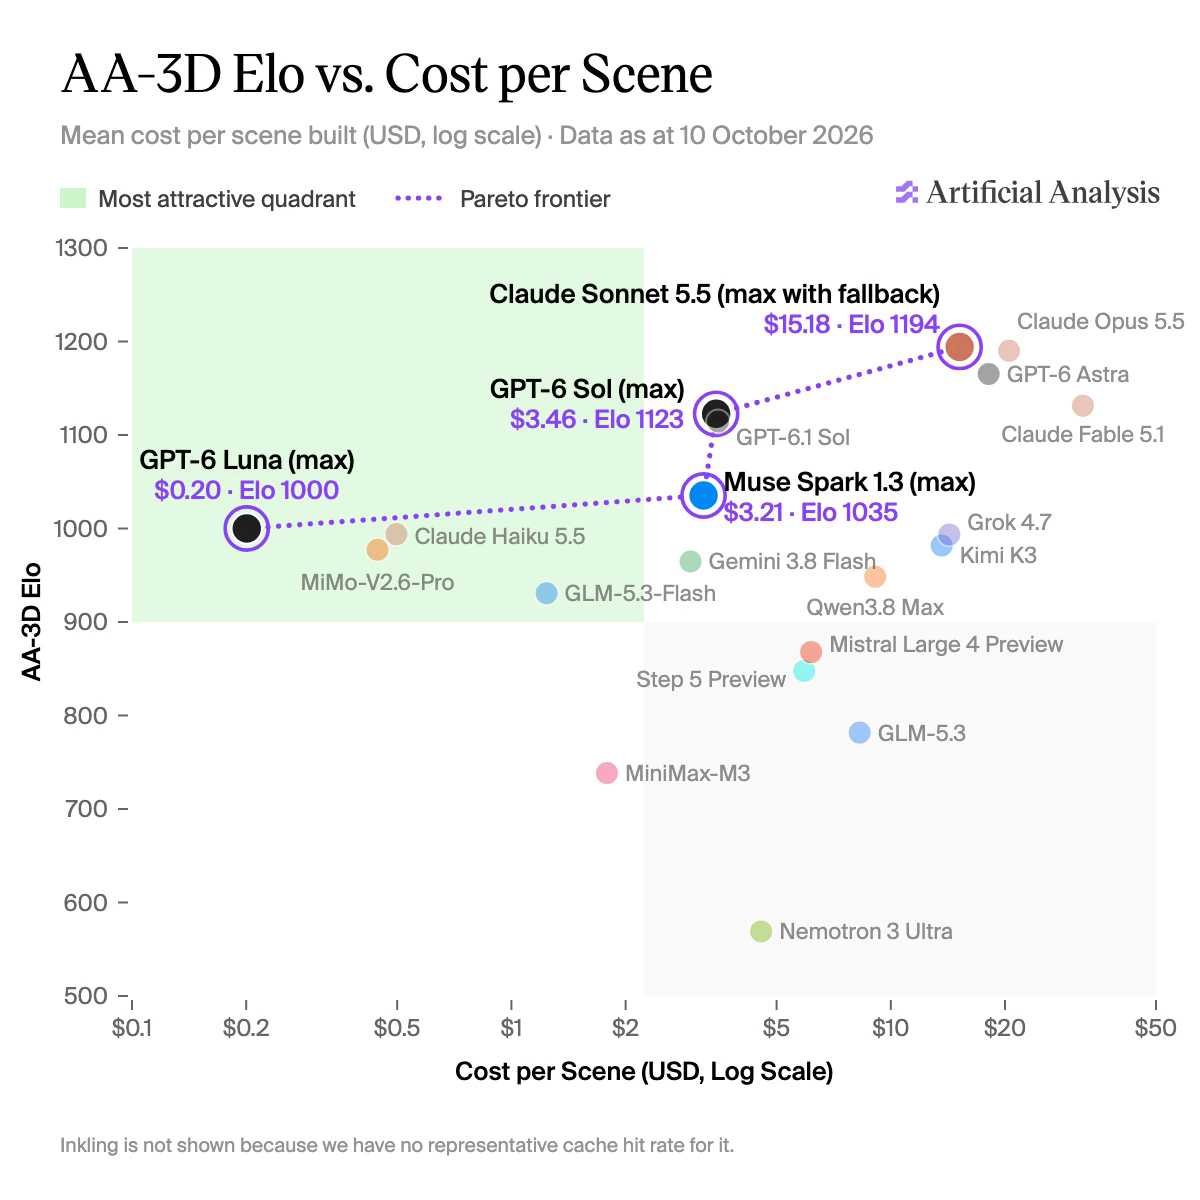
The frontier ignores intervals, which matters at its cheap end. Because Luna is the anchor, Muse Spark's published interval, 1003 to 1067, is literally the interval on its gap to Luna, and it clears 1000 by three points. The frontier's second step exists, just. GPT-6 Sol over Muse Spark (87 points) and Sonnet over Sol (71) are both clear.
If I were picking a model to build these scenes, the frontier reads simply. GPT-6 Sol at $3.46 is fifth overall and 4.4 times cheaper than Sonnet; Sonnet buys roughly 70 Elo, which is a 60% head-to-head preference, for the extra $11.72; and nothing past Sonnet buys anything the panel can detect. Luna at 20 cents is the surprise: eighth overall, with 54 of its 55 scenes in the explorer. One caveat on the axis: it is "mean cost per scene built". AA does not say whether runs that produced no eligible scene count in the denominator, and for a model that misses eight of 55 the difference could be real.
What I'd take from it
AA-3D is the first 3D-generation benchmark I would cite. The protocol is sound where open arenas are weak: a fixed brief, a fixed sandbox with a clock, blind pairs from the same brief, a viewing floor, hidden check questions, recruited panelists, and an estimator and interval that are named and, as far as I can reproduce them, correctly computed. The launch analysis is unusually self-critical, and the scenes are all public, so you can look at what a 1194 means.
How I would read it:
- Treat the top three as one tier and everything from Fable to GPT-6.1 Sol as the next. For two models, test the gap against the interval of the gap, which is about ±37 at this vote count, not whether their bars overlap. The leaderboard's Range column agrees with that test at the top, so read it before the bars.
- Read a rating as quality given a working scene. If you will run an agent unattended, ask AA for completion rates, or count scenes in the explorer as I did.
- Read Elo as what a person prefers after half a minute. Visible detail, more controls and an agent that checks its own screenshots early win those votes. Whether the brief was met is not scored.
- Don't over-read the Intelligence Index fit. It is real, and three weak models make it look tighter than it is among the models you would actually choose between.
The thing it cannot be yet is reproducible. Stirrup is open, the scenes are open, and the ratings can be rebuilt from the page, as this article does. The briefs in full, the delivery contract, the automated-check fields and the votes themselves are not, so nobody outside AA can rerun a model or refit with a different pairing. For a benchmark whose whole value is that a third party ran it, publishing the vote table would cost nothing and settle most of the questions above.
If you build three.js scenes with agents, PixiJS 3D and benchy and Voxel Musou are two things built that way, read file by file, and One-shot launch videos looks at the same idea for video.
How I checked
- Read the X post and its thread through the fxtwitter mirror, and the launch article, methodology page and leaderboard at artificialanalysis.ai on 13 October 2026. Every rating, interval, rank range, Intelligence Index, Terminal-Bench 4.0 and SciCode score, domain win rate with scene count, per-scene cost and tool-use breakdown here is parsed from the data those pages embed.
- Recomputed the Elo-vs-Index fit (ordinary least squares and Pearson's r) for all 21 models and for the 18 with an Index of 30 or more, and the same for Terminal-Bench 4.0 and SciCode. Recomputed the cost frontier from per-scene costs.
- Checked the Elo scale by comparing each model's expected score against the other 20 under the 400-point logistic with its scene-weighted domain win rate. This assumes roughly even pairing and per-scene weights stand in for per-vote weights, so it is a consistency check, not a refit.
- Simulated the panel: 10,000 votes between uniformly random pairs drawn from the published ratings, a Bradley-Terry
fit by Newton's method with GPT-6 Luna anchored at 1000, intervals from the inverse Hessian, 20 seeds. The widget
runs the same fit in the browser (
components/articles/aa-3d/bt.ts). AA uses a sandwich estimator, which agrees with the Hessian one when the model is right; its vote table is not public, so I could not refit the real votes. - Counted scenes per model and the missing briefs from the launch article's scene explorer.
- Cloned Stirrup at
247f24d(MIT) and read the agent loop, constants, image handling and summariser prompt. The AA-3D task configuration is not in it. - Not verified: why any particular scene is missing, how AA pairs models for voting, and whether failed runs count in cost per scene.