2026-10-06 · 24 min · webgpu · benchmarks · performance · gpu · agentic-coding · typescript · reproducibility
Why read this
Notabletop 60%Decodes the 5.9x footnote, explains the WebGPU timing probe and labs' two-gate verdict from source, and audits the agent-written PixiJS PRs behind the claim.
- Original analysis
- A lasting reference
- Concrete numbers to act on
GPUs, kernels & systemsRuns in a browserPractitioner teardown
How this was scored
- Is it new?
- 1 of 3: An incremental tweak
- Can I trust it?
- 2 of 3: Measures key facts from files, code or configs
- Can I run it?
- 1 of 3: API-only, gated or restrictive licence
- Will I understand it?
- 2 of 3: Mechanism from first principles with figures
- Can I act on it?
- 2 of 3: A concrete recipe, numbers or comparison
- Will it last?
- 2 of 3: A reference for a year or more
- Does it affect many?
- 1 of 3: A specialist community
- Only here?
- 2 of 3: A teardown or measurement few others did
Score 58 of 100, ranked 259 of 445 rated articles. Each question is answered 0–3 by hand, and a 3 is rare. How articles are scored
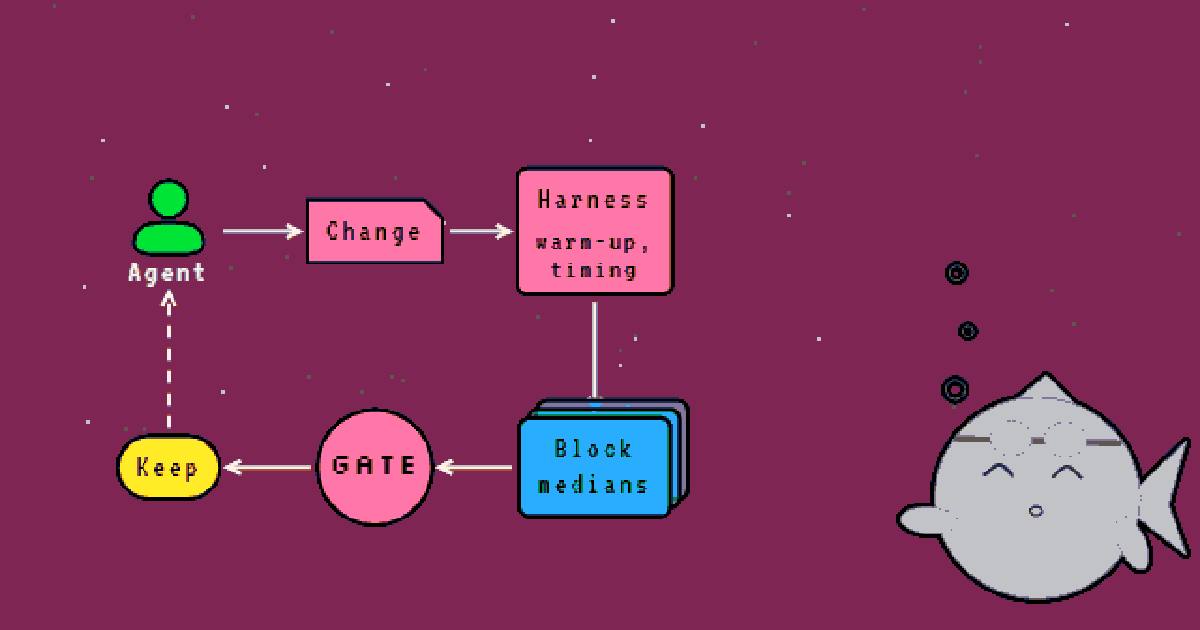
On 6 October the PixiJS account posted that PixiJS 3D "just got a lot faster": "Since the beta launch, WebGPU performance is up ~6x on average, and up to 30x in some scenes." Most of the credit went to a tool: "benchy, a benchmarking tool we're building on top of @pmndrs labs and @endel's WebGL/WebGPU benchmarks. It provides a great feedback loop for agents (Opus 5.5 in our case), so they can verify their own changes and keep finding improvements."
I wanted to see that loop. A renderer that an agent speeds up 6x by checking its own work is a more interesting claim than the speed-up itself, because the hard part of GPU performance work has never been the ideas. It is knowing whether the change you just made did anything.
The first thing I found is that I can't look at either half directly. pixijs.com/3d is a sign-up form for a closed beta that hands out "beta repo" invites by GitHub username, and benchy has no public repository or npm package that I could find. The thread under the post confirms it: "Still in closed beta for now!"
Three things are public, though, and together they say more than I expected. The launch video has a footnote. The two harnesses benchy is built on are open source, and I read both. And the agent loop doesn't only touch the private repo: PixiJS 3D sits on top of PixiJS core, and the fixes it needs in core arrive as public pull requests with measurements in them.
The footnote nobody quoted
The post's 7.55-second video ends on "Now 5.9x faster, across 27 WebGPU scenes". Under that, in tiny grey text, is the method. I pulled the 1280x720 file from the post and read the bottom strip of the last frame:
WebGPU · Chrome 154 · Apple M3 Pro · PixiJS 3D closed-beta start vs v0.1.0-beta.2 · frame cost = slower of CPU and GPU p95; CPU time = CPU p95; GPU time = GPU p50 · 5.9×, 1.6×, 4.9× and 4.4× = geometric means of 27 scenes

The line answers more than the post does. "~6x on average" is 5.9x, and the average is a
geometric mean, which is the right kind for ratios: one scene that went 30x and one that went 1.2x
average to 15.6x arithmetically and to 6x geometrically, and only the second number survives
flipping the ratio the other way. The comparison is the first closed-beta build against
v0.1.0-beta.2, on one laptop, in one browser.
"Frame cost = slower of CPU and GPU p95" is not a PixiJS invention. It is word for word the definition in endel's benchmark README: "Frame cost = max(CPU p95, GPU p95). It's independent of vsync, and it drives the 'max N at 60 fps' figure." So benchy has at least kept endel's metric, and probably his split of CPU time at p95 and GPU time at p50.
Two things the footnote doesn't settle. It lists four geometric means and defines three metrics, and I can't tell from the frame which of 1.6x, 4.9x and 4.4x belongs to CPU time and which to GPU time, or what the fourth one measures. And "up to 30x in some scenes" appears only in the post's text, not in the video, so I have no scene, metric or build to attach it to. I'd treat 5.9x as the claim and 30x as colour.
Timing a WebGPU frame without lying to yourself
The ingredient that measures frames is endel/webgpu-webgl-benchmarks,
a harness that runs three.js r186, PlayCanvas 2.22.2 and Babylon.js 9.26.0 through the same
deterministic scenes in Chrome, Firefox and Safari. I read it at commit 25723d7 (14 September).
It has no licence file. Its own results are worth a look later; first, how it measures.
The problem it solves is that a WebGPU frame has two clocks. JavaScript builds command buffers on
the CPU, the GPU executes them later, and with vsync off Chrome lets the CPU run several frames
ahead of the GPU. Time the requestAnimationFrame interval and you measure whichever side is
slower, mixed with the browser's frame pacing. You need both sides separately.
The CPU side is easy: performance.now() around the engine's update-and-render call, with the
harness's own scene simulation timed and subtracted (src/harness/run.ts:151-157).
The GPU side is the clever part. The harness patches WebGPU's prototypes before any engine module
loads, so it never needs the engine's cooperation. When a device is requested it adds the
timestamp-query feature, and when the engine begins a render or compute pass it hands the
browser a copy of the pass descriptor with timestamp writes attached:
// src/harness/probe-webgpu.ts:120-126 (endel/webgpu-webgl-benchmarks @ 25723d7)
inject<T extends GPURenderPassDescriptor | GPUComputePassDescriptor>(enc: GPUCommandEncoder, desc: T | undefined): T | undefined {
  const s = this.cur;
  if (!s || (desc && desc.timestampWrites) || s.used + 2 > QUERIES_PER_FRAME || !this.encoders.has(enc)) return desc;
  const i = s.used;
  s.used += 2;
  return { ...(desc as object), timestampWrites: { querySet: s.qs, beginningOfPassWriteIndex: i, endOfPassWriteIndex: i + 1 } } as T;
}
The copy matters. Engines cache their pass descriptors, and mutating one would leak the probe's
query set into the engine's next frame. Each frame records into one of eight slots of 256
queries, resolves them into a buffer and maps it back with mapAsync, without waiting. If all
eight slots are still mapping, that frame simply goes untimed rather than stalling the pipeline
it is trying to measure (probe-webgpu.ts:128-165).
From the timestamps it computes two numbers per frame. The span runs from the first pass's start to the last pass's end, which counts idle gaps when the CPU is still building the frame. The sum adds up pass durations, which double-counts passes that overlap on a tile-based GPU like the M1 Pro's. The README says the reported GPU time is the smaller of the two, "since true busy time can't exceed either". Neither estimate is right, but each is an upper bound, so the minimum is the tighter one.
The protocol around the probe carries most of the trust:
- Warm-up lasts until no new pipeline has been created for 30 frames, with a floor of 90 frames
and 1.5 s in the
quickandfullprofiles (run.ts:210-219). WebGPU engines compile pipelines lazily, and one compile in the measured window is a 50 ms spike that has nothing to do with steady-state cost. Pipelines created during measurement are still counted and flagged. - Measurement is at least 240 frames and 3 s, and every configuration is its own page load, so one engine's garbage and caches never sit under another's numbers. Engine order is shuffled in each block, and a canary cell reruns every 20 runs to catch thermal drift.
- Counting the hot calls (draws,
setPipeline,setBindGroup,writeBuffer) means wrapping them, which costs time, so counters are a separate run and timing runs only wrap the rare calls. - A run in another browser that issues fewer than half of Chrome's draw calls for the same cell is failed. A shader can fail silently, and an empty frame is very fast.
Keep that last rule in mind. It is the one that matters most when the thing being measured is an agent's change.
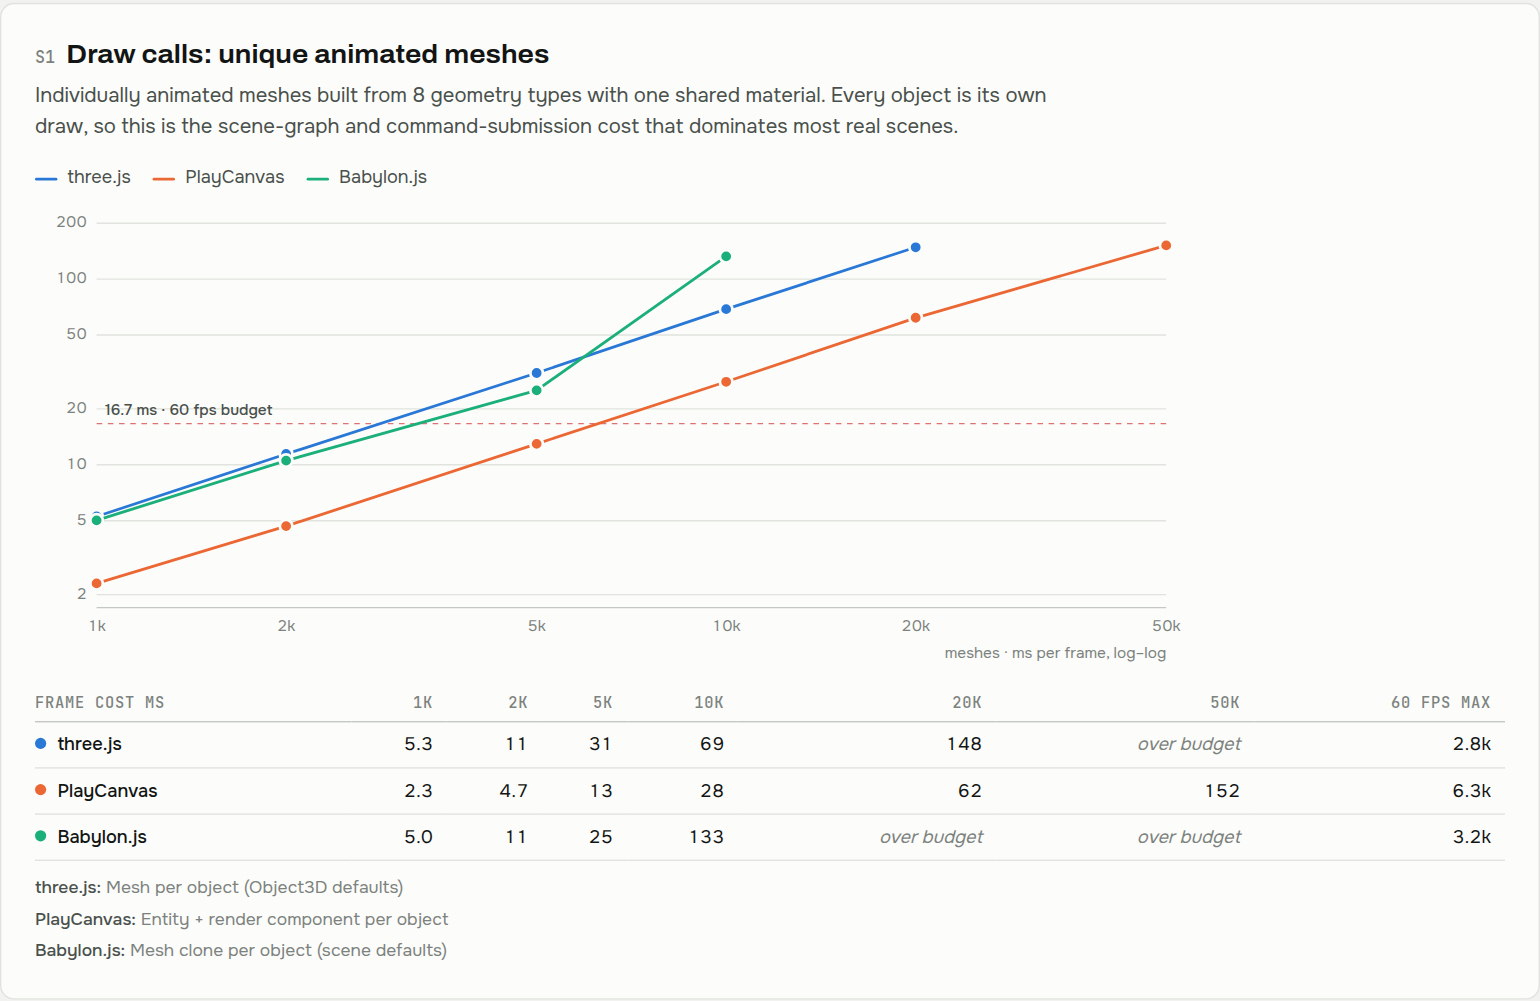
The results explain why a 3D renderer has room for big multiples. In scene S1, where each mesh is its own draw call, frame cost at 5,000 meshes is 31 ms for three.js, 25 ms for Babylon.js and 13 ms for PlayCanvas, all with the same geometry, the same material and the same GPU. That spread is CPU-side JavaScript: scene-graph walks, uniform uploads, state changes. The README's headline finding makes the same point from the other side: "WebGPU isn't automatically faster." three.js's classic WebGLRenderer did S1 at 5,000 meshes in 7.3 ms against its own WebGPURenderer's 29 ms.
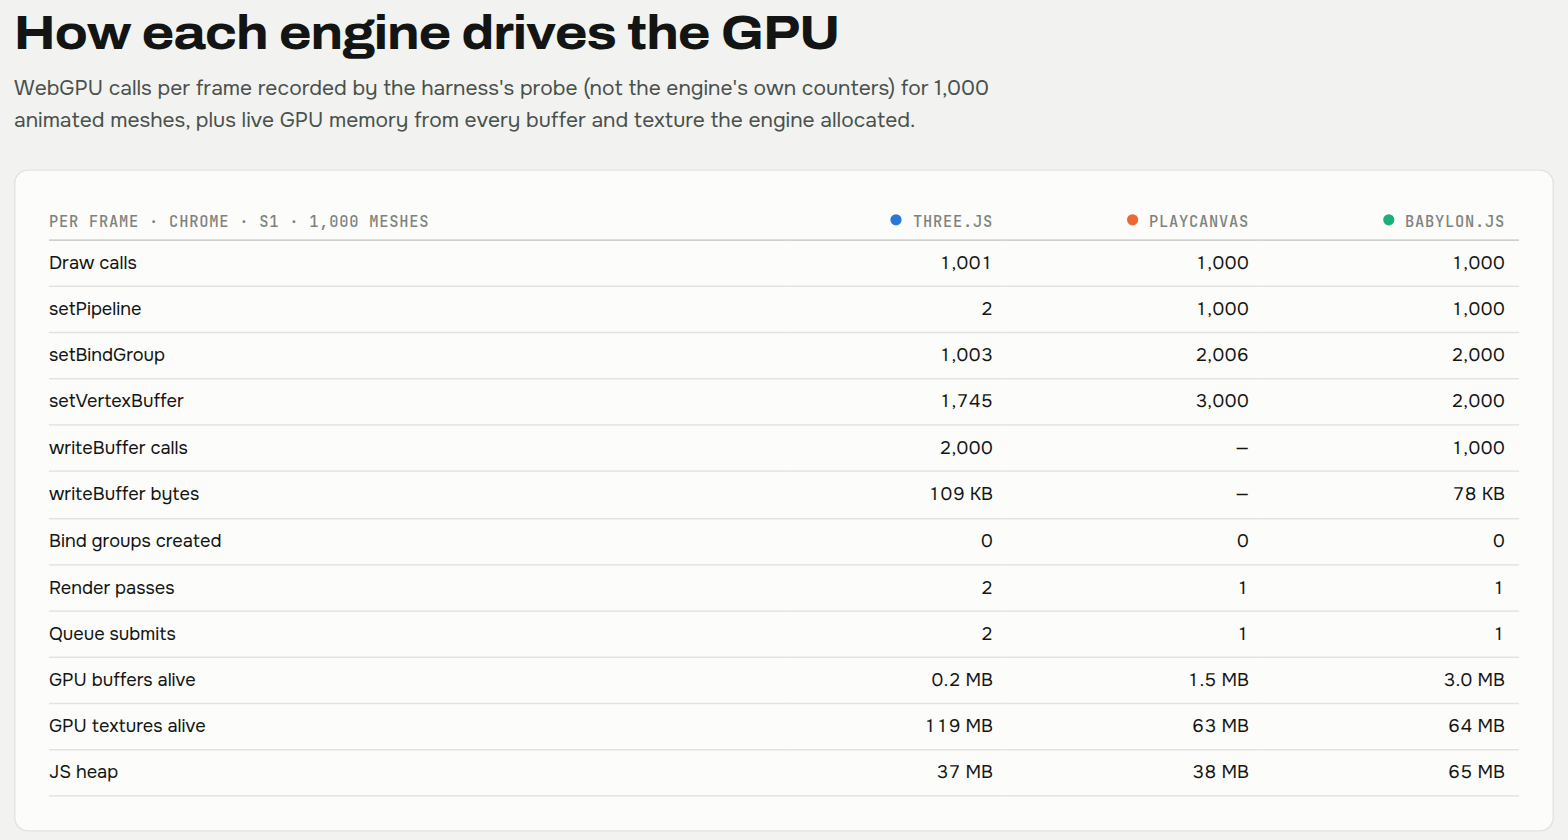
The counters table is the one I'd show anyone writing a WebGPU renderer. Per frame, for 1,000
meshes, PlayCanvas calls setBindGroup 2,006 times and creates zero bind groups. Every one of
those calls first has to find an existing GPUBindGroup for the resources it wants. If that
lookup builds a string, you build two thousand strings a frame. Hold that thought too.
Deciding whether a change is real
Frame timings are noisy, so a harness alone doesn't tell an agent whether its change worked. That
is the job of the second ingredient, pmndrs/labs ("JS benchmarking
you can trust", ISC, @pmndrs/labs 0.9.0, read at b65ac37). Labs runs Node microbenchmarks,
not browser frames, and the README says plainly that it supports Node only for now. What benchy
can take from it is the statistics, and those are the best part.
The unit of evidence in labs is not a sample. It is a block: a fresh worker process that runs one benchmark for at least 0.5 s and 20 samples, with a garbage collection before each sample. Eight blocks per benchmark by default, interleaved across benchmarks (A1 B1 C1, A2 B2 C2 and so on) so that slow drift, a CPU warming up or throttling, lands on every benchmark equally. Each block contributes one number, its median. Thousands of inner samples become eight data points, which sounds wasteful until you remember that samples inside one process share one JIT state and one heap layout. They are not independent, and pretending they are is how benchmarks find 2% improvements that vanish on the next run.
A baseline and a candidate are then compared with two gates, both of which must pass
(src/stats.ts:315-344):
- An exact two-sided Mann-Whitney U test on the block medians must give p ≤ 0.05. With 50 or fewer blocks combined, labs computes the exact permutation distribution rather than a normal approximation.
- The Hodges-Lehmann relative shift, which is the median of every pairwise candidate/baseline ratio minus one, must be at least 5% in size.
The first gate asks whether the difference is real. The second asks whether it is big enough to care about. A rank test on enough blocks will happily certify a 0.4% change as significant, and an agent that keeps every significant change will accumulate a pile of 0.4% "wins", some of them regressions on a machine it didn't test. Labs refuses to call those faster. It reports them as neutral, and says that neutral "means no clear change was found, not that the runs are identical."
Two more numbers come out of the block medians. The between-block spread is
1.4826 × MAD / median, a robust stand-in for the coefficient of variation. From it labs derives
a rough resolution, 2.8 × spread × √(2 / blocks), the smallest change this much noise could
plausibly detect, and marks any comparison where that resolution is coarser than the 5% threshold.
With eight blocks a side, that happens once the spread passes about 3.6%.
The widget runs labs' verdict rule (ported from stats.ts, with the block medians simulated) on
fake runs you control. Three things fall out of playing with it. With two blocks a side, no data
can pass gate 1: the most extreme ordering of four numbers has p = 1/3. Three a side bottoms out
at 0.1; you need four a side before 0.05 is reachable at all, and labs refuses to compare runs
whose block counts can't reach it. With eight a side and 3% noise, a true 6% speed-up is called
faster most of the time but not every time: 388 of 500 seeded runs when I looped the widget's own
code. Press "run it again" and watch it slip to neutral when the noise is unkind. The uncomfortable
one is a true 3% change, which came out "faster" in 50 of those 500 runs. The 5% gate applies to
the estimate, not to the truth, and with eight blocks the estimate wobbles by a couple of percent.
A minimum effect cuts the false wins down; it doesn't make them impossible.
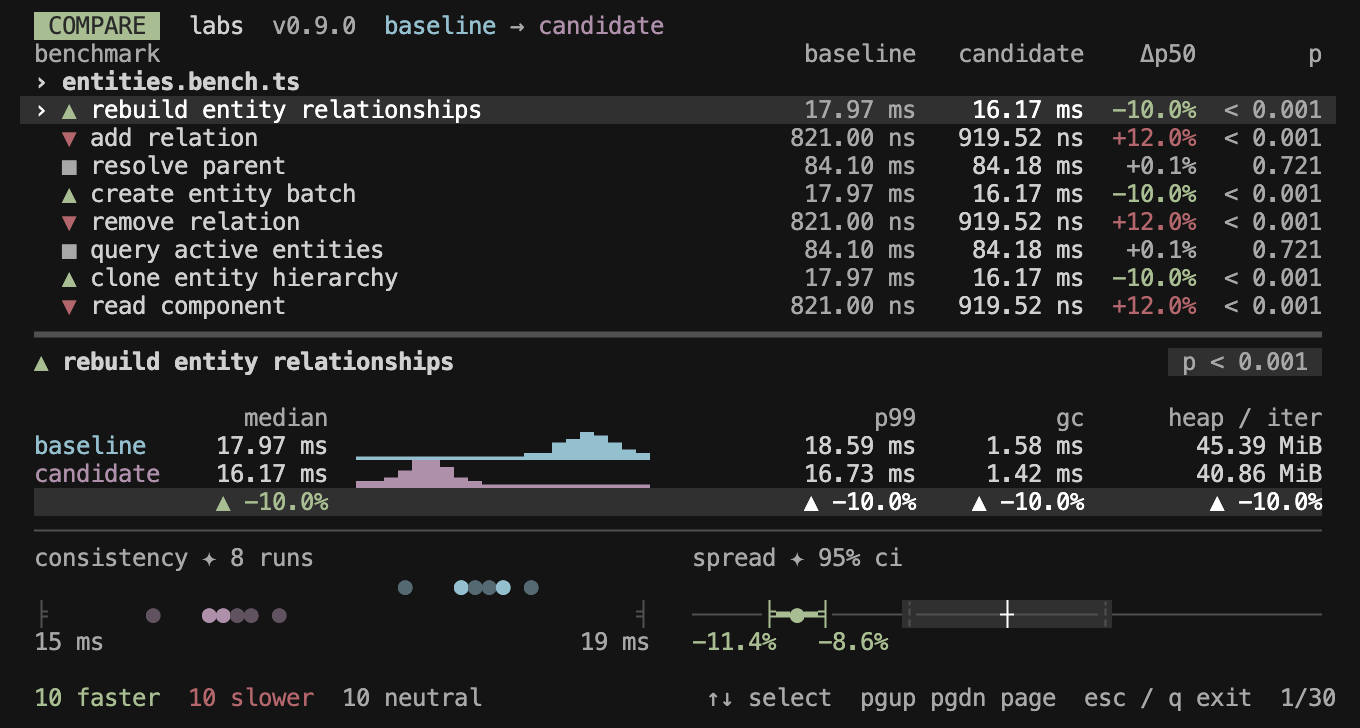
Labs has two more checks that read like they were written with an agent in mind. If a benchmark
measures the same as an empty function, it reports dead-code elimination: the engine deleted the
work, and the "speed-up" is fictional. And a bench can return its result, or a snapshot of the
state it mutated. Labs keeps the first untimed call's output and compares the candidate's output
against the baseline's; a change that makes the code faster by making it wrong shows up as
output changed in place of a verdict, the microbenchmark version of endel's empty-frame
rule.
There is also a check I didn't expect. When the two runs' median clock speeds differ by more than 2%, labs re-judges the same block medians in estimated CPU cycles, and if the verdict in cycles disagrees with the verdict in time, it skips the benchmark as clock-confounded. A laptop that boosted during the candidate run doesn't get to produce a win.
Why an agent needs both
I think this is the actual content of "a great feedback loop for agents", and it is more specific than it sounds.
A coding agent with a profiler and no gate does what an eager junior does: it makes a change, sees a number move, and believes it. The difference is that the agent makes fifty changes an afternoon, so the believable-but-false ones pile up faster. What the two harnesses give it, between them, is a set of refusals: no measurement until pipelines stop compiling, no timing from the run that counts calls, no verdict from samples inside one process, no "faster" under 5%, no win if the frame drew nothing or the output changed. Each refusal closes one way of fooling yourself, and an agent that can't fool itself has only one way left to make the number move.
Labs doesn't solve everything, and its README says so: it "does not currently adjust alpha
across a suite." A 27-scene suite judged at 0.05 per scene will, by chance alone, show a little
over one significant scene per run even when nothing changed (27 × 0.05 is 1.35). The 5% gate
removes most of those, but not all. One of the replies under the post asked the question I'd ask
next: "How do you keep the 27-scene suite representative as the renderer changes?" Nobody
answered it, and I can't either. A fixed suite is the thing an optimizer overfits to, whether the
optimizer is a person or a model.
What the loop sends upstream
Now the part I could check. PixiJS 3D is built on PixiJS core's WebGPU renderer, and when the
3D work needs something from core, it arrives as a public pull request. I pulled every PR opened
on pixijs/pixijs since 1 June through the GitHub API: 138 of them. 27 end with "Generated with
Claude Code". Mat Groves (GoodBoyDigital, PixiJS's creator) opened 24, and 20 of his carry that
footer. Nine PR descriptions mention pixi-3d by name.
They are the most carefully measured pull requests I have read in a while. Most have a before/after table, say what machine and how many interleaved runs, and say what wasn't measured. The performance ones that name pixi-3d or its benches, in the authors' own numbers:
| PR | What changed | Before → after |
|---|---|---|
| #12278 | bind-group keys as two 32-bit integers, not strings | 860 unchanged lookups: 71 µs → about 3 µs a frame |
| #12229 | indexed loops instead of for...in on every draw | _touch on a 32-entry group: 360 B, 513 ns → 0 B, 94 ns |
| #12228 | array uniform sync stops reading past its array | 128-entry vec4 light array: about 24 KB and 11.5 µs per sync → 1 B and 1.6 µs |
| #12288 (open) | stop GC-stamping samplers; don't re-key an unchanged id | _touch 122 ms → 51 ms over a 4.7 s profile |
Every one of these is CPU-side JavaScript on the path endel's counters table pointed at: what runs per draw and per bind.
The bind-group key
#12278 is the one worth reading in full, because the problem it fixes is common to every WebGPU
engine. A GPUBindGroup is immutable and expensive to create, so engines cache them by content:
two groups holding the same buffer, texture and sampler at the same bindings should share one
native object. Before the PR, PixiJS keyed that cache with a string. BindGroup._key joined every
resource id with |, and BindGroupSystem.getBindGroup appended the layout on every lookup:
// BindGroupSystem.ts before #12278 (pixijs @ 39aeec2)
const key = `${bindGroup._key}:${(program._layoutKey << 4) | groupIndex}`;
const entry = this._hash[key];
A fresh string per bind, on a path that runs about two thousand times a frame for a thousand meshes. After the PR, the key is two 32-bit integers. Each binding contributes one hashed mix of its binding number and resource id to each half, and the bindings combine with XOR:
// src/rendering/renderers/gpu/shader/BindGroup.ts:12-22 (pixijs dev @ 194e42c)
function mixLow(binding: number, id: number): number
{
    let h = Math.imul(id + 0x9E3779B9, 0x85EBCA6B) ^ Math.imul(binding + 1, 0xC2B2AE35);

    h ^= h >>> 16;
    h = Math.imul(h, 0x7FEB352D);
    h ^= h >>> 15;
    h = Math.imul(h, 0x846CA68B);

    return h ^ (h >>> 16);
}
XOR is its own inverse, which is the whole trick. Re-pointing a binding XORs the old mix out and
the new one in (_rekey, BindGroup.ts:200-208), four mixes regardless of whether the group
holds two resources or thirty-two. Pointing it back restores the exact original key, so the cache
hands back the original GPUBindGroup. And a group that hasn't changed skips the cache entirely:
it remembers the entry it last resolved to (_gpuEntry) and returns it after a few comparisons
(BindGroupSystem.ts:121-133).
Click the bindings to re-point them. The string row is what the old code built on every lookup;
the hex row is what the new code keeps. Point a texture away and back, and the slot comes back
with it: the log marks that key as seen before, which in PixiJS means a cache hit and no new
GPUBindGroup.
The cache itself is a plain object indexed by 30 bits of the key, so it stays a small-integer
dictionary that PixiJS's garbage collector already knows how to sweep. Two keys that land in one
slot replace each other; a hit compares both halves and the layout key, so a collision costs a
rebuild and never returns the wrong group. The PR explains why it didn't use a Map with a 53-bit
key: in V8 that allocates a heap number per lookup, which is the thing being removed.
What I liked most is the paragraph after the numbers. The PR says the author "benchmarked eleven
designs on a model of this path before picking one, in Node and on a Pixel 9 and an iPhone 15",
then reports that BunnyMark, PixiJS's standard 2D stress test, is unchanged on both phones, "as
expected. It binds a handful of groups per frame." It even reports a slower number for the new
code (Pixel 9, 4.87 to 4.97 ms) and says every difference is inside the spread between rounds:
labs' neutral verdict, written as prose. Then: "Most of the remaining 108 µs is probably
the change listener swap in setResource, which this PR does not touch. I have not measured
that split." A person who writes that sentence has been burned by a benchmark before. An agent
that writes it was told to.
Small loops, per draw
#12229 is the kind of fix only a measurement finds. for...in over an object with integer keys
looks harmless, but V8 can't reuse its cached key list for integer-keyed objects, so every loop
builds a new array of key strings. PixiJS ran three of those per draw in GpuEncoderSystem and
one per rebind in BindGroup._touch. The fix keeps a sorted array of binding numbers on the group,
built once with Object.keys(...).map(Number) so V8 allocates it at its final size as packed
integers, and indexes it. The PR notes that push() would have reserved about 17 slots for a
group that holds 1 to 4. Measured in the bloom example, the old loops allocated about 9.5 KB a
frame.
#12228 is my favourite bug of the set because it was hiding as a performance problem. The WGSL
uniform sync for array uniforms looped size × floats-per-element times when each pass already
copied a whole element, so a mat4x4 array was read 16 times per sync, mostly past the end of its
backing array. Out-of-range typed-array reads drop V8 onto a slow path that boxes every float.
pixi-3d's 128-light vec4 array paid about 24 KB of garbage and 11.5 µs per sync for it. The same
fix found that matrix array elements had been overlapping, because the padding formula went
negative for every matrix type: a correctness bug that nobody saw until a profiler pointed at the
loop.
#12288 is still open. _touch stamps a last-used time on every resource a draw binds so the GC
knows what is alive, but PixiJS never collects samplers, so stamping them did nothing. For a
texture-plus-sampler group, half the work was wasted. The PR measures it in "pixi-3d's
rebuild-every-frame bench (5000 meshes, about 1000 texture bind groups of texture and sampler pairs
per rebuild, Apple M3 Max, Chrome 154)" and reports "about 0.04 ms a frame". I couldn't reconcile
that with its other figure: 71 ms saved over a 4.7 s window is 0.04 ms a frame only if the bench
ran about 1,800 frames in that window, about 2.6 ms each, and the PR doesn't say. It is a small
thing, and the only number in the set I couldn't make add up.
There are non-performance PRs in the same stream that tell you what pixi-3d is doing: render
bundles that carry a stamp of the pipeline state they were recorded under, so a 3D pass can
replay a prerecorded draw list and know when it has to re-record
(#12158, which notes "pixi-3d is its only known
consumer"); partial texture uploads, because pixi-3d keeps material, mesh, bone and morph data in
4096-wide rgba32float data textures (#12227); 3D
and storage textures (#12248). And one from the
same author with a Claude Code footer, still open, that I'd merge for the table alone: replacing
eventemitter3, whose removal is quadratic, cuts removing 20,000 listeners from 634 ms to 3.8 ms
on an iPhone 15 (#12268).
Do microseconds add up to 5.9x?
No, and I don't think PixiJS claims they do.
A 16.7 ms frame is 16,700 µs. The bind-key change saves about 68 µs a frame on its 860-group benchmark, about 0.4% of that budget. The sampler change is 0.04 ms by its own account. Even the uniform-sync fix, at about 10 µs per sync, matters only if it runs many times a frame. Stack every public win and you get a few percent on a heavy 3D frame, plus less garbage, which shows up in p95 more than in the median. Worth having, and probably why the footnote measures p95. It isn't 5.9x.
The multiple has to come from pixi-3d's own code, which I can't read. Endel's data says where it could plausibly come from. Per-object CPU cost differs by 2x to 4x between mature engines on the same scene; instancing cuts CPU cost "10–100×" in his runs; a forward renderer that shades every light at every pixel paid 53 ms of GPU time where PlayCanvas, which skips lights that can't reach the pixel, paid 1.3 ms. A renderer at closed-beta start, written for correctness first, can easily sit at the slow end of all three. I'd guess the 5.9x is mostly batching and instancing, pipeline-state reuse and fewer passes inside pixi-3d, with the core PRs as the long tail. It's a guess. The PR record is consistent with it, and nothing public confirms it.
One more caution from the PRs themselves. Their measurements are not labs verdicts. #12278's table is a "median of three interleaved runs"; by labs' own rule, three against three can never reach p ≤ 0.05. That doesn't matter when the effect is 71 µs to 3 µs, and the author treats the small effects in the same PR as noise. It would matter for a 5% claim. A loop that measures and a loop that decides are different loops.
What I'd take from this
The 5.9x is one machine, one browser, a geometric mean over a suite nobody outside can see, and I can't verify it. What is public is more useful anyway: two harnesses that between them define what an honest WebGPU speed-up looks like, and a stream of upstream PRs that show an agent working inside those rules.
If I were building this loop for my own renderer, I'd copy five things. Time CPU and GPU separately, and get GPU time from timestamp queries injected into copied descriptors, resolved asynchronously. Warm up until pipeline creation stops, not for a fixed time. Report frame cost as the slower of CPU p95 and GPU p95, and summarize a suite with a geometric mean. Judge a change on fresh-process block medians with a rank test and a minimum effect, so "significant" and "worth keeping" are separate questions. And make every benchmark prove it did the work: a draw-count check for frames, an output snapshot for functions. That last one is the one I'd never let an agent run without.
For more on what WebGPU costs in a real port, see the GTA V browser teardown; for pmndrs' allocation-free style of JavaScript that these PRs keep converging on, see pmndrs/math and TypeGPU; and for the CPU-side habits underneath all of it, CPU performance engineering.
How I checked
I read the post, its thread and the first page of replies through the fxtwitter API, downloaded
the 1280x720 video from the post and read the footnote by cropping and upscaling the bottom strip
of the frame at 7.2 s. I looked for benchy and PixiJS 3D on GitHub and npm and found nothing
public; pixijs.com/3d is a closed-beta sign-up. I shallow-cloned and read
endel/webgpu-webgl-benchmarks at 25723d7 (the harness, probes, protocol and run matrix) and
pmndrs/labs at b65ac37 (the statistics, sampling constants and README), and took the two
report figures from a headless-Chromium render of the harness's published docs/index.html. For
PixiJS, I listed every PR opened since 1 June 2026 through the GitHub search API (138), counted
the Claude Code footers and pixi-3d mentions in their bodies, read the nine pixi-3d PRs and their
file lists, and read BindGroup.ts, BindGroupSystem.ts, GpuEncoderSystem.ts and
PipelineSystem.ts on dev at 194e42c, with the pre-#12278 versions fetched from its parent
commit 39aeec2. Every before/after number in the PR section is the PR author's; I didn't rerun
them. The minimum p-values, the resolution threshold and the per-frame budget arithmetic are my
own, from the formulas in stats.ts.