2026-10-13 · 24 min · benchmarks · agents · agentic-coding · pricing · safety
A 1:38 narrated explainer, drawn in code. Every number and picture in it is this article's own; the sources are below.
› transcript
Hi, I'm Quasar! Meta's new model scores two points behind the leader on a popular index. Let's see what those two points are made of. A composite index is a weighted average. The size of a gap matters less than which benchmark it comes from. Ten benchmarks sit in four groups: agents, coding, general knowledge and science. Two agent tests are judged head to head, so their ratings are mapped onto a zero to one scale first. Every score is multiplied by its weight and added up. Rebuilt from the published scores, Wonder Full lands on exactly the number on the leaderboard. Here is how a judged rating turns into points. Fifteen is this benchmark's share of the whole. The rating is squeezed onto zero to one, so about a hundred and thirty Elo buys one index point. One factual recall benchmark hands Opus more than the whole gap. The same benchmark pays Wonder back for declining to guess. Everything else is a few tenths. And it gets there on less than half the output tokens per task. Meta's own test plots tasks it trained toward against tasks it did not. Wonder Full sits about ten points higher. The task sets are not named, so nobody can check it. Read an index gap row by row. This one is mostly factual recall, which is the hardest thing to game. A weighted sum of ten benchmarks. A gap that is mostly recall. And half the tokens per task. Every source is in the full article. I'm Quasar. Bye!
Why read this
Notabletop 60%Rebuilds Muse Wonder Full's 55.80 from AA's ten evals: the 1.82 gap to Opus 5.5 is mostly Omniscience recall, and three benchmaxxing tests come back mixed.
- Checked against the source
- Widely used
- Concrete numbers to act on
Evals & benchmarksAPI onlyProprietaryPractitioner model
How this was scored
- Is it new?
- 1 of 3: An incremental tweak
- Can I trust it?
- 3 of 3: Reproduces the headline result, or shows from primary files it is wrong
- Can I run it?
- 1 of 3: API-only, gated or restrictive licence
- Will I understand it?
- 2 of 3: Mechanism from first principles with figures
- Can I act on it?
- 2 of 3: A concrete recipe, numbers or comparison
- Will it last?
- 1 of 3: Relevant for months
- Does it affect many?
- 2 of 3: A widely used model, tool or lab release
- Only here?
- 2 of 3: A teardown or measurement few others did
Score 64 of 100, ranked 202 of 513 rated articles. Each question is answered 0–3 by hand, and a 3 is rare. How articles are scored
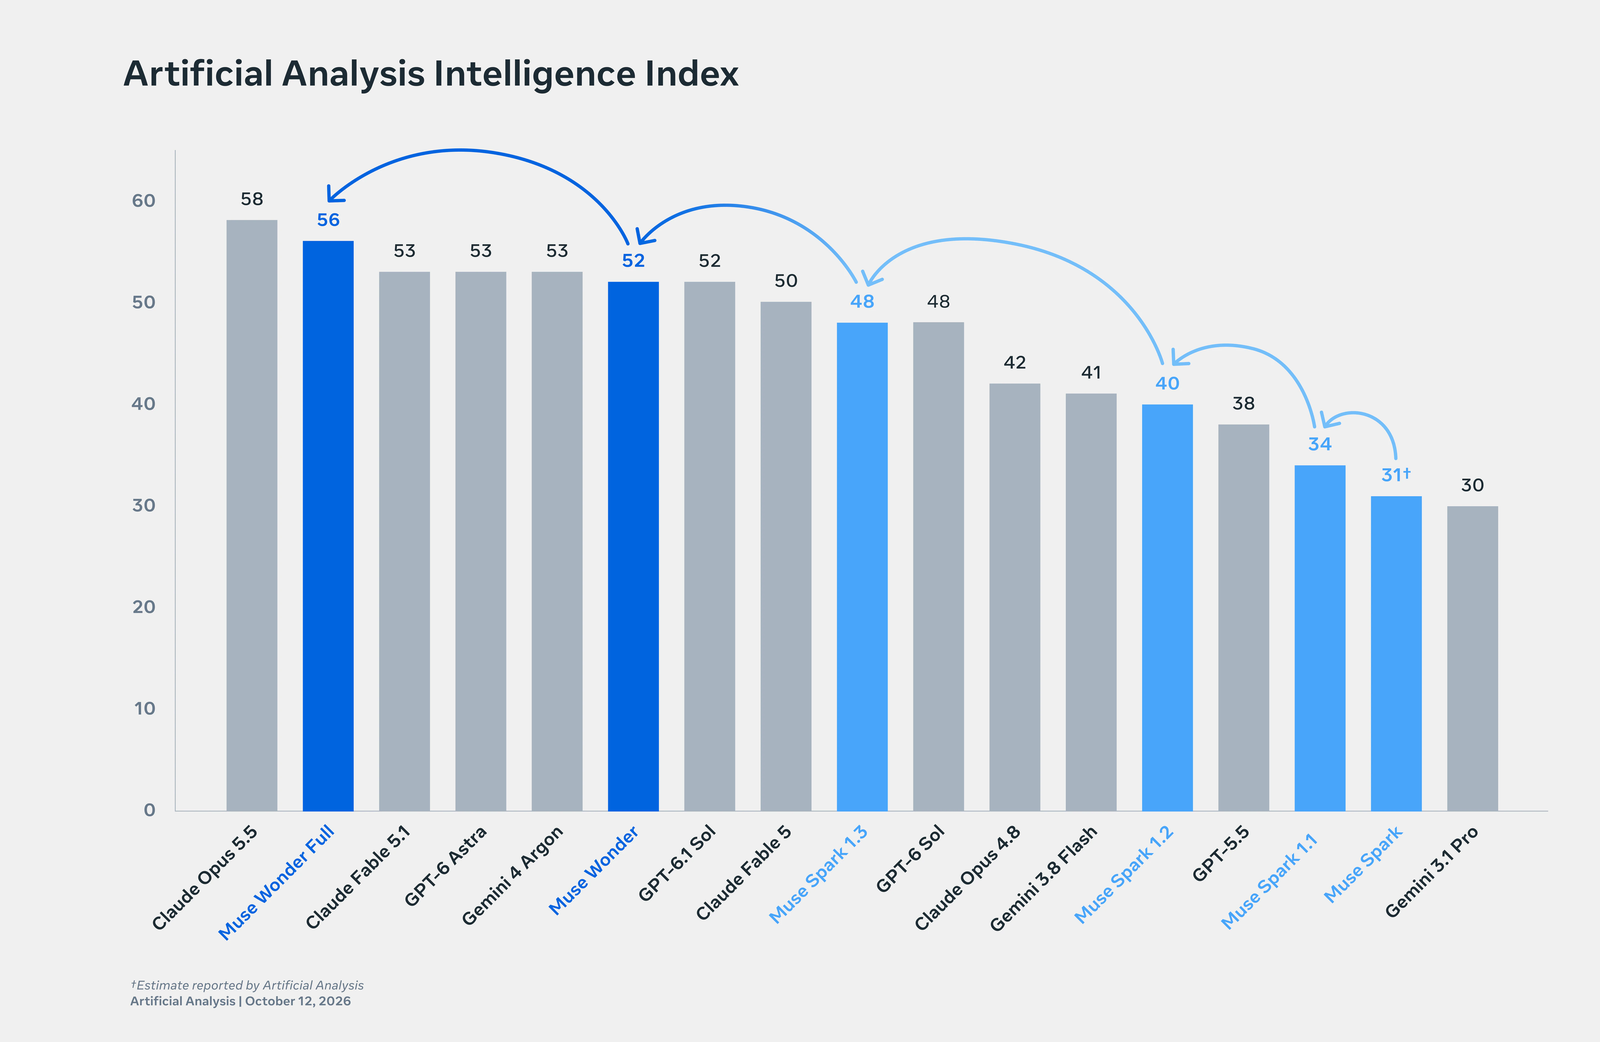
Meta Superintelligence Labs shipped Muse Wonder on October 12, and the post that sent me to it was not Meta's. It was a reply-guy chart: "It scores 56 on AA's Intelligence Index, putting it 2 points below SOTA (Opus 5.5), and overall the 2nd best model in the world per the Index!" The same author followed up an hour later with the sentence that most people were thinking: "I have similar benchmaxxing concerns to when Google dropped Argon's benchmark results."
Two points on a composite index is a strange thing to argue about. The index is a weighted average of ten evaluations, each with its own test-set size and its own noise, so "2 points" could be one benchmark having a bad day or a broad, real deficit. And "benchmaxxing" is a claim about how a model was trained, which nobody outside Meta can see. This is a closed model: no weights, no config, no parameter count, no architecture. What I can check is the numbers. So I took the 56 apart.
A disclosure before anything else: this site is written and maintained with Claude agents, and the model Muse Wonder is being measured against is Anthropic's. I have tried to read Anthropic's numbers here exactly the way I read Meta's.
What shipped
Two models. Muse Wonder is the fast one, available through the Meta Model API and Muse Code. Muse Wonder Full is "the full version of the model", in Mark Zuckerberg's thread, and according to Meta's blog it is "available today for Muse Code subscribers". Muse Wonder will power the Muse assistant for subscribers first, and Meta says it will use Wonder to build "specialized models that we can bring to everyone", which is how Muse Spark became Muse Glimmer, the 30B open model distilled from it.
The model card is eight pages and says almost nothing about the model itself. Text, image, video and audio in; text out; a 1M-token context; "trained at our gigawatt-scale Prometheus data center". No parameter count, no architecture, no training-token count. Meta's one sentence on why Wonder is better than Spark is that it builds "on larger, stronger base models". Artificial Analysis lists the size class of Muse Wonder as "large" and leaves Wonder Full's blank.
Everything else is benchmarks. Meta's blog leads with the Artificial Analysis chart, then a fourteen-row results table, then a scatter plot that is Meta's own answer to the benchmaxxing charge. I'll take them in that order, but the index first, because that is where the 56 comes from and it is the only number in the launch that nobody at Meta computed.
How the index is built
The Artificial Analysis Intelligence Index v4.3.2 is a weighted average of ten evaluations that AA runs itself, in four categories: Agents 30%, Coding 20%, Scientific Reasoning 20% and General 30%. Inside those:
| Category | Evaluation | Weight | Test set |
|---|---|---|---|
| Agents | AA-Briefcase v1.1 | 15% | 91 tasks, private |
| Agents | GDPval-AA v2.1 | 10% | 220 tasks |
| Agents | AutomationBench-AA | 5% | 657 tasks, private |
| Coding | Terminal-Bench 4.0 | 10% | 66 tasks, 3 repeats |
| Coding | SciCode | 10% | 288 subproblems |
| General | AA-Omniscience | 10% + 5% | 6,000 questions, private |
| General | GDP.pdf | 10% | 100 tasks, 5 repeats |
| General | AA-LCR v1.1 | 5% | 100 questions |
| Science | Humanity's Last Exam | 10% | 2,158 questions |
| Science | CritPt | 10% | 70 problems, private |
Two details matter for what follows. The two agent benchmarks scored by pairwise judging, AA-Briefcase and GDPval-AA, produce an Elo rating, and AA maps it into the index as clamp((Elo - 500) / 2000). So 2,000 Elo spans the full weight, and on Briefcase's 15% one index point costs about 133 Elo. And AA-Omniscience enters twice: its accuracy at 10%, and one minus its hallucination rate at 5%. A model that says "I don't know" instead of guessing gets paid for it.
AA embeds every model's per-evaluation scores in its model pages. I pulled them, applied the weights above, and got 55.802 for Muse Wonder Full and 52.394 for Muse Wonder, which are AA's published 55.80 and 52.39 to the third decimal. For older models my rebuild lands within 0.17 of AA's figure, because AA freezes an Elo at the time a model is added and the page carries today's Elo. That small drift aside, the index has no hidden term: it is exactly the table above.
The widget below runs that rebuild. Pick two models; each bar is how many index points one evaluation hands to one model over the other after weighting.
Where the 1.82 points come from
Wonder Full against Opus 5.5 is 55.80 against 57.62, a gap of 1.82. Laid out evaluation by evaluation, it is not a broad deficit at all.
One row does nearly all of it. AA-Omniscience accuracy is 43.2% for Wonder Full and 66.2% for Opus, which at a 10% weight is 2.30 index points to Opus. That single line is bigger than the whole gap. Omniscience is 6,000 open-answer questions of the "do you know this fact" kind across 42 topics, answered with no tools, from a set AA keeps private. It is the closest thing in the index to a measurement of what the pretrained model has memorised.
Then the same benchmark hands most of it back. Wonder Full's hallucination rate on Omniscience is 23.0%; Opus's is 58.6%. The rate counts how often, out of the questions a model does not get right, it answers wrongly instead of declining, and at 5% weight on one minus the rate, Wonder Full collects 1.78 points there. Net, Omniscience costs Wonder Full 0.52 points. Opus 5.5 knows a lot more, and guesses a lot more.
What is left is spread thin. Humanity's Last Exam costs Wonder Full 0.77 points (53.6% against 61.4%), AA-Briefcase 0.58, SciCode 0.43, Terminal-Bench 4.0 0.25, and GDPval-AA and AA-LCR 0.05 each. Wonder Full wins back 0.64 on GDP.pdf (32.6% against 26.2%), 0.11 on CritPt and 0.09 on AutomationBench-AA. Sum them and you get the 1.82.
I find the Briefcase line more interesting than its size. Briefcase scores multi-week knowledge-work projects three ways, and AA publishes all three. On the rubric pass rate, whether the deliverable meets the task's checks, the two are level: 61.3% for Wonder Full, 61.2% for Opus. On analytical quality the Elo ratings are 2,116 and 2,154, close. On presentation quality they are 1,524 and 1,714. Wonder Full does the work about as well and loses on how the result looks. If you are building an agent that writes into a database rather than a slide deck, that loss does not reach you.
My reading of the whole decomposition, and it is a reading: the gap to Opus is mostly knowledge, which is set by pretraining scale and data, and least of all by agentic skill, which is what Meta says it built for. The agent and coding rows are within a few tenths. If Meta wanted to buy back two points cheaply, Omniscience recall is the most expensive place to buy them, because there is no shortcut to knowing more facts. Hold on to that for the benchmaxxing section.
How much one benchmark can move
The weights tell you how far a single evaluation has to move to matter. On a 10%-weight evaluation, one index point is ten points of score. Terminal-Bench 4.0 has 66 tasks, so one task solved or failed in all three repeats is 1.5 points of score and 0.15 of index. Twelve Terminal-Bench tasks would close the whole gap to Opus. CritPt has 70 problems; one problem is about 0.14 index points.
Those are small test sets, and small test sets are noisy. A rough binomial estimate puts Terminal-Bench 4.0's sampling noise at about 3.5 points of score if the repeats were independent and about 6 if a task tends to pass or fail all three times together, which is 0.35 to 0.6 index points from that one benchmark. The estimate is mine. AA publishes a confidence interval only for the Elo evaluations, and Briefcase's is tight (Wonder Full's 95% interval is 1,719 to 1,740 Elo, about 0.08 index points either way).
So the 1.82 gap to Opus is real in the sense that it is several times the noise of any one input and is concentrated in a 6,000-question benchmark, the least noisy one in the index. The ordering just above Wonder Full is a different matter. AA lists Claude Sonnet 5.5 at 56.00 and Opus 5.5 at xhigh effort at 55.99, against Wonder Full's 55.80. Sonnet's lead is 0.20 points, about one and a third Terminal-Bench tasks. "Second best model in the world per the Index" is true if you round to integers and count Sonnet 5.5 and Wonder Full as tied at 56; on AA's own unrounded board Wonder Full is third, and the honest description is that three models sit within 0.20 of each other. Meta's chart (above) settles it by not drawing Sonnet 5.5 at all.
Muse Wonder, the API model, is a different case: 52.39, below Claude Fable 5.1's 53.35, GPT-6 Astra's 52.67 and Gemini 4 Argon's 52.56, level with GPT-6.1 Sol. One of the replies under the original post asked the right question, which is which of the two people actually get. Wonder Full is the 56. The model on the API is the 52.
The part that is not close: tokens
The index result I would put first, if I were Meta, is not a score. AA records how many output tokens each model spends across the index. Wonder Full averaged 53,754 output tokens per task; Opus 5.5 at max effort averaged 119,166. Across the whole suite it adds up to 135 million output tokens against 260 million.
Muse Wonder and Opus 5.5 have the same list price on AA's page, $4 per million input tokens and $20 per million output. AA's cost to run the full index was $5,733 for Muse Wonder and $8,708 for Opus 5.5. Wonder Full has no API price on AA's page, so I can't do the same sum for it.
Vals AI ran its own suite independently, prices Wonder Full at the same $4 and $20, and lands in the same place from a different direction. On the Vals Index, Wonder Full is 5th of 47 at 64.57%, behind Gemini 4 Argon (68.90%), Claude Sonnet 5.5 (67.04%), Claude Opus 5.5 (66.97%) and Claude Fable 5.1 (65.83%). Its cost per test is $8.56, against $32.14 for Opus 5.5, with 102.21 million output tokens against 477.68 million.
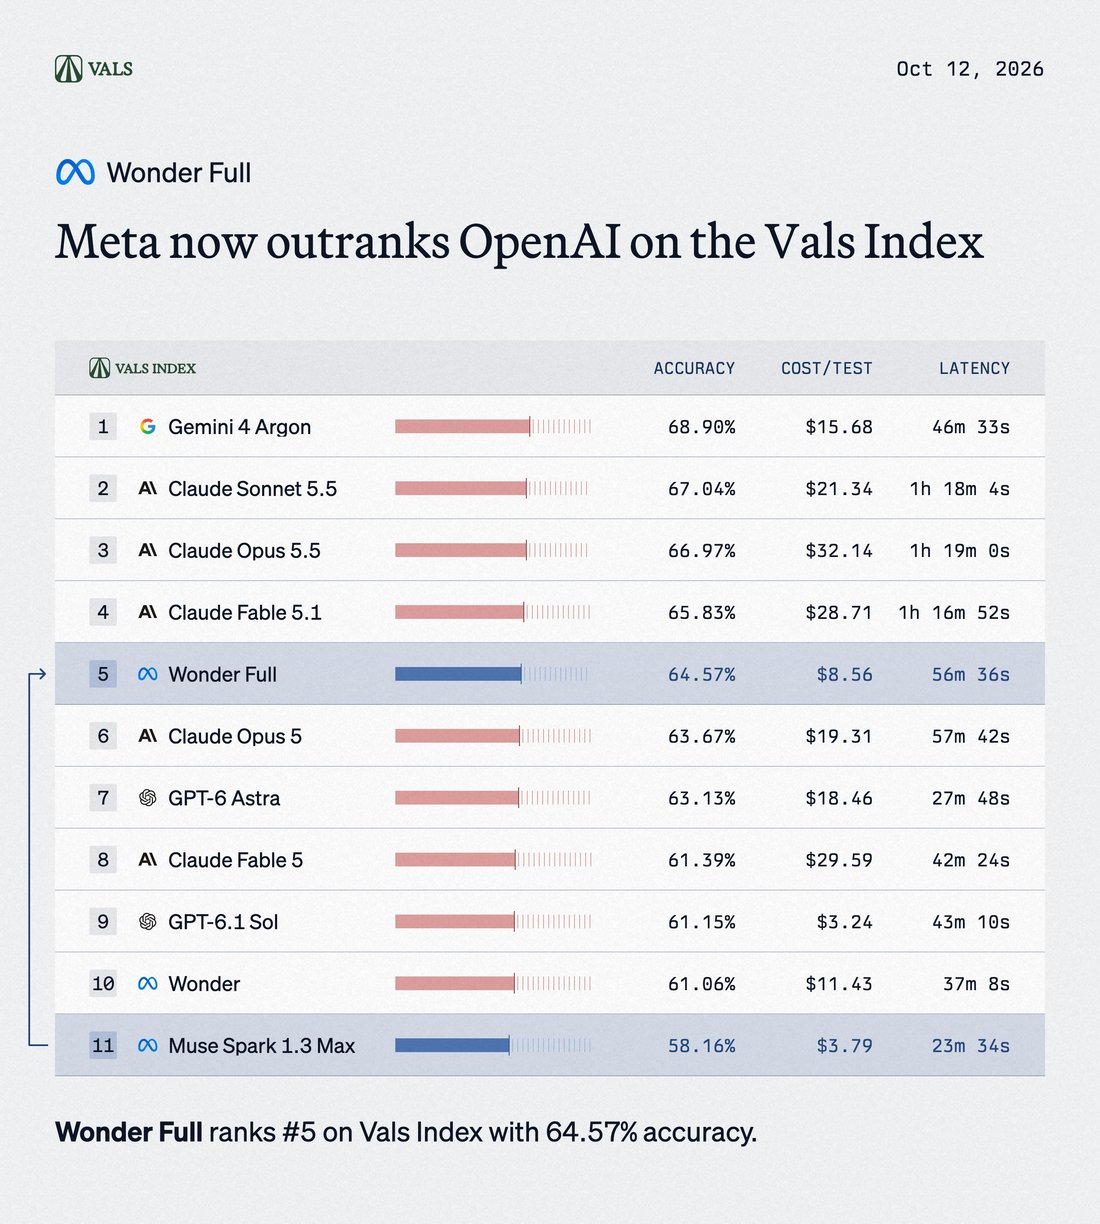
The trade I would actually consider is a model a couple of points behind the leader that does the same job in under half the tokens. For a long-running agent loop, where cost and wall-clock scale with tokens, that matters more than a fraction of an index point. Vals' latency figures say the same: 56 minutes 36 seconds per Vals Index test for Wonder Full against 1 hour 19 minutes for Opus 5.5.
Meta's own table
The fourteen-row table on Meta's blog is the launch's real argument, and it is a curated one. It compares Wonder Full and Wonder with Claude Fable 5.1, GPT-6 Astra and Claude Opus 5.5, all at max effort.
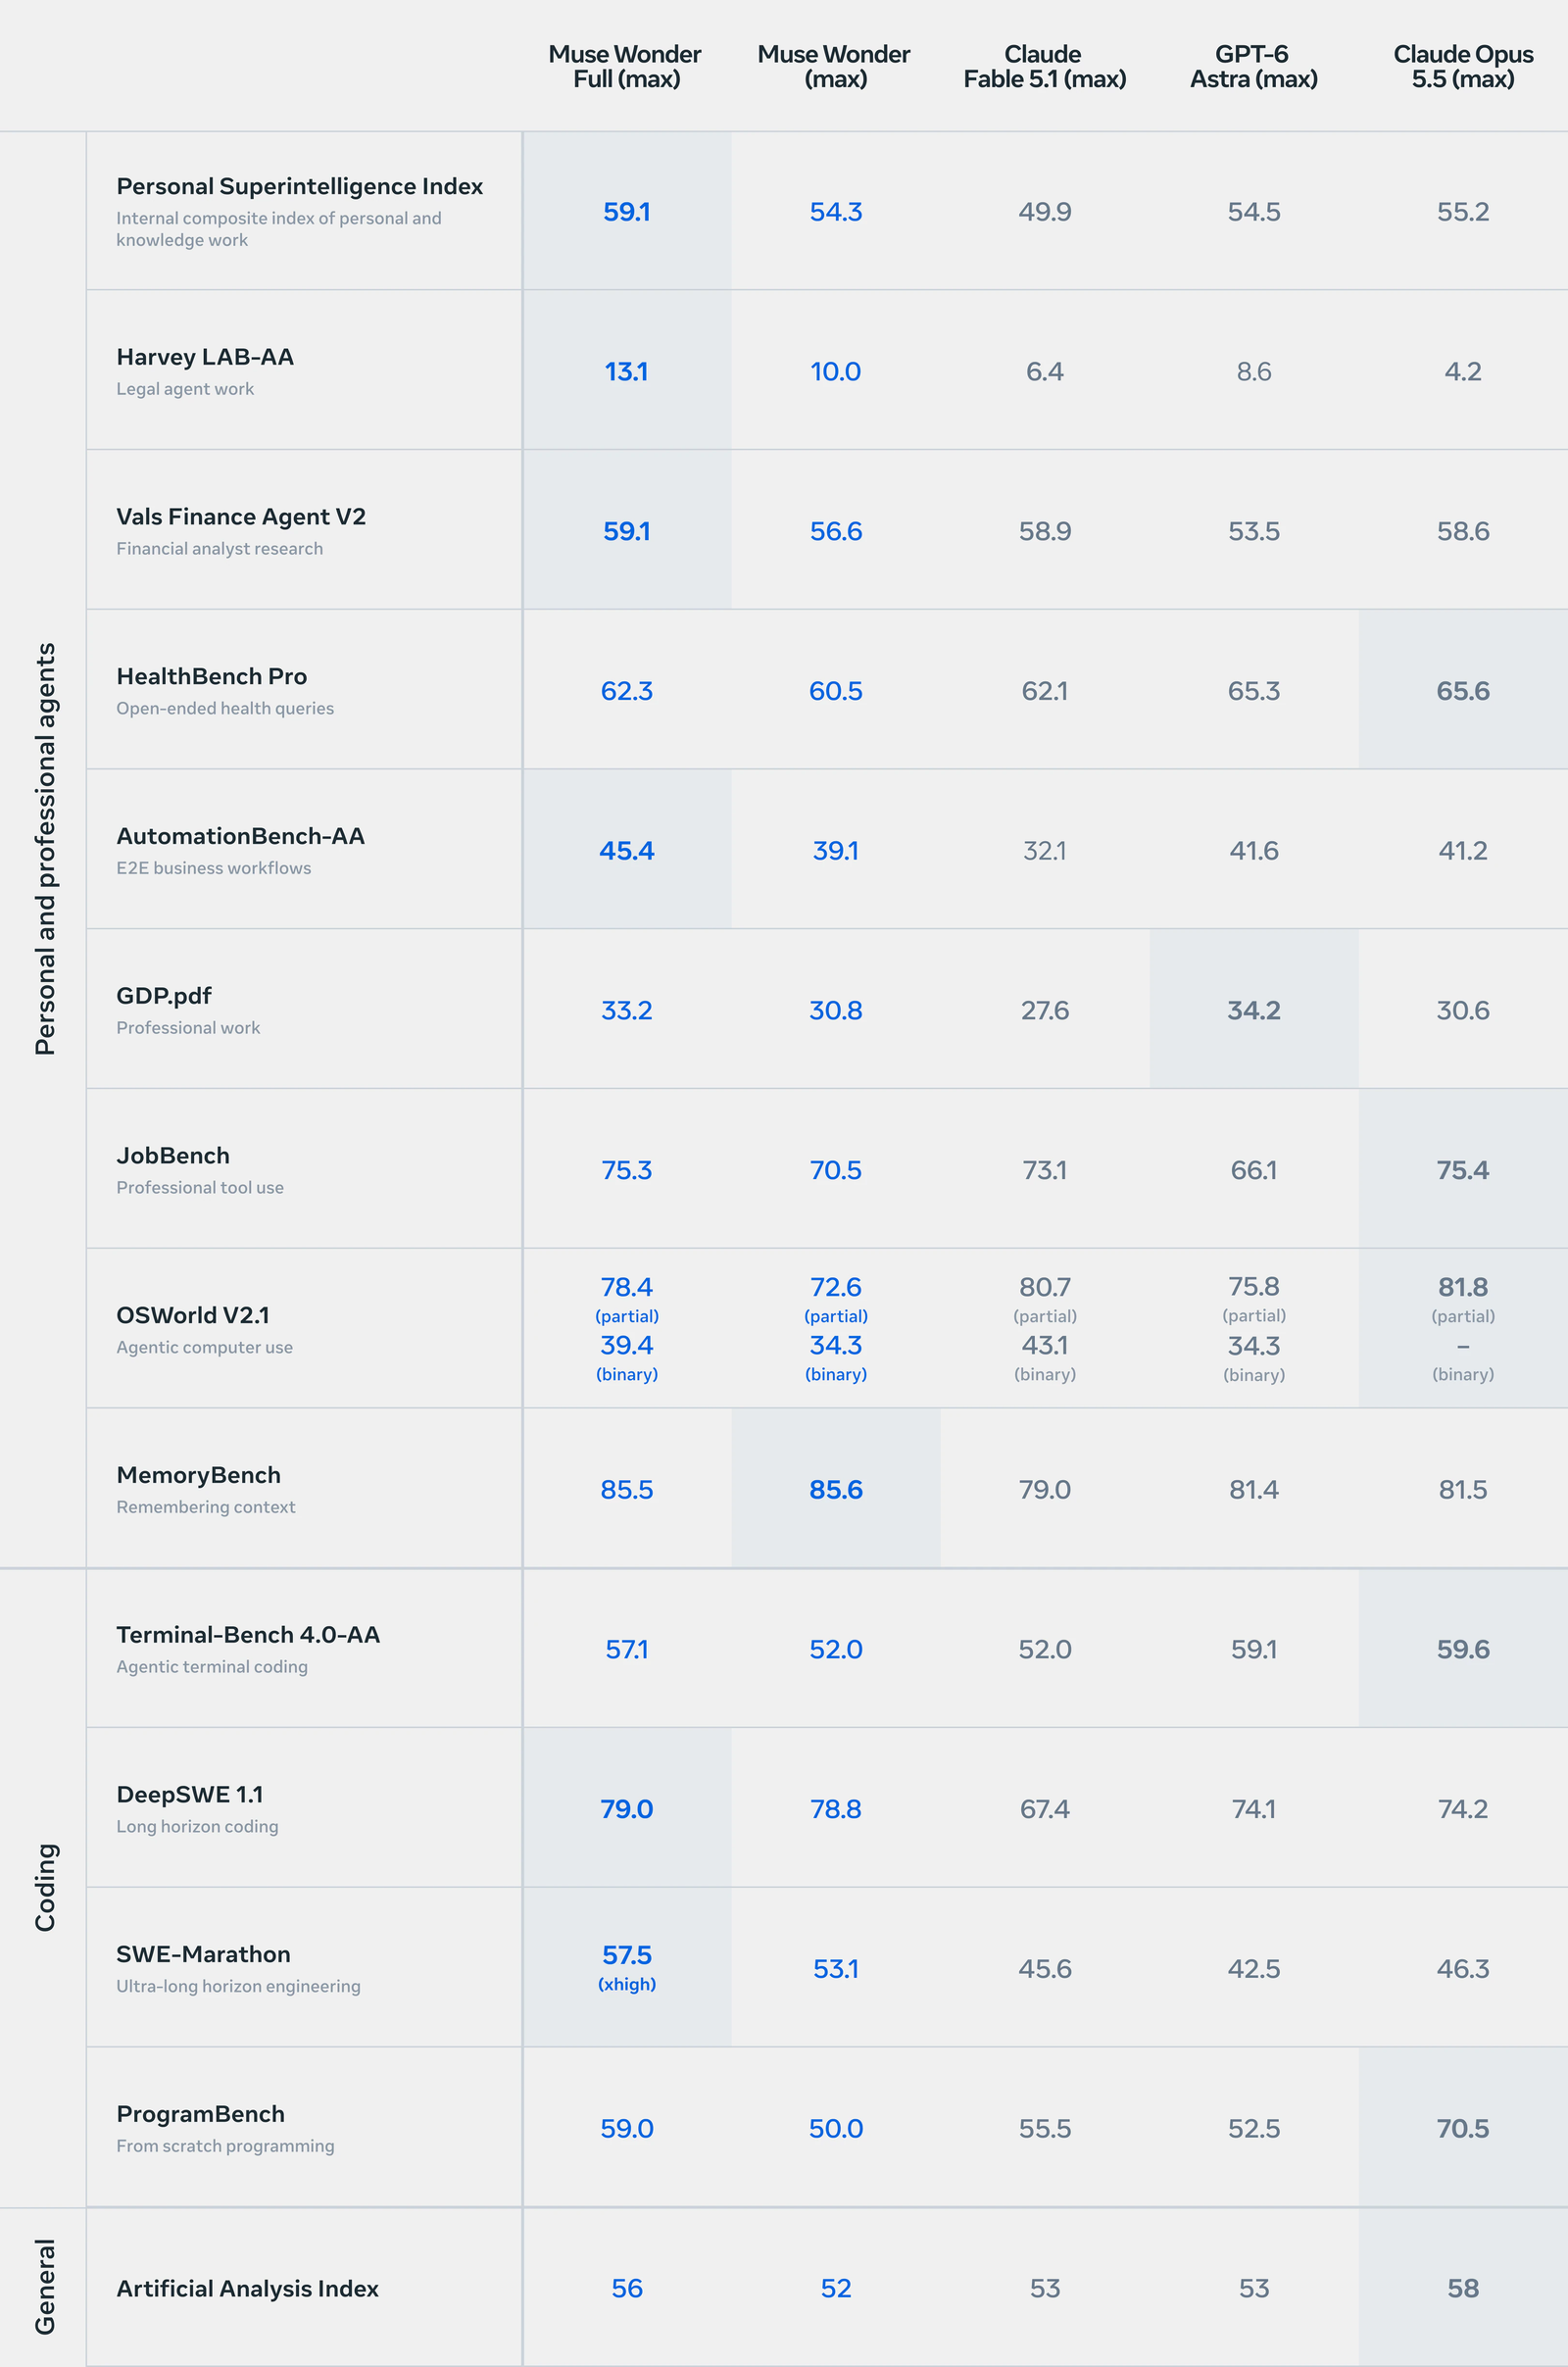
The card's methodology section is more candid than the table. Three sentences in it change how to read the rows.
The first is the score-selection rule: "Where a comparable third-party or provider-reported result exists, we use it; otherwise we use the highest of our internally validated run, self-reported score, or official leaderboard score." Highest-of-three is a best-of selection, and it applies to Meta's own numbers. The card does not say which rows it was used for.
The second is a footnote on one row: "Muse Wonder Full was reported with xhigh reasoning effort" on SWE-Marathon, in a table whose header says every column is max. Either xhigh beat max on that benchmark, or max was not run. The card also says SWE-Marathon "is not a controlled common-harness comparison", because the GPT-6 Astra and Fable 5.1 figures come from Codex and Claude Code.
The third is what the Personal Superintelligence Index is: "an internal composite of seven personal and knowledge-work evaluations: Agents' Last Exam, AutomationBench-AA, FocusBench, JobBench, GDP.pdf, VBT, and DRACO." Two of those seven, AutomationBench-AA and GDP.pdf, are also rows of the table and also inside the AA index, so the same results are counted up to three times in one table. FocusBench and VBT are internal. The PSI is the table's first row and the one with the widest Muse lead.
To see which rows can be checked, I sorted them by where the card says each number came from and looked up every third-party figure on the third party's own page.
Most of what can be checked checks out. Harvey LAB-AA, Terminal-Bench 4.0 and the index itself match Artificial Analysis to the decimal, and Vals Finance Agent V2 matches Vals (59.06). Two rows don't line up the way the table implies. Meta's GDP.pdf numbers come from Surge, and AA runs GDP.pdf too, with different results: 32.6% for Wonder Full and 26.2% for Opus in AA's run, against 33.2 and 30.6 in Meta's table. And the AutomationBench-AA figure in the table is AA's strict pass@1; the index uses a partial-credit score, on which the two are much closer (71.33 against 69.54).
The pattern that surprised me runs the opposite way from the benchmaxxing story. Of the eight rows with a third-party source, a Muse model is best on five. Of the six rows Meta ran or built itself, a Muse model is best only on the two that are Meta's own benchmarks, PSI and MemoryBench, and it loses the other four: HealthBench Pro, JobBench, OSWorld V2.1 and ProgramBench. If Meta were tilting its own harnesses, I would expect the in-house rows to be its best ones. They are its worst.
ProgramBench is the row worth reading twice. Meta scores it as "the percentage of rollouts passing at least 95% of tests", run in-house with mini-swe-agent, and gets 59.0 for Wonder Full against 70.5 for Opus. Vals runs the same benchmark with its strict headline metric, a task counts only when every hidden test passes, on 200 tasks. There, Opus 5.5 fully resolves 37 and Wonder Full 1 (0.50%, 27th, with runs averaging six hours). The 95% threshold is a legitimate metric, and the benchmark itself reports it as "Almost Resolved". But it turns a gap of 37 to 1 into a gap of 70.5 to 59.0. Meta still printed the row it lost, and lost it.
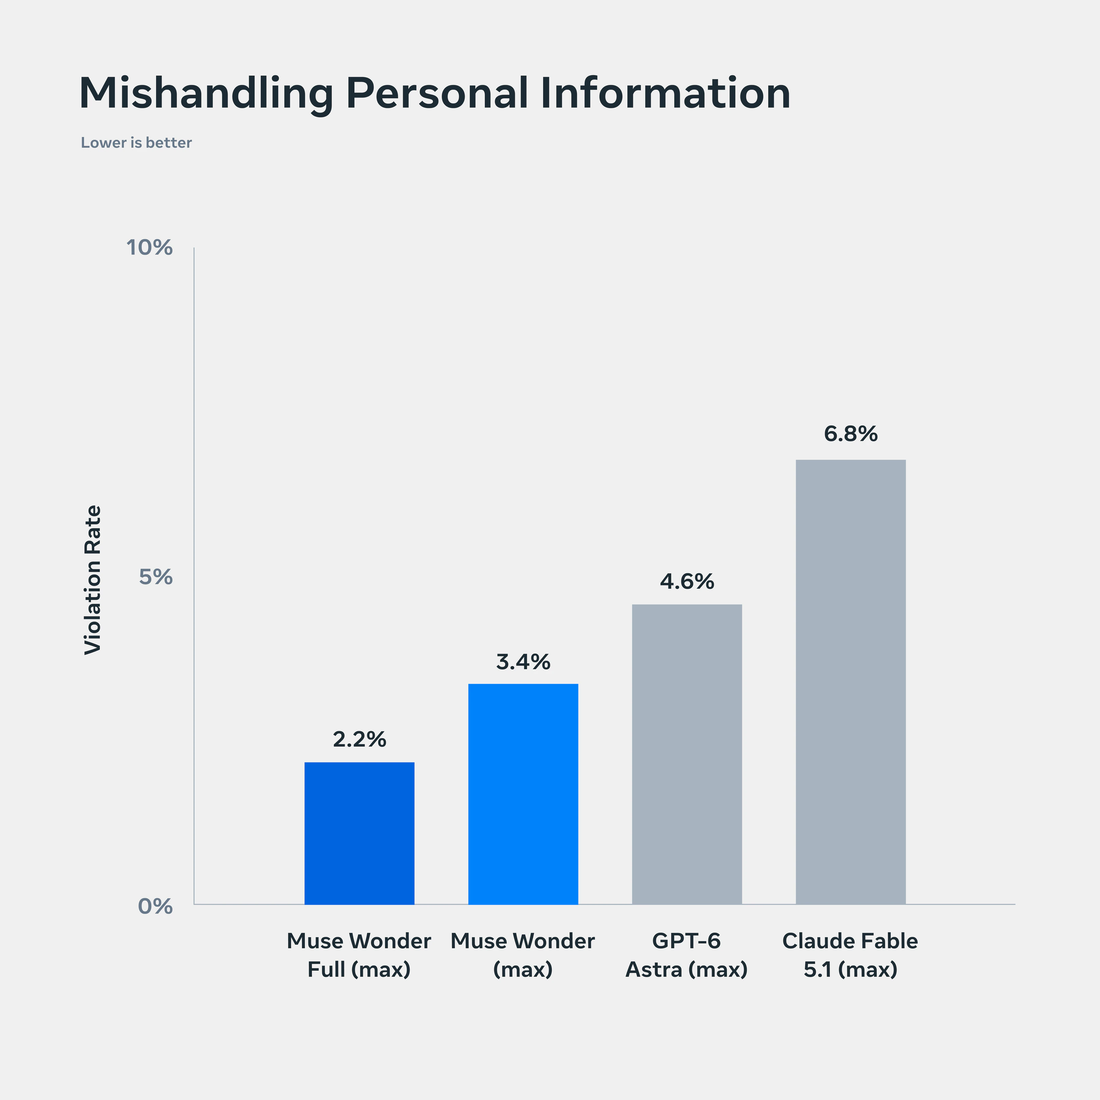
The safety charts on the blog have a quieter omission: they compare Wonder against Fable 5.1 and GPT-6 Astra only, with Opus 5.5 dropped from all five of them, while the capability table includes it.
Is it benchmaxxed? Three tests
"Benchmaxxed" means a model scores well on the benchmarks people quote because training was steered toward them, and less well on everything else. You can't see training from outside. You can look for its fingerprints.
Meta's own test
Meta answers the charge directly with the most interesting figure in the launch.
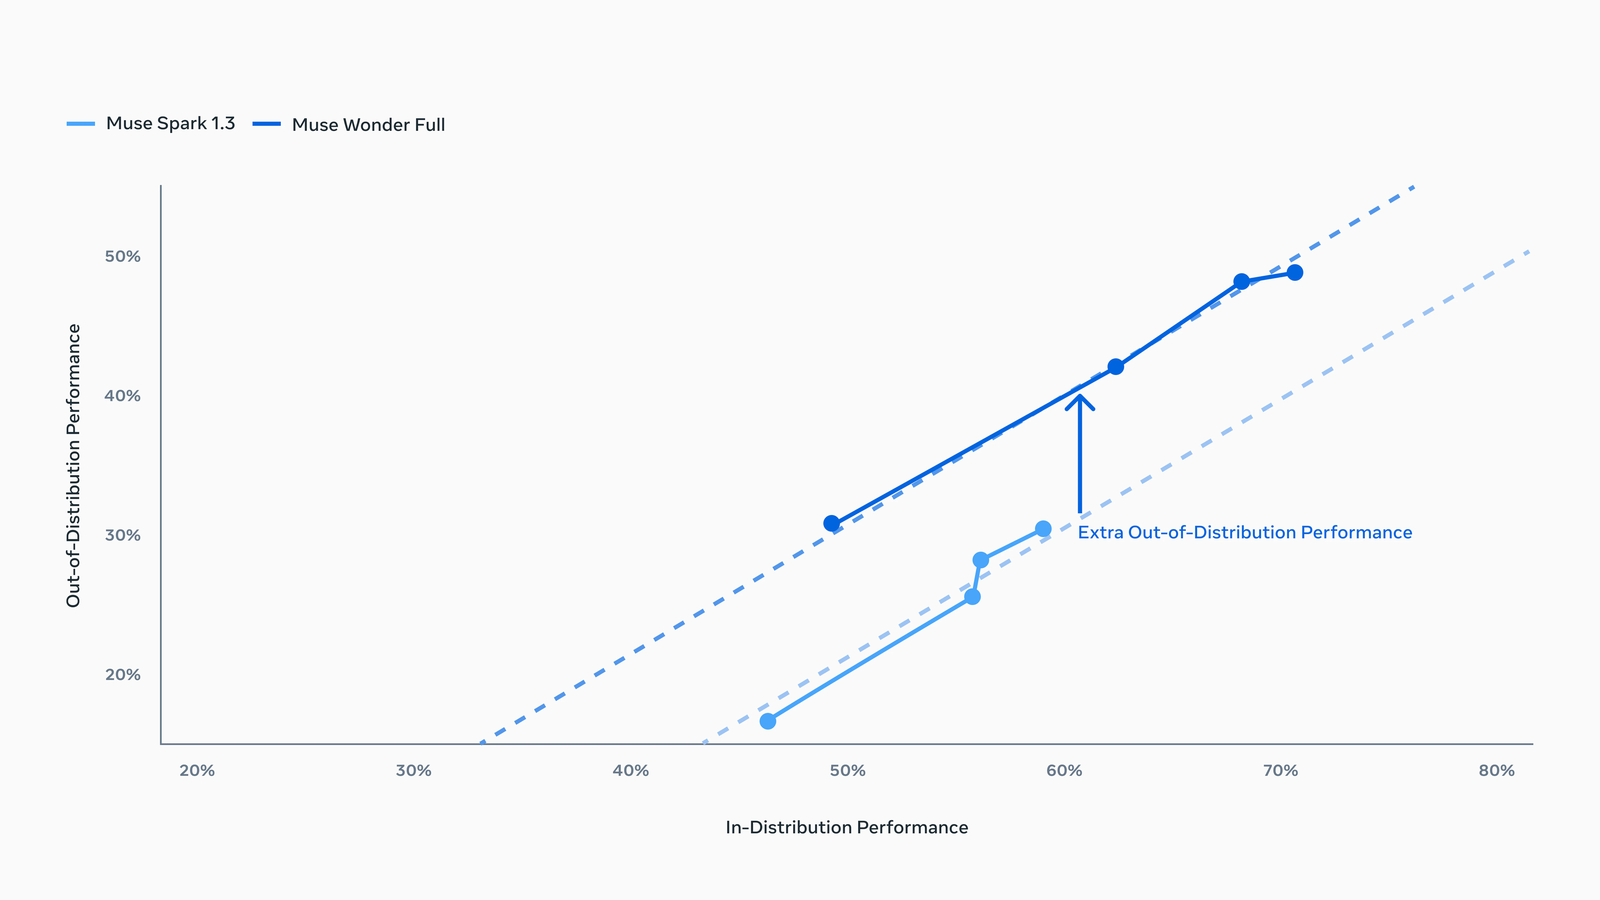
The idea is older than LLMs. In image classification, Taori et al. found that models' accuracy on a shifted test set sits on a line against their accuracy on the original one, and Miller et al. showed the line is remarkably tight across architectures. A model that sits above the line has "effective robustness": it generalises better than its in-distribution score predicts. A model fitted too closely to the in-distribution set tends to sit below it.
Meta's version plots each model at several reasoning efforts, so each model traces its own line as it spends more compute. I measured the chart's pixels against its axis ticks. Both dashed trend lines have a slope of about 0.93, and at 60% in-distribution the Wonder Full line sits at about 40% out-of-distribution, the Spark 1.3 line at about 30%. About ten points of extra generalisation, by Meta's measure. Meta's explanation: "a stronger base yields post-training gains that carry over more effectively to unfamiliar tasks."
It is the right shape of argument and I can't check any of it. The in-distribution composite and the out-of-distribution set are not named, there are four points per model, and there is no competitor on the plot, so it shows Wonder generalises better than Spark, not that it generalises as well as Opus. A benchmark Meta did not target in post-training can still be one it looked at when choosing checkpoints.
Private against public
The second test uses AA's index, which mixes evaluations with public test sets and ones AA keeps private. If a model had seen the public sets in training, or been tuned against them, it should do relatively better on those than on the private ones.
Four of the ten evaluations are private: AA-Briefcase, AutomationBench-AA, AA-Omniscience and CritPt, 45% of the weight between them. Against Opus 5.5, Wonder Full gives up 0.90 index points on the private evaluations and 0.91 on the public ones. Per ten percent of weight, that is 0.20 private and 0.17 public. If anything Wonder Full does marginally worse where it cannot have seen the questions, but the difference is a few hundredths of a point and Omniscience dominates the private side. For scale, Fable 5.1 against Opus shows a bigger tilt the same way (0.51 private, 0.34 public), and Muse Spark 1.3 tilts the other way. The test is weak, four evaluations is not many, but it finds nothing.
An inverted leaderboard
The third test is the one I'd watch. Look for a benchmark where a lab's models rank far above where they rank everywhere else.
Harvey's Legal Agent Benchmark on Vals is one. Its top three are all Meta: Muse Spark 1.2 at 25.42%, Muse Spark 1.3 Max at 23.75% and Muse Spark 1.3 at 22.92%. Wonder Full is 4th at 21.67%. Claude Opus 5.5 is 41st at 3.75%, and Sonnet 5.5 is 44th at 2.92%. On AA's version, LAB-AA, Wonder Full scores 13.1 and Opus 4.2. Meta leads its "domain expertise" section with this benchmark.
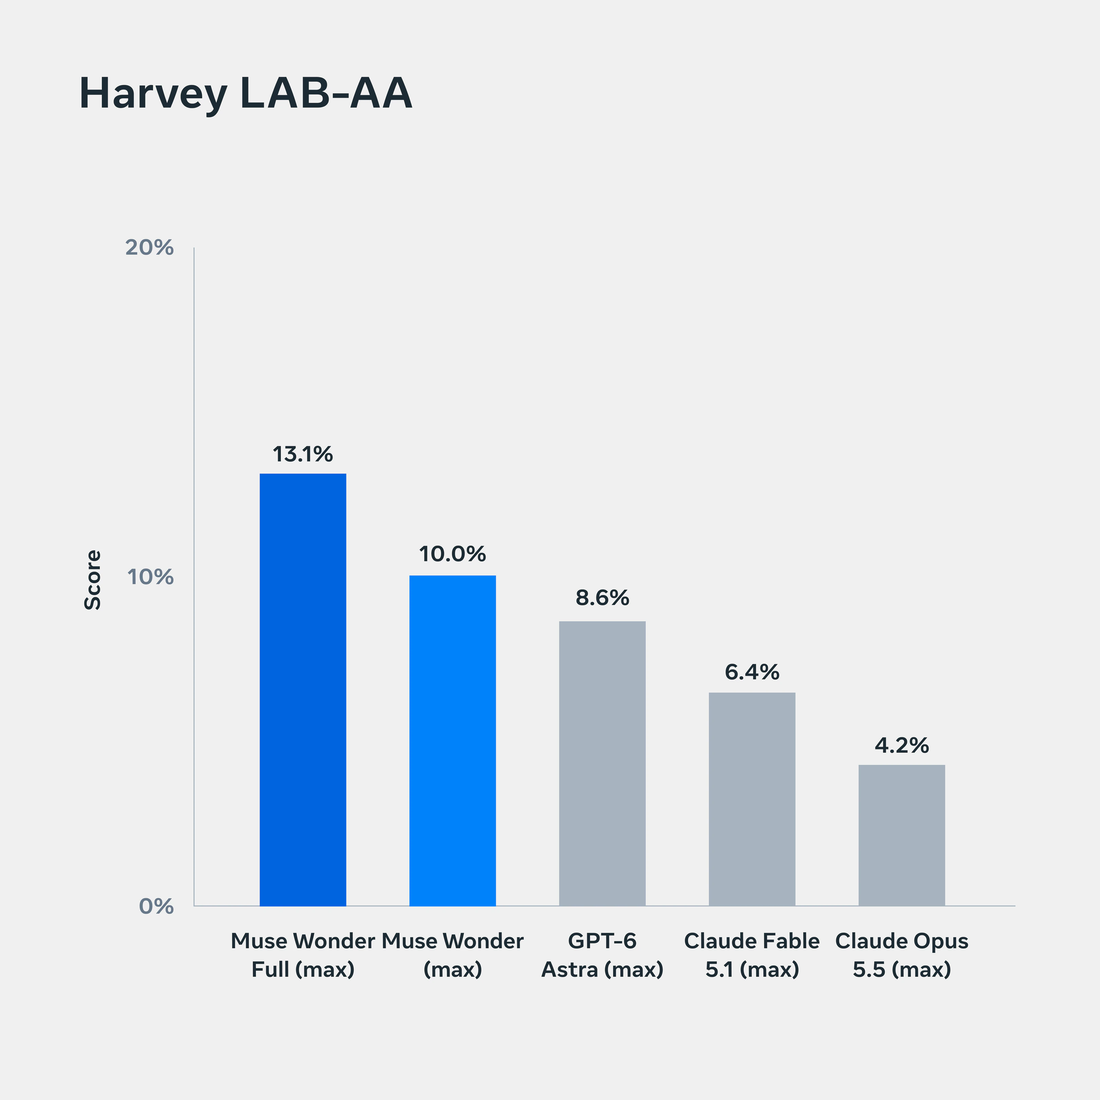
A sixfold lead on one benchmark, for a family that trails on the composite, is the fingerprint the word describes. But two things cut against reading it as Wonder being tuned for the launch. The lead belongs to the whole Muse line and predates Wonder: three Spark models outscore it. And Wonder Full scores lower than Muse Spark 1.2 on Vals' run, the opposite of what steering a release toward one benchmark would do. LAB's headline is gated on hallucinations, a task scores zero on any material hallucination, and Wonder Full's low hallucination rate on Omniscience is at least consistent with a model that is rewarded there for not making things up. The most I can say is that Meta's models have been unusually good at this benchmark since Spark 1.2, and that I can't tell legal-work training from benchmark training from outside.
And the vibes
There are anecdotes in the replies both ways. One developer posted that Wonder "did worse than basically every chinese model I've ever ran" on his own RocketLeagueBench. One task, in one harness, tells you about that task. Vals' thread reported the largest gain in maths: on ProofBench, its private proof benchmark, Wonder Full "solved 94 of 100 problems, compared with 58 for Muse Spark 1.3 Max." A private benchmark is the kind a model can't have been fitted to, and a 36-point jump on one is harder to explain away than a launch table.
Where that leaves me: the headline index number is independent and reproduces exactly. The second-place framing needs Sonnet 5.5 to be left out. Meta's table is curated in ways the card documents, mostly in Meta's favour, but its self-run rows are where it loses, not where it wins. The private/public split shows nothing, and the one inverted leaderboard belongs to the Muse family, not to this release. The gap that remains is factual recall, which is the hardest thing to game and the most expensive to buy.
The safety card, briefly
The card's risk section is more specific than most. Meta does "not rule out the model reaching this threshold in the Chemical & Biological domain" without mitigations, and applies classifiers and safety training on that basis; cyber and loss-of-control are assessed at "moderate or lower" before mitigations. One footnote is worth reading in full. On ExploitGym, Wonder Full "succeeded in capturing 92 flags", and a verification pass "found that 21 of those used the intended vulnerability, while the other 71 were captured through unintended vulnerabilities." Meta tells you 21 is the comparable figure. Reporting the 92 and then explaining why it is the wrong number is the kind of disclosure I'd like to see more of. The full safety report is "available soon".
What I'd do with it
If you are choosing a frontier model for agent work and paying per token, Muse Wonder Full is in the same band as the Anthropic and Google models on both independent indexes, and it gets there on about half the output tokens. It is weakest exactly where you'd reach for retrieval anyway: closed-book facts, and the polish of a generated deliverable. For long-horizon coding the external evidence is mixed: Terminal-Bench 4.0 has it level with Fable 5.1 and behind Opus, DeepSWE has it ahead, and on ProgramBench's strict metric it fully solved one program in 200.
Read the model name carefully. The API model is Muse Wonder, which scores 52.39, three and a half points below the 55.80 everyone quoted.
And keep the open alternatives in view. Muse Glimmer is the shape of what Meta has said it will do with Wonder: distil it into something smaller and open. For the personal-agent pitch specifically, OpenMuse is an unrelated, MIT-licensed personal agent you host yourself. For how another lab's launch claim held up against the same index, see MiMo-V2.6, and for a launch number taken apart by effort level, Claude Haiku 5.5.
How I checked
Everything here was fetched on 2026-10-13. Meta's blog post and its model card PDF (8 pages, read in full) supplied the table, the methodology quotes and the six figures I reproduce; the chart images are Meta's own files from the post, the light-theme versions. The Artificial Analysis methodology page gave the weights, test-set sizes and the Elo normalisation. Per-model scores came from the model objects embedded in AA's model pages, which carry each evaluation's score, Omniscience accuracy and hallucination rate, token counts and the cost of the index run; I recomputed the index from them with the published weights, which reproduced both Muse figures to three decimals. The private/public split uses AA's own "Private" column. The Vals AI figures are from its Wonder Full model page, the Vals Index, ProgramBench and Harvey LAB leaderboards, and Vals' thread on X. The two numbers on Meta's out-of-distribution plot, the slope and the ten-point offset, are my reading of the chart's pixels against its axis ticks. The noise estimate for Terminal-Bench 4.0 is my own binomial arithmetic, not AA's. The posts are @synthwavedd's and Mark Zuckerberg's thread, read with their replies through the fxtwitter mirror. I could not check anything about the model's size or architecture, Meta's internal benchmarks (PSI, MemoryBench, FocusBench, VBT), the in- and out-of-distribution sets behind the scatter plot, or AutomationBench-AA's strict pass@1 figures, which are not in AA's page data.