2026-10-23 · 20 min · benchmarks · agents · 3d · vision-language-models · geometry · robotics
A 1:53 narrated explainer, drawn in code. Every number and picture in it is this article's own; the sources are below.
› transcript
Hi, I'm Ratline! SpatialScout drops an agent into a room it has never seen and asks for a map. Here's how that map is graded. The agent submits one centre per object. The scorer slides the true box onto that point and measures the overlap. The agent gets object IDs and categories, and one image. No positions. It moves a calibrated camera and captures new views, up to a hundred. For depth, it marks one feature in two views, and the tool intersects the rays. It submits a centre per object, and revises as it explores. Only afterwards does the scorer compare the map with the truth. Same size boxes, one axis. Shift a box of side L by d, and L minus d still overlaps. Together they span L plus d. So above zero point nine needs an offset under a nineteenth of the side. For a thin painting, a millimetre or two. I ran the released scorer on maps I built. Five centimetres of noise everywhere scores about thirty seven percent. The best agent scores about forty two. The authors read forty runs. Six succeeded. Most failed runs stopped before finding everything. Many submitted a wrong point though the rays met cleanly. Some kept points the tool had flagged. One catch. In the released code, a perfect map with chairs filed under each other's IDs scores seventy nine percent. A low residual proves the rays met. Not that they met on the object's centre. Drive the camera and triangulate. The true box slides onto each point. The best agent lands a few centimetres off. Every source is in the full article. I'm Ratline. Bye!
Why read this
Hightop 30%Runs SpatialScout's own scorer on 80 scenes of built maps to turn IoU into centimetres, and finds where the released code and the paper disagree.
- Original analysis
- A lasting reference
- A new technique
3D & spatialAPI onlyNo licencePractitioner paper
How this was scored
- Is it new?
- 2 of 3: A real new idea, method or capability
- Can I trust it?
- 2 of 3: Measures key facts from files, code or configs
- Can I run it?
- 2 of 3: Open code or weights with real limits
- Will I understand it?
- 2 of 3: Mechanism from first principles with figures
- Can I act on it?
- 2 of 3: A concrete recipe, numbers or comparison
- Will it last?
- 2 of 3: A reference for a year or more
- Does it affect many?
- 1 of 3: A specialist community
- Only here?
- 2 of 3: A teardown or measurement few others did
Score 67 of 100, ranked 180 of 607 rated articles. Each question is answered 0–3 by hand, and a 3 is rare. How articles are scored
On 22 October @HuggingPapers posted one line: "SpatialScout: Can VLM agents actively explore and map 3D scenes? A new benchmark for evaluating vision-language models on active object-level 3D mapping across 80 scenes and 3,140 objects." The thread adds the paper and the dataset. One reply asks the right question: does the score separate finding a new object from counting the same object twice? I answer that one below, with a run.
The paper is arXiv 2610.26659 (v3, 22 October 2026), from Peking University and Tianjin University. I read its HTML version, the code at commit 17b1fa6, and the Hugging Face dataset at revision 8dfdcdf. From the dataset I downloaded only the benchmark annotations: 160 JSON files plus the catalog and index, 4.6 MB. I did not download the roughly 6,000 scene asset files, and I did not run any agent, because that needs a paid model API and a simulator install. I did run the benchmark's own scorer, spatialscout/evaluation/iou.py, on maps I built from the released ground truth, on a shared 4-core cloud VM, CPU only. All 80 scenes score in about four seconds.
Labels throughout: measured means I computed it from a released file or a run, reported means it is the authors' figure, reasoned means it is my arithmetic on the other two.
- branch
- HEAD
- tests
- none found
- source
- 1.8 MB
- commit date
- 2026-10-22
by size of tracked source at this commit, file counts in brackets; docs, data and vendored trees excluded
local clone, 2026-10-23 at 17b1fa6 — branch, commit, commitDate, fileCount, hasTests, languages
Why a map and not a question
Most spatial benchmarks for vision-language models ask questions. Which object is closer? How many chairs? How far is the sofa from the door? The answers are multiple choice or a single number, so a model can guess, eliminate, or lean on priors about rooms. The paper's Table 1 lists nine comparable benchmarks. Seven score answer correctness. Two have the model build something, Theory of Space a discrete cognitive map and IR3D-Bench scene parameters from a supplied image, and neither scores 3D coordinates directly.
SpatialScout makes the output a set of 3D points. For every object in an inventory, the agent submits an estimate of its centre in metres, in one shared frame. There is no answer key to pattern-match against, and the agent has to go and look: it starts with one image and moves the camera itself. That turns spatial understanding into the job a robot would actually have, which is closer to SLAM than to VQA, minus the hard part of estimating its own pose.
The task

Each episode is one indoor scene, rendered with SAPIEN through ManiSkill3 on CPU. The agent gets:
- An inventory. A list of target IDs, each with a category and an equivalence group (
Chair,Painting,Drawer). Instances in one group are interchangeable for scoring. No positions. - A frame. Origin at the initial camera,
+xalong its first optical axis,+yto its left,+zup. Every submitted point and every pose the tools return is in this frame. - A search radius , the distance from the origin to the farthest target. Predictions beyond m are rejected.
- Ten tools.
list_entities,get_camera_pose,get_camera_intrinsics,set_camera_position,move_camera,rotate_camera,capture_image,triangulate_observations,submit_positionsandfinish_mapping. None of them reveals a target position or a score.
The budgets are 100 model calls and 100 images, the initial one included (reported). A single call may chain several tools, but it has to choose them before it sees what they return. Captures render at 512 by 512 and reach the model as JPEGs no larger than 384 pixels on a side, so every pixel the model points at has to be scaled back to the original grid before triangulation; the image message carries the conversion.
Moves are bounded: a relative translation is at most 1 m, a turn at most 180 degrees per axis, pitch is clamped to plus or minus 85 degrees, and no world coordinate may leave plus or minus 15 m (reported, Appendix A). Teleporting with set_camera_position is allowed.
Triangulation, and what it does not give you
The one geometry tool is a least-squares ray intersection. The agent marks the same physical feature at pixel in two or more captured frames. Each mark becomes a ray from the camera origin along a unit direction , and with (the projector onto the plane perpendicular to the ray) the tool returns
the point closest, in summed squared perpendicular distance, to all the rays. It refuses a query with fewer than two views, cameras less than 5 cm apart, a condition number above , or a point behind any camera. It warns when the widest ray angle is under 3 degrees, the RMS residual is over 0.1 m, or the point is outside the search radius (reported, Appendix B.1).
This is the standard textbook construction, and it is exact. The trouble is upstream of it. The tool gives you the 3D position of the pixel you marked. The target is the midpoint of the object's world-axis-aligned bounding box. A point on a chair's seat edge is not the chair's box centre, and a silhouette centre shifts between views. The task prompt and the tool description both say so. The agent must decide where on the object to click, match that exact feature in another view, and then reason from the triangulated surface point to the centre of a box it never sees. A low residual only proves the two rays meet. It does not prove they hit the same thing.
The scenes, counted
The dataset ships ground_truth.json (evaluation only) and entity_library.json (what the model sees) for each of the 80 scenes. I counted them.
| paper (Sec. 2.2) | released files (measured) | |
|---|---|---|
| scenes | 80 | 80 |
| iTHOR / RoboTHOR / ArchitecTHOR / ReplicaCAD / ProcTHOR | 32 / 12 / 10 / 6 / 30 | 24 / 12 / 8 / 6 / 30 |
| scenes with 35 / 40 targets | 12 / 68 | 12 / 68 |
| targets | "3,410" in Sec. 2.2, 3,140 elsewhere | 3,140 |
| targets in a group with more than one instance | 1,489 (43.3%) | 1,393 (44.36%) |
| target radius | 1.95 to 9.23 m | 1.954 to 9.231 m |
| targets with a side under 1 cm | 210 (6.7%) | 210 (6.69%) |
| median shortest side | 11.7 cm | 11.72 cm |
Most of it checks out. Three things do not. The paper's per-source scene counts add up to 90, not 80. The full scene_catalog.json does have 90 entries, 32 iTHOR and 10 ArchitecTHOR, and the dataset card says ten of them are development scenes outside the benchmark, so the paper quotes the catalog's breakdown as the benchmark's (reasoned). "3,410 instances" is a transposition of 3,140; 12 times 35 plus 68 times 40 is 3,140 (reasoned). And I count 1,393 targets that share a group with another instance, not 1,489; 1,489 is not 43.3% of either total, so I cannot tell which number the authors meant.
The inventory covers 209 categories (measured). Chairs (192), paintings (170), windows (94) and books (90) are the most common. One target, a poster in ithor_bedroom_307, has a bounding box exactly zero thick (measured). That matters for the metric.
The metric: a box moved to a point
The agent never submits a box, only a centre. To score that centre against object size, SpatialScout takes the reference box, translates it so its centre sits on the prediction, and measures 3D IoU against the box where it should be. If the two boxes are the same size and offset by , that is
with the side lengths and the box volume. Along a single axis it simplifies to , so IoU above 0.9 needs and above 0.5 needs (paper Eq. 8; reasoned from it). The tolerance is relative to size on every axis independently, so a thin object is unforgiving through its thin direction. At the median shortest side of 11.72 cm, the single-axis slack for IoU above 0.9 is 6.2 mm (reasoned).
Inside an equivalence group the scorer solves an assignment problem with scipy.optimize.linear_sum_assignment, so it does not matter which chair ID you put on which chair. It reports mean IoU and the share above 0, 0.5 and 0.9, each two ways: over submitted objects, and over all targets with omissions scored as zero. The two are tied by coverage , submitted over total:
(paper Eq. 6). The all-target number is the headline, and it is the honest one: a model cannot score well by submitting only the five objects it is sure of.
Try it on real boxes. The sizes are measured from the released ground truth.
Move the painting 2 mm front-to-back and it drops under 0.9. Move a sofa 2 cm sideways and it barely notices. A credit card, at 0.6 mm thick, falls to zero at a 1 mm offset unless the 1 cm floor is on. That floor is the subject of the next section.
What I ran
The released scorer takes a directory holding ground_truth.json and predictions.json. I wrote predictions from the ground truth with known damage, scored them with score_scene from the released code, and pooled the results across all 80 scenes the way Table 3 does (object-micro). Every number in this section is measured: the released scorer, the released annotations, a shared 4-core VM, CPU only, seed 0. Noise is isotropic Gaussian with the stated sigma on each axis.
| map I built | coverage | mean IoU | > 0 | > 0.5 | > 0.9 | mean centre error |
|---|---|---|---|---|---|---|
| exact centres | 100% | 99.97% | 99.97% | 99.97% | 99.97% | 0 |
| centres ±1 cm | 100% | 69.62% | 94.33% | 78.60% | 31.85% | 1.6 cm |
| centres ±2 cm | 100% | 56.42% | 87.99% | 62.93% | 13.57% | 3.2 cm |
| centres ±5 cm | 100% | 37.19% | 74.87% | 40.38% | 2.29% | 8.0 cm |
| centres ±10 cm | 100% | 23.42% | 59.71% | 20.76% | 0.48% | 16.0 cm |
| centres ±20 cm | 100% | 12.11% | 43.60% | 6.91% | 0.03% | 32.1 cm |
| ±5 cm, 10% of targets dropped | 90.19% | 33.79% | 67.42% | 37.29% | 1.53% | 8.0 cm |
| everything at the origin | 100% | 0.11% | 1.37% | 0.03% | 0 | 3.12 m |
| exact centres, IDs rotated within each group | 100% | 79.09% | 99.97% | 78.85% | 66.27% | n/a |
Four things come out of that table.
A ruler for the leaderboard. Five centimetres of per-axis noise, about 8 cm of 3D error, on every one of the 3,140 targets scores 37.19% all-target mean IoU and 2.29% above 0.9. One centimetre scores 69.62%. The metric is steep at small errors and has a long, flat tail. The origin map is the paper's own inventory-only baseline; it reports 3.113 m of full-scene loss for it (reported, Appendix B.2), against my 3.12 m mean centre error (measured, pooled rather than averaged per scene).
The exact map scores 99.97%, not 100%. The zero-thickness poster has zero volume, and the released box_iou returns 0 for it whatever you submit. The paper says the scorer floors every side at 1 cm (Appendix B.2); the code at 17b1fa6 has no floor. One target out of 3,140 is noise. But without the floor the other 209 sub-centimetre targets (credit cards, pens, phones lying flat) need sub-millimetre accuracy through their thin axis to score above 0.9.
A same-group ID swap costs 21 points in the released code. The task prompt tells the agent: "IDs within the same group are interchangeable for scoring, so submit one distinct valid ID per observed instance without worrying about their order." The paper's Appendix B.2 agrees: it moves the candidate target's box to the prediction. The released code moves the submitted ID's box. When two instances in a group have different boxes, which is true of 402 of the 470 multi-instance groups (measured), a perfect centre filed under the sibling's ID gets a wrong-sized box. I reimplemented the paper's version as described, floor and candidate box and distance assignment, and it scores the same rotated map at 100%, and the ±5 cm map at 37.21% against the code's 37.19%. So the gap is confined to ID mix-ups, but the agent has no way to avoid them: the inventory gives it IDs and categories, never sizes. I cannot tell whether Table 3 was computed with this code or with the paper's description, so I do not know whether any reported score carries this penalty.
Duplicates do not inflate the score. The reply on X asked whether counting one object twice can look like discovery. I submitted every instance of each multi-instance group at the first instance's centre: one object found, reported once per ID. Coverage reads 100%, because coverage counts submitted IDs. All-target mean IoU is 70.67% (measured), which is exactly the 2,217 distinct objects out of 3,140 (70.6%, reasoned) plus a little from duplicates that happen to overlap a neighbour. The one-to-one assignment gives each duplicate to some other instance, where it scores near zero. So coverage alone can be gamed, but the headline mean IoU cannot.
The leaderboard, against the ruler
Eight configurations of seven models, one episode per model and scene, all at xhigh reasoning effort except one GPT-6 Astra run at medium. These numbers are reported (paper Table 3).
| model | all: mean IoU | > 0 | > 0.5 | > 0.9 | submitted: mean IoU | > 0.5 | > 0.9 |
|---|---|---|---|---|---|---|---|
| Claude Opus 5.5 | 41.71 | 77.36 | 47.23 | 3.25 | 46.69 | 52.87 | 3.64 |
| GPT-6 Astra (xhigh) | 33.16 | 67.79 | 35.15 | 1.62 | 41.16 | 42.69 | 2.09 |
| Claude Sonnet 5.5 | 32.26 | 67.13 | 33.60 | 1.40 | 38.99 | 40.61 | 1.69 |
| GPT-6 Astra (medium) | 31.18 | 67.73 | 31.55 | 1.27 | 37.16 | 37.60 | 1.52 |
| GPT-6 Sol | 20.83 | 51.85 | 18.95 | 0.48 | 28.65 | 26.06 | 0.66 |
| Qwen3.8 Max | 6.80 | 24.36 | 4.52 | 0 | 12.14 | 8.07 | 0 |
| Kimi-K3 | 4.22 | 19.36 | 2.77 | 0 | 6.55 | 4.29 | 0 |
| DeepSeek V4.1 Flash | 3.48 | 19.04 | 0.92 | 0 | 5.80 | 1.54 | 0 |
Put the ruler beside it. Claude Opus 5.5's submitted objects average 46.69% IoU with 3.64% above 0.9; the full-coverage ruler gives 56.42% and 13.57% at ±2 cm, and 37.19% and 2.29% at ±5 cm. So the best agent's placements behave like per-axis noise of somewhere between two and five centimetres (reasoned; real errors are not Gaussian and not the same for every object). That fits the one centre-error figure the paper gives for a whole run: GPT-6 Astra's median is 7.08 cm (reported, Table 5), and my ±5 cm map has a median of 7.7 cm (measured) and a mean IoU of 37.19%, against Astra's 41.16% on submitted objects.
That is a more useful reading of "41.71%" than the percentage. Frontier agents can put most objects in roughly the right place in a room they had to explore. A few centimetres of error is fine for "the mug is on the counter left of the sink" and not fine for "grasp the mug".
Coverage, implied by dividing each all-target score by its submitted twin, is 89.3% for Claude Opus 5.5, 82.7% for Sonnet, 83.9% for Astra at medium, 72.7% for Sol and 56% to 64% for the open models (reasoned). Every row gives the same coverage from all four columns, to within rounding, as Eq. 6 requires. Except one. The GPT-6 Astra (xhigh) row implies 80.6%, 80.8%, 82.3% and 77.5% from its four columns (reasoned), and the paper's own prose quotes Astra's submitted-object mean as 41.76, not the table's 41.16. Some cell in that row is wrong. It does not change the ranking: Opus leads every column by a wide margin.
How agents fail
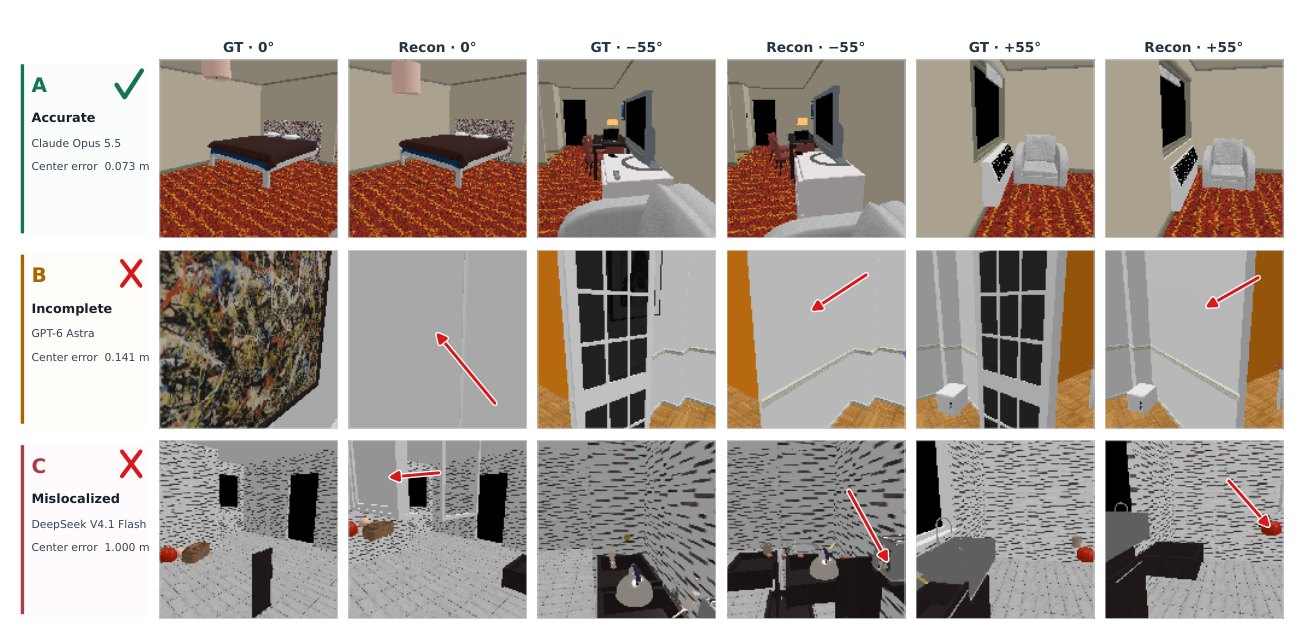
The authors read 40 trajectories, ten tasks each for GPT-6 Astra, Claude Opus 5.5, DeepSeek V4.1 Flash and Qwen3.8 Max, and counted patterns (reported, Table 4). They call an episode a success at 90% coverage and at most 0.2 m mean centre error. Six of 40 succeed. All six triangulate from many views, submit early and keep adding, and go back to refine.
Of the 34 failures:
- 26 end with incomplete coverage. Thirteen end that way while at least ten model calls remained.
- 21 submit at least one badly wrong point despite a low triangulation residual. The rays met. They met on the wrong feature, or on the right feature that the agent then mistook for the centre. This is the gap from the triangulation section, and it is the most interesting failure in the paper.
- 13 keep positions the tool had warned about.
- 6 submit many positions with no triangulation behind them, which is guessing from one view.
Table 5 makes the same point from the other side (reported). GPT-6 Astra and DeepSeek V4.1 Flash make similar numbers of tool calls. Astra triangulates before 99.33% of its submissions, 2.69% of its triangulations draw a warning, and its median centre error is 7.08 cm. DeepSeek triangulates before 63.48%, 38.65% draw a warning, and its median error is 68.17 cm, while capturing more images (39.63 per task against 32.41). Looking more did not help it. Marking corresponding pixels precisely did.
The tool-use plots (paper Figures 5 and 6) show the same split: Opus makes the most calls; Astra and Opus keep a balance of moving, looking and mapping; DeepSeek and Qwen move the camera a lot and observe and map less as the episode goes on.
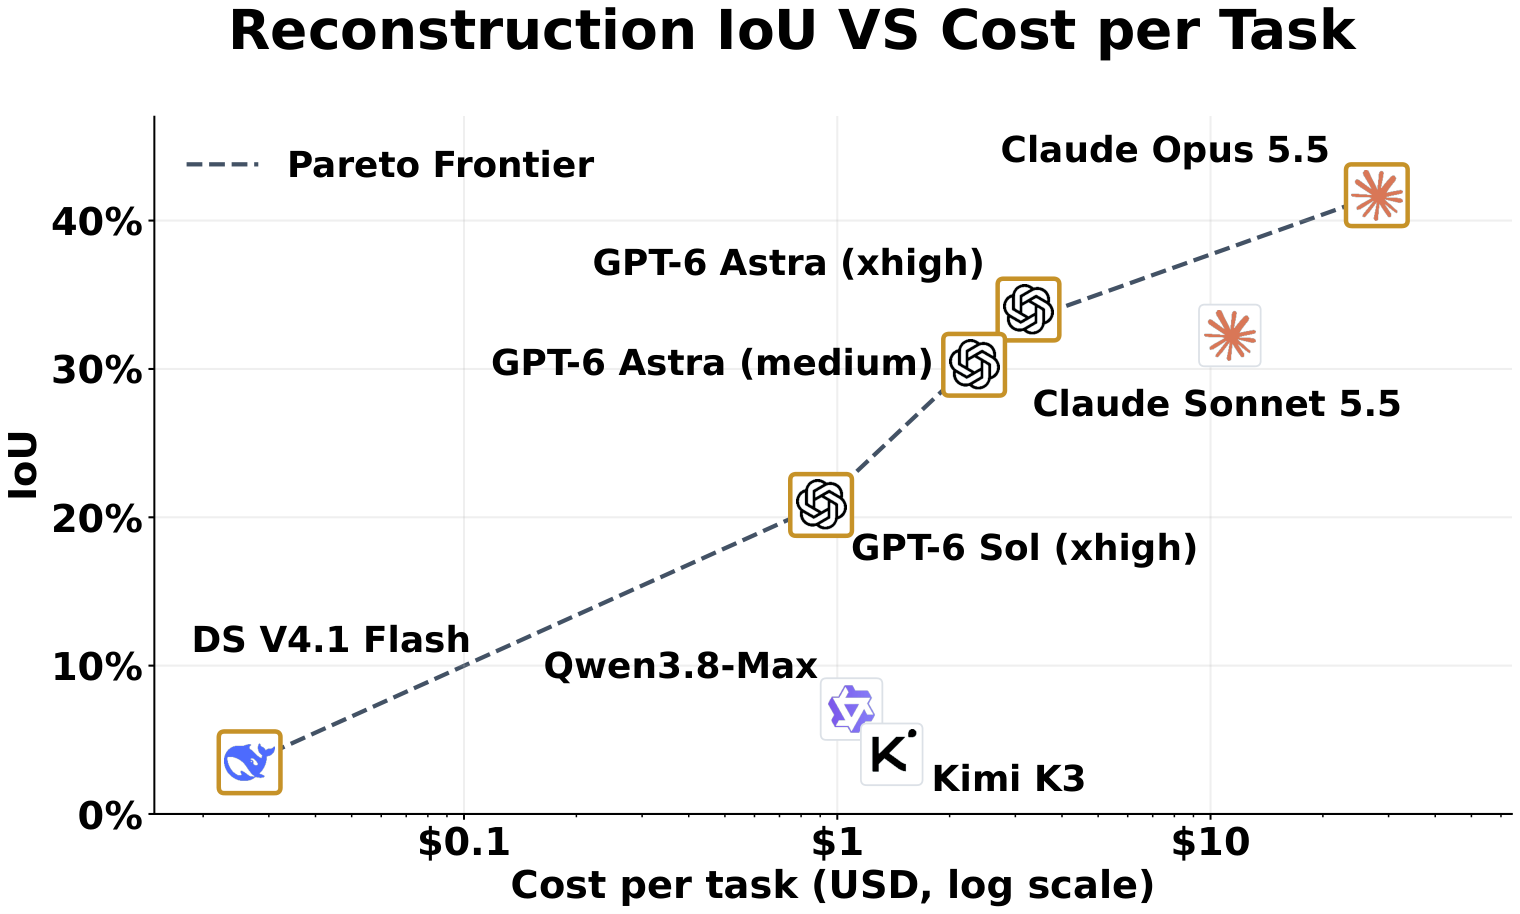
The best map is the most expensive one: $28.85 per task for Claude Opus 5.5 (reported), so about $2,300 for one pass over the 80 scenes (reasoned). GPT-6 Astra at xhigh gets about four-fifths of the score for roughly a tenth of the cost, read off the plot. The plotted Astra points sit near 34% and 30%, a little off the table's 33.16% and 31.18%, so read the axis loosely.
What the release does and does not let you check
What is open: the evaluator, the agent harness, the per-model settings in configs/model_settings.json, the scene resources and the full ground truth. That is enough to rerun any model with your own API key, and enough for me to run the scorer. The repository has no licence file, and the dataset card says no project-wide licence has been chosen; the upstream AI2-THOR, ReplicaCAD and ManiSkill3 terms still apply.
What is not: no trajectories, predictions or per-scene scores from the paper's runs. The dataset card says so explicitly. So I could not recompute Table 3, could not check the Astra row, and could not tell which scoring variant produced it. Each model ran once per scene with no repeat, so there is no variance estimate; with 3,140 targets that is fine for the gap between Opus and Astra, and not obviously fine for Astra against Sonnet, which differ by 0.9 points. The released scorer's README also counts only episodes that end in finish_mapping, while the paper says an episode that runs out of calls or stops calling tools is scored too.
Everything is simulated, rendered with a minimal shader on CPU. Appendix C says so and promises a real-world set "within the next month". Real cameras bring motion blur, rolling shutter and pose drift, and in SpatialScout the agent is handed perfect poses. The hard part this benchmark isolates is the one that remains even with perfect poses: deciding which pixel to click, matching it across views, and getting from a surface point to the centre of an object.
Where it sits
SpatialScout is the measurement end of a cluster of agentic 3D work on this site. BlenderWorld grades agents that build scenes, by sending a second agent into the .blend. SpatialLM reads a point cloud and writes the room back as boxes, with no exploration at all; SpatialScout's agent has to earn its observations. SKY-001 also scores geometry by IoU, and the lesson carries over: an IoU percentage is only interpretable once you know how fast it falls with error at the object sizes in play. For the classical side of turning many views into one consistent geometry, the 3D reconstruction roundup covers the feed-forward models that would make the triangulation tool look quaint, and 3DCodeVerse is another benchmark whose ceiling turned out to be set by its own measuring code.
The paper's question is whether VLM agents can actively explore and map a 3D scene. My answer from its numbers: roughly, yes, to a few centimetres for the objects they find, after about $29 of reasoning a room. Precisely, no. Fix the ID-swap penalty, or confirm it was not in the scored run, before reading too much into the third significant figure.