2026-09-26 · 21 min · llm · mixture-of-experts · state-space-models · pretraining · open-weights · tpu · explainer

On 2026-09-22 Mayank Mishra posted: "We pretrained a 2.3B MoE (360M active) Hybrid Mamba-2 that lands within a few points of Llama-3.2-3B using <1% of its pretraining FLOPs. No dedicated cluster. The run hopped between H100s, A100s, V100s (yes, V100s) and TPU v5p/v6e on a single codebase."
The thread under the post links a real release, by Mishra, Bharat Runwal, Ion Stoica, Tri Dao and Joseph E. Gonzalez (UC Berkeley, MIT-IBM Watson Lab, Princeton, Together AI). It has three parts:
- Weights, as three Hugging Face repositories under
open-lm-engine.rigel-baseis the 4,096-token checkpoint.rigel-base-longis the 294,912-token extension.rigel-midhas the same shapes and the long-context config, but its README is the long checkpoint's with the model id swapped, so its role is undocumented. None of the three cards declares a licence. - A technical blog, Rigel Base: Reaching Llama-3.2 Quality with <1% of its Compute, which stands in for a paper. There is no arXiv report.
- The training code,
lm-engine, Apache-2.0.
I did not run the model. Everything below comes from files: the safetensors header (read by HTTP
range request), config.json, the lm-engine source at commit a9c6e2b, and the
lm-evaluation-harness result files the blog ships inside its own chart code. Numbers are labelled
reported (the authors say so), measured (I counted it in a file), or reasoned (I computed
it, with the assumptions stated).
- task
- text-generation
- safetensors
- 1 shard
- largest file
- 4.69 GB
- files
- 7
- downloads
- 439
- likes
- 4
- languages
- en
Base model only: no chat template, no instruction tuning. config.json has an auto_map pointing at configuration_rigel.py and modeling_rigel.py, which are not in the repository; the architecture is registered by installing lm-engine and importing lm_engine.training.
repo last modified 2026-09-22
The stack: three Mamba-2 layers, then attention, ten times
Rigel has 40 layers at hidden size 1,024. Each layer is a sequence mixer followed by a feed-forward
block, both behind an RMSNorm and a residual add. config.json spells out the mixers one by one:
layers 4, 8, 12 and so on up to 40 are softmax attention, and the other 30 are Mamba-2. So the pattern
is Mamba-2, Mamba-2, Mamba-2, attention, repeated ten times.
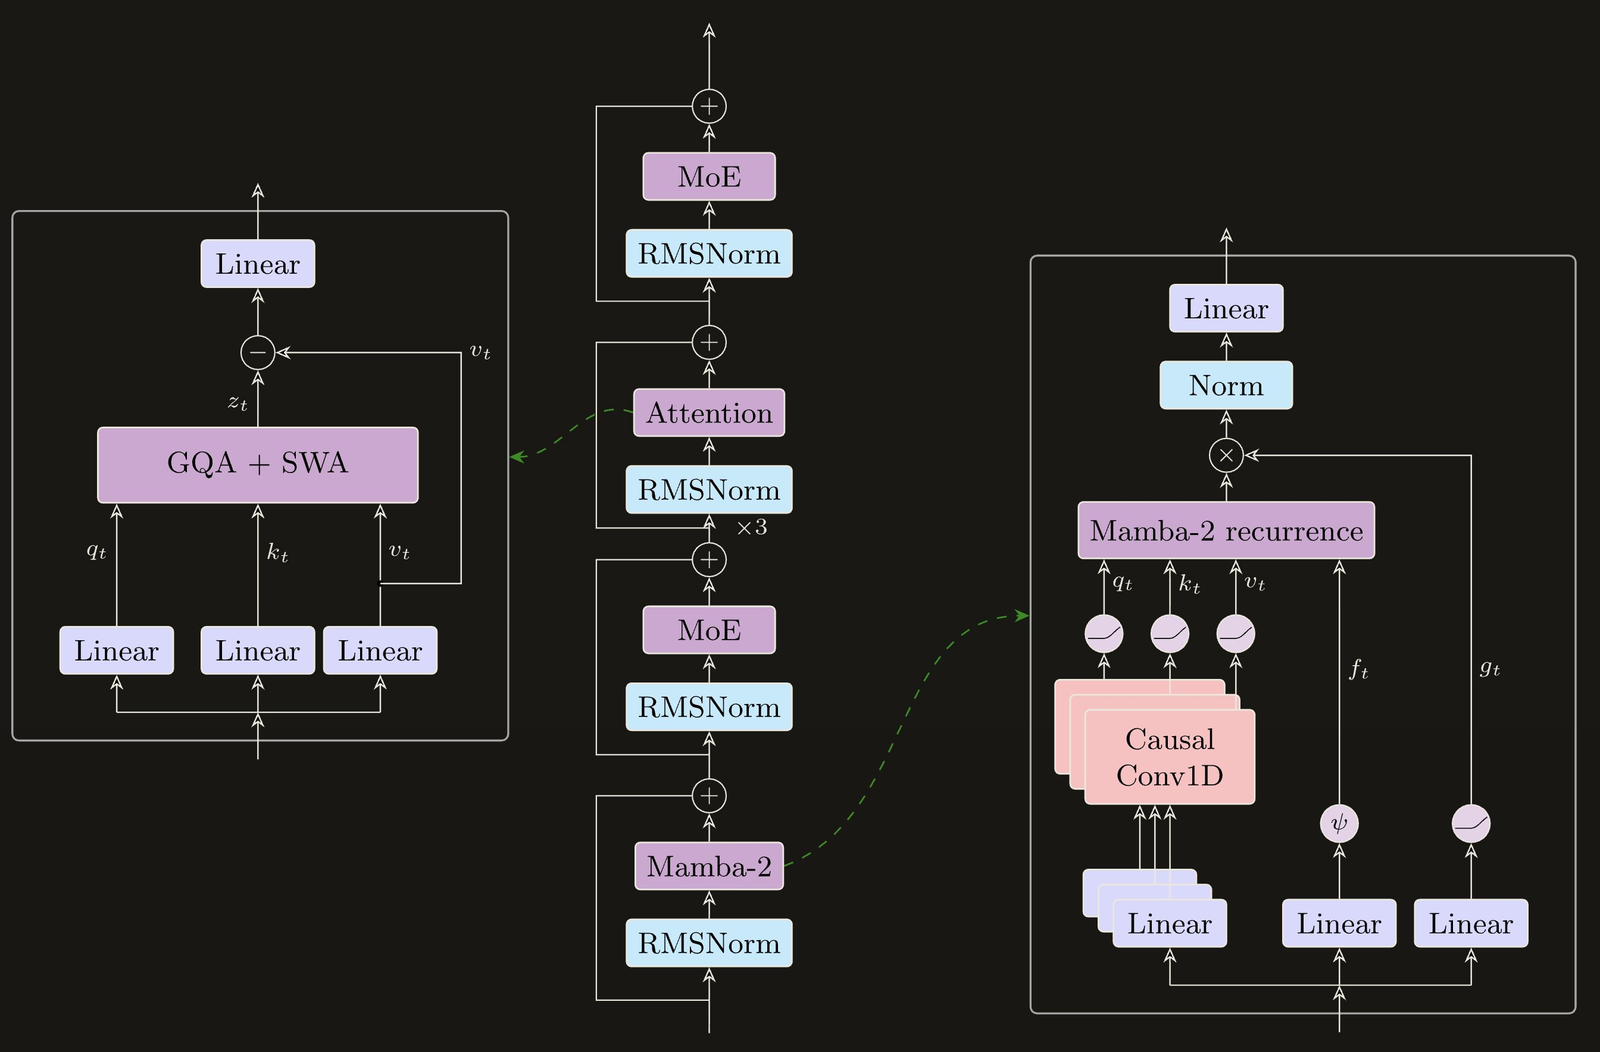
The Mamba-2 layers each have 32 heads of 64 channels, a state size of 128, one shared group for the
input and output projections (the B and C of the SSM, or k and q in attention terms), a causal
convolution of width 4, and a chunk size of 256. The attention layers have 16 query heads sharing 4
key-value heads at head dimension 64, no positional encoding at all, and XSA, which I come back to
below. In rigel-base the attention is full causal attention over the 4,096-token context. In the two
long-context repositories every attention layer carries "sliding_window": 4096.
Every feed-forward block, after both kinds of mixer, is the same fine-grained MoE: 128 SwiGLU experts with an intermediate size of only 128 each, a router that picks the top 2 and renormalizes their weights, and an auxiliary load-balancing loss at coefficient 0.001. There is no shared expert. The blog's reason is blunt: "We don't use any shared experts purely to save FLOPs." Input and output embeddings are tied, the vocabulary is 100,352 tokens, and hyperparameters were transferred across widths with μP.
Stored, the model is 86% experts. Active, the experts shrink to 31.5M because a token touches 2 of 128, and the sequence mixers become most of the per-token work: 224.2M of the 261.0M active non-embedding parameters. The bar keeps the stored total as its scale, so the active view is the slice that actually runs.
Counting 2.3B and 360M
The model.safetensors file in rigel-base starts with a 53,496-byte JSON header listing 462
tensors, all BF16. Their shapes sum to 2,345,567,552 parameters (measured). An 8-byte length
prefix, the header and two bytes per parameter come to exactly 4,691,188,608 bytes, the file size
Hugging Face reports. The other two repositories have identical shapes.
| Component | Per layer | Stored (measured) | Active per token (reasoned) |
|---|---|---|---|
| Experts, 128 per layer | 393,216 each | 2,013,265,920 | 31,457,280 (2 of 128) |
| Mamba-2 mixers, 30 layers | 6,600,032 | 198,000,960 | 198,000,960 |
| Attention mixers, 10 layers | 2,621,440 | 26,214,400 | 26,214,400 |
| Routers, 40 layers | 131,072 | 5,242,880 | 5,242,880 |
| Norms | 82,944 | 82,944 | |
| Tied embedding, 100,352 x 1,024 | 102,760,448 | 102,760,448 | |
| Total | 2,345,567,552 | 363,758,912 |
Each expert is a gate and up projection of 256 x 1,024 plus a down projection of 1,024 x 128. Take the active column without the embedding and you get 260,998,464, the card's "260M active non-embedding". So both headline counts hold: 2.35B stored, 363.8M active.
The table shows something the headline hides. Stored, Rigel is 86% experts. Active, it is not an expert model at all. A token touches 2 of 128 experts, so the active feed-forward width is 256 against a hidden size of 1,024: a quarter of it, where dense Llama-3.2-3B uses 8,192 against 3,072. The sequence mixers are 224.2M of the 261.0M active non-embedding parameters, 86% again, the other way round. The tied embedding is 28% of the active total on its own, which matters for the FLOPs check further down.
Mamba-2 in one recurrence
A Mamba-2 head keeps a matrix state of size (here 128 x 64) and updates it once per token. The blog writes it in attention notation:
Here and are the input-dependent B and C projections, is the input, and is a scalar between 0 and 1, computed from the token, that sets how much of the old state survives. That scalar makes the state selective: the model decides, token by token, how fast to forget. Because is a scalar rather than a matrix, the whole thing is linear attention with a data-dependent decay. That is the "state space duality" in the Mamba-2 paper's title: unroll the recurrence and the output is
which is causal attention whose score matrix is multiplied elementwise by a decay mask, with no softmax.
The two forms have opposite costs. The recurrence costs constant memory and work per token at inference, but during training it is a chain of rank-one updates, and tensor cores and TPU MXUs sit idle on rank-one updates. The attention form is all matrix multiplies but quadratic in length. Mamba-2 trains with the chunked form: cut the sequence into chunks of tokens, use the masked-attention form inside each chunk, and run the recurrence only across chunk boundaries. With Rigel's chunk size of 256, a 4,096-token sequence is 16 sequential state hand-offs instead of 4,096, and nearly all the arithmetic lands in matrix multiplies.
The same structure parallelizes long sequences across GPUs. A chunk's effect on the state is a
scalar decay and an additive term ; each rank computes its pair, one all-gather shares
them, and each rank chains the pairs before it to get its starting state. lm-engine implements this
as _SerialPrefixScan in mamba2/op.py. No per-token keys or values cross the network.
Why keep any attention
A fixed-size state is a lossy summary: good at the gist, bad at an exact string from long ago. The blog says the recurrent form "comes at the cost of the precise per-token retrieval where attention still does best". So every fourth layer is grouped-query attention. It is the same bargain as Soofi S, which keeps 6 attention layers in 52, the 30B backbone under TwoTower's frozen memory tower, and the 550B model in Nemotron's NVFP4 run. Rigel's share is one layer in four.
Rigel's attention has two twists. It has no positional encoding, on the argument that the Mamba-2 layers already carry position. And it uses exclusive self attention (XSA), which subtracts from each token's attention output its projection onto the token's own value vector:
Attention should bring in other tokens; the residual path already carries the token's own. In the blog's ablation, which changes only the attention, XSA ends ahead: averaging the last 250 logged points of each run (measured, from their data), plain GQA sits at a loss of 2.781 after 105B tokens and XSA at 2.755.
What the state costs, and what it cannot do
Per sequence, a Mamba-2 layer holds state values plus 6,912 of convolution history. With a 4,096-token window, an attention layer holds at most 2,097,152 cached values. Across the stack that is 29,043,200 values, about 58 MB in BF16, and it stops growing once the context passes 4,096 tokens (reasoned). For contrast, Llama-3.2-3B's KV cache grows by 112 KiB per token, 28 layers of 8 KV heads at dimension 128, which is 15 GB per sequence at its 131,072-token maximum (reasoned).
The price of that flat line: with a 4,096-token window on every attention layer, nothing older than 4,096 tokens can be looked up exactly. Beyond that, the context is whatever survived in the Mamba-2 state, and as KDA's half-life shows, a gated recurrence forgets on a schedule. The blog reports no long-context evaluation, no needle-in-a-haystack and no RULER, so 294,912 tokens is a length the model was trained at, not a demonstrated retrieval range.
Five kinds of chip, one run
The blog is specific about the hardware: H100s, A100s (40GB and 80GB), 32GB V100s, TPU v5p and TPU v6e, "with most of the time split between TPU v6e and A100s". The loss-chart legend lists the cluster sizes: V100 in groups of 24, 48, 56 and 64; A100 40GB at 32 and 192; A100 80GB at 24; H100 at 16 and 24; TPU v5p at 32; TPU v6e at 4 and 16 (all reported).
This was one run moved between clusters as chips became free, not one job spanning them. The glue is that the model exists once, in PyTorch, and runs on TPUs through torch-xla rather than a JAX port, to "avoid any potential incorrectness in the model code across a PyTorch and a JAX codebase". The blog reports the training curves as "nearly perfectly identical" across hardware. What changed per cluster:
| Chips | Data parallelism | Precision | MoE kernel |
|---|---|---|---|
| H100, A100 80GB | DDP | BF16, FP32 reductions | SonicMoE (H100), ScatterMoE (A100) |
| A100 40GB, V100 32GB | HSDP-2 | BF16; FP16 with loss scaling on V100 | ScatterMoE (A100), own kernels (V100) |
| TPU v5p, v6e | FSDP (HSDP did not work under torch-xla) | BF16, FP32 reductions | XLA-compiled |
V100s cannot do BF16; the blog says FP16 did not hurt this model but "could affect a larger training run". The thread adds that the team wrote MoE kernels for the V100 and Pallas Mamba-2 kernels for the TPU. Hardware also picked the architecture. The authors wanted Gated DeltaNet, the delta-rule cousin of the same recurrence covered in liquid time constants and gated delta rules, but its kernels for V100s and TPUs "seemed like a much bigger undertaking", so they took Mamba-2.
The public lm-engine code matches the released parts of that story. A Mamba-2 layer calls
mamba_ssm's Triton chunk-scan kernel when allowed and otherwise a pure-PyTorch chunked scan, which
XLA can compile; the Pallas kernels are "being prepared for open-source release". The attention
branch a TPU takes asserts sliding_window is None, which fits the blog putting all long-context
training, the only windowed part, on H100s. Checkpoints are torch.distributed.checkpoint on CUDA and
per-rank xla_save shards on TPU, and an unshard tool reads either into plain weights. How optimizer
state crossed between GPU and TPU mid-run is not described. A newer virtual_cluster module submits a
job to "whichever one has free capacity right now"; its example clusters are not Rigel's, so I read it
as where the tooling went next.
- license
- Apache-2.0
- branch
- HEAD
- tests
- 61 files
- source
- 1.5 MB
- commit date
- 2026-09-25
by size of tracked source at this commit, file counts in brackets; docs, data and vendored trees excluded
local clone, 2026-09-26 at a9c6e2b — branch, commit, commitDate, fileCount, hasTests, languages, license, licenseFile, shallow, testFileCount
shallow clone: counts describe the pinned tree, not the history
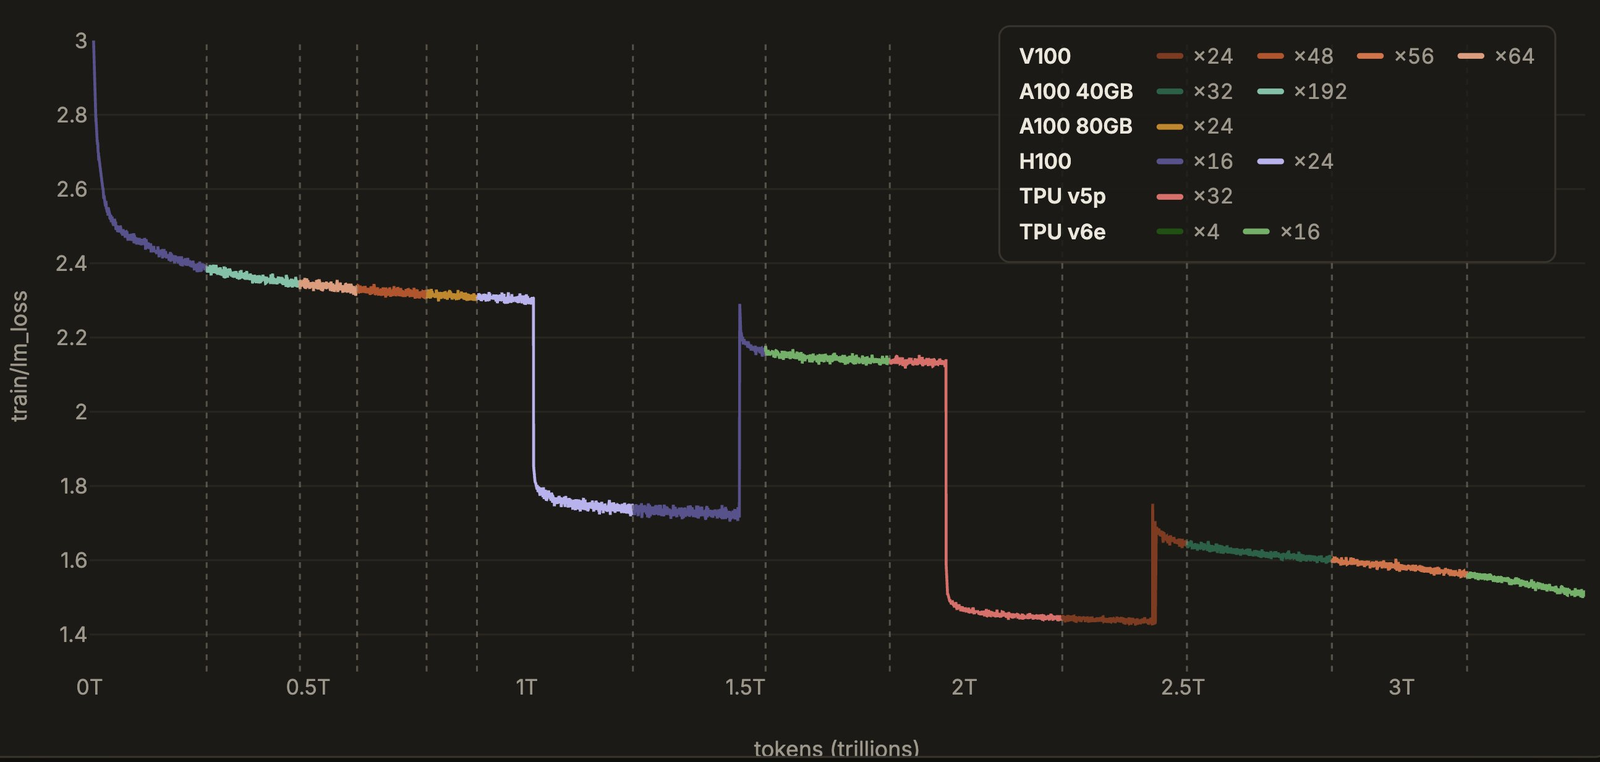
The file that draws those colours says so itself, in a note that opens with PLACEHOLDER and
continues: "segment order and token boundaries were generated for layout; replace
from_tokens/to_tokens with the real cluster schedule." The chips and cluster sizes are claims. The
schedule in the picture is not.
Tokens and data
Every step is 1,152 sequences of 4,096 tokens, 4,718,592 tokens (reported as "4.7M"). The long-context phase keeps that token count per step with 16 sequences of 294,912 tokens, for 25,000 steps and about 118B tokens. The main run's step count is not stated, but it falls out of the FLOPs figure below: exactly 725,000 steps, or 3,420,979,200,000 tokens (reasoned), consistent with the logged loss ending at 3.419T. Add the long-context phase and the total is 3.54T tokens, which the thread rounds to "3.5T".
The learning rate warms up over 5,000 steps to 0.01, holds, follows a power law , and decays linearly to zero. The long-context phase restarts at a peak of , 200x lower. The optimizer is AdamW; the blog says there was not enough compute to ablate Muon on Mamba-2 layers. The data came in six phases (shares in percent, reported):
| Phase | Web | Code | Math | Multilingual | STEM reasoning | Nemotron-CC-v2 | FinePDF | Long-CoT QA | Other |
|---|---|---|---|---|---|---|---|---|---|
| 1 | 71 | 20 | 7 | 2 | |||||
| 2 | 15 | 20 | 7 | 2 | 56 | ||||
| 3 | 57 | 18 | 19 | 6 | |||||
| 4 | 2.2 | 35 | 35 | 3.5 | 20 | 4.3 | |||
| 5 | 19.1 | 6.9 | 0.8 | 11.5 | 45.8 | 11 | 4.9 | ||
| 6 (long context) | 11.8 | 4.3 | 0.5 | 7.1 | 28.2 | 6.8 | 33.9 | 7.4 |
The blog does not say how many tokens each phase ran. The loss chart's cliffs hint at the boundaries, but not precisely enough to rebuild the whole-run mix.
Checking "under 1% of its pretraining FLOPs"
The standard estimate of training compute is : about 2 FLOPs per parameter per token for the forward pass and 4 for the backward, with the parameters a token touches and the tokens. It ignores attention scores and the scan, on both sides. For an MoE, is the active count.
Rigel's figure reproduces exactly. The blog's is
non-embedding active parameters times 725,000 steps of 4,718,592 tokens. It matches the number in the blog's chart code to eleven significant figures, which is how I know the step count.
The Llama side is where the choice lives. Meta's card says Llama 3.2 "was pretrained on up to 9 trillion tokens", with "logits from the Llama 3.1 8B and 70B models" used as token-level targets, and that "knowledge distillation was used after pruning". The Rigel blog notes both small models were pruned and distilled from Llama-3.1-8B, and does not use the 3B's own run. Its chart puts under both Llama-3.2-1B and Llama-3.2-3B, and that number is
Llama-3.1-8B's non-embedding parameters times 15T tokens. The blog states the assumption: "we assume Llama-3.1-8B's training compute and assume distillation and pruning are free and cost no FLOPs". That gives the 117x, and Rigel's share is 0.85%.
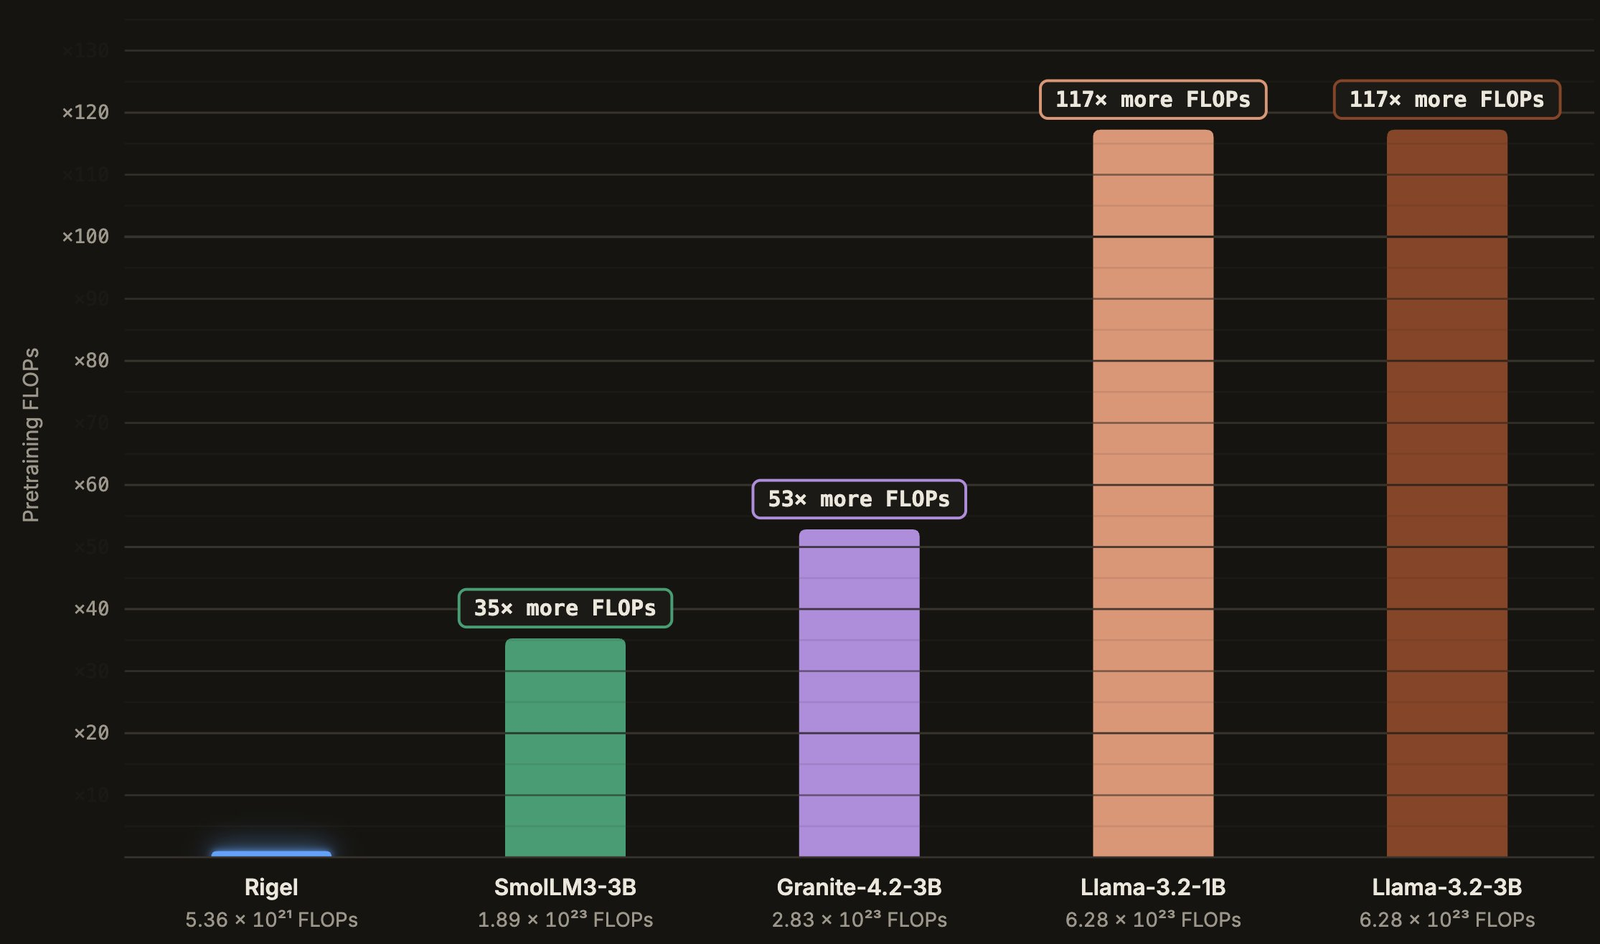
That is defensible, since Llama-3.2-3B does not exist without the 8B, but it is not the only accounting (all reasoned, same ):
| Question | Rigel | Llama side | Ratio | Rigel's share |
|---|---|---|---|---|
| The blog's: 3B charged for the 8B's run, non-embedding | 117x | 0.85% | ||
| Same, counting the output head on both sides | 90x | 1.11% | ||
| Llama-3.2-3B's own 9T run, head counted, tied embeddings on both | 23x | 4.30% | ||
| The lineage: 8B run plus 3B run, head counted | 114x | 0.88% |
The second row matters more for Rigel than for Llama. Leaving out embeddings is the usual convention, but a tied embedding is also the output projection, a real 1,024 x 100,352 matrix multiply on every token. It is 39% on top of Rigel's non-embedding count and only 7.5% on top of Llama-3.1-8B's. Count it on both sides and the blog's own comparison lands at 1.1%, just over the line. Adding Rigel's 118B-token long-context phase moves each Rigel figure by about 3.4%.
Llama-3.1-8B: 6 × 6,979,588,096 × 15T
These defaults reproduce the blog's 117× exactly. Switch the Llama side to the 3B's own run and Rigel's share becomes about 4%; count the output head on both sides and the blog's own comparison lands at 1.1%.
Meta also reports GPU time: 460k H100 hours to train Llama-3.2-3B, 86k hours of logit generation for the 3.2 family, and 1.46M hours for Llama-3.1-8B. Rigel reports none. For scale only, FLOPs at 40% of an H100's 989 TFLOP/s dense BF16 peak is about 5,200 H100 hours (reasoned; the 40% is my assumption): two weeks on 16 H100s, small enough for a changing pool of chips.
The verdict: "under 1%" is true under the blog's stated assumption and under the full lineage, and about 4% against Llama-3.2-3B's own training. Every version is a gap of more than 20x.
Checking "within a few points"
The chart's numbers are not Meta's. The blog's chart code imports one lm-evaluation-harness result file
per model. All of them are 0-shot in BF16 with lm-eval 0.4.12.dev0. Rigel and every other model
but the two Llama instruct variants were run on 2026-09-18 at harness commit ed4b4078; those two
came four days later at another commit. The thread says the same: "Zero-shot measured
on lm-eval-harness, same settings for everyone." That is the fair way to do it, and it means the Llama
numbers are re-runs. Meta's own card uses different protocols, for example 5-shot MMLU at 58 and
25-shot ARC-Challenge at 69.1. In these files the 0-shot equivalents are 55.03 and 46.25.
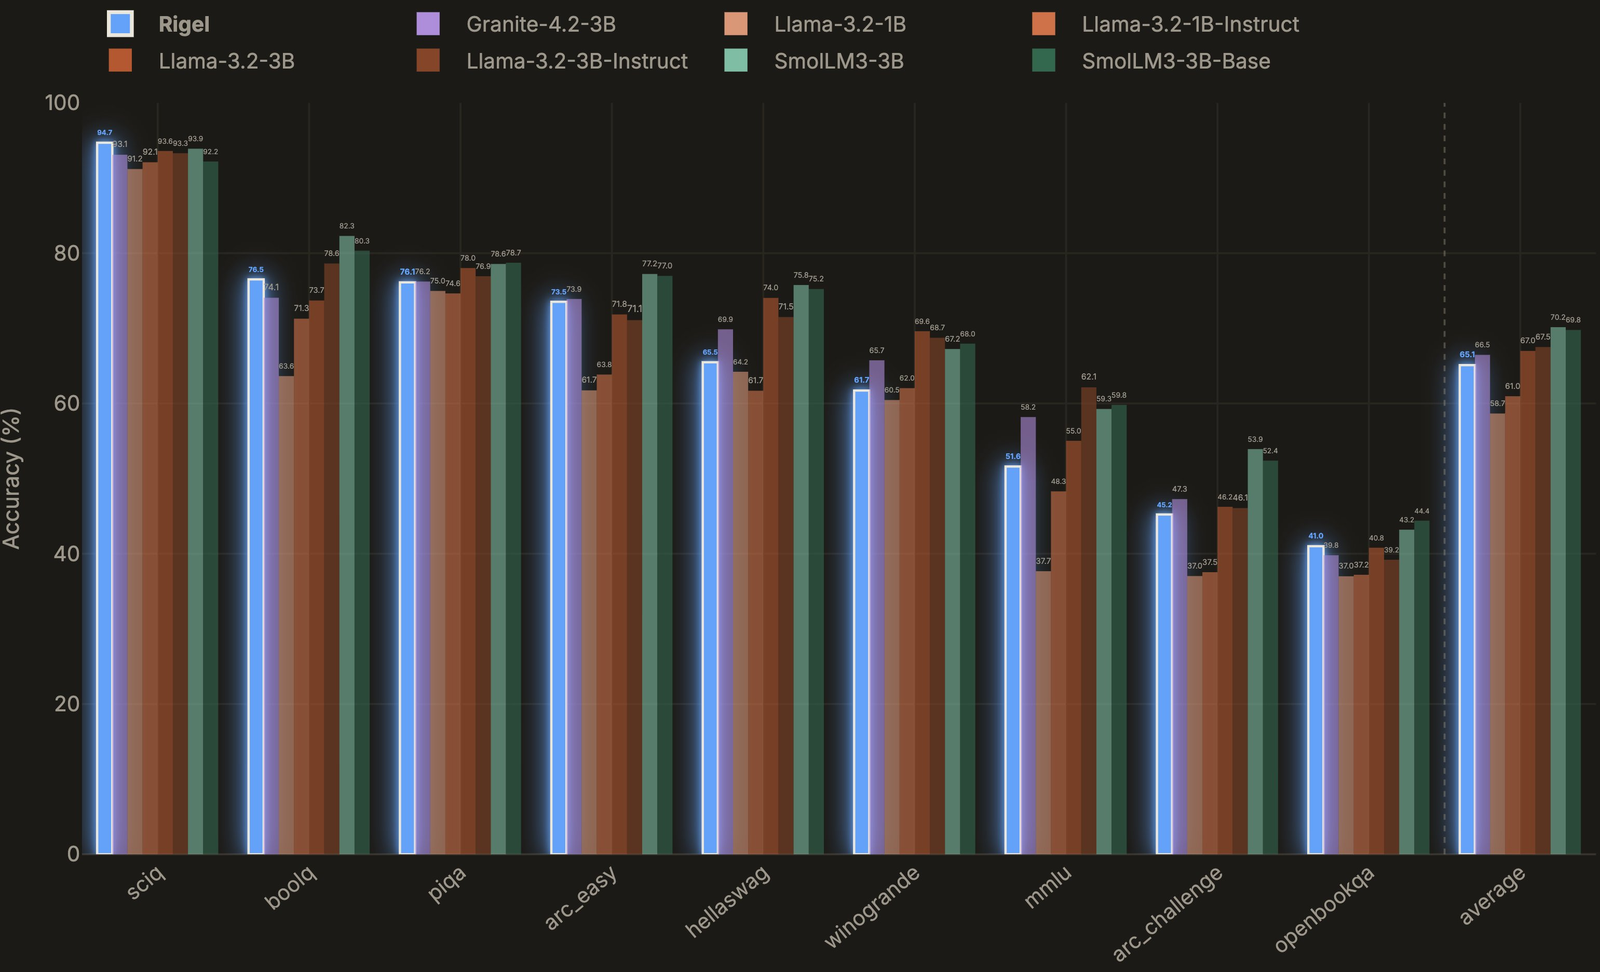
The same result files also contain COPA, RACE and LAMBADA, from the same runs, which the chart leaves out. Here are all twelve against Llama-3.2-3B base (measured, from the files):
| Task | Rigel | Llama-3.2-3B | Difference |
|---|---|---|---|
| SciQ | 94.70 | 93.60 | +1.10 |
| BoolQ | 76.51 | 73.70 | +2.81 |
| PIQA | 76.12 | 78.02 | −1.90 |
| ARC-Easy | 73.53 | 71.84 | +1.69 |
| HellaSwag | 65.48 | 74.05 | −8.57 |
| WinoGrande | 61.72 | 69.61 | −7.89 |
| MMLU | 51.61 | 55.03 | −3.42 |
| ARC-Challenge | 45.22 | 46.25 | −1.03 |
| OpenBookQA | 41.00 | 40.80 | +0.20 |
| COPA (not charted) | 74.00 | 82.00 | −8.00 |
| RACE (not charted) | 36.27 | 38.85 | −2.58 |
| LAMBADA (not charted) | 54.92 | 69.65 | −14.73 |
| Average of the 9 charted | 65.10 | 66.99 | −1.89 |
| Average of all 12 | 62.59 | 66.12 | −3.53 |
On the chart's nine tasks the claim holds comfortably: 1.9 points behind Llama-3.2-3B, 1.4 behind Granite-4.2-3B (66.46), 6.4 ahead of Llama-3.2-1B (58.66), and 4.7 behind SmolLM3-3B-Base (69.78), which used 35x the compute. With all twelve, the gap to Llama-3.2-3B roughly doubles to 3.5, the gap to Granite grows to 2.4, and the lead over Llama-3.2-1B halves to 3.5. COPA has only 100 questions, so its 8 points are 8 questions. LAMBADA has 5,153, and its 14.7-point gap is not noise. As I read it, Rigel matches or beats Llama on SciQ, ARC-Easy, OpenBookQA and BoolQ, and falls furthest behind on HellaSwag, WinoGrande and LAMBADA, which reward broad modelling of ordinary text. That is where 3.5T tokens against 9T, and a much smaller active network, should show.
One more detail from the logs. The Rigel run evaluated open-lm-engine/rigel with a maximum length
of 294,912, so it was a long-context checkpoint, not the 4,096-token rigel-base. The model on the
chart had seen 3.4% more tokens than the compute bar counts, including a phase that was a third long
chain-of-thought QA. That moves Rigel's share of the 8B run from 0.85% to 0.88% and changes nothing
else.
What I'd take from it
The result is real. The parameter counts match the card, the compute figure reproduces to the digit from the published batch size and a whole number of steps, and the baselines were re-run at the same settings rather than copied from model cards. A 360M-active hybrid about two points under Llama-3.2-3B on common-sense multiple choice, from 3.5T tokens on scavenged hardware, shows how far sparse experts and a mostly recurrent stack stretch a small budget.
The asterisks are specific:
- "Under 1%" holds when Llama-3.2-3B is charged for Llama-3.1-8B's run. Against the 3B's own run it is about 4%; counting the output head on both sides puts the blog's comparison at 1.1%.
- "Within a few points" is 1.9 on the nine charted tasks and 3.5 on all twelve in the logs. The largest single gap, LAMBADA, is one of the three left off the chart.
- The long context is untested. Attention sees 4,096 tokens back, and no retrieval evaluation is published.
- The hardware story is partly unreleased. The V100 MoE kernels, the FP16 loss-scaling path and the Pallas Mamba-2 kernels are not in the public tree, and the loss chart's schedule is a placeholder.
- The paperwork is thin. No licence on the weights, an
auto_mappointing at missing files, and arigel-midwhose card describes another repository.
The part I'd borrow is the blog's opening principle: "Work with the compute you have." One model file, torch-xla instead of a second framework, and an architecture chosen by which kernels could be written on every chip. Most papers hide that constraint. This one put it in the design section.