2026-10-08 · 24 min · retrieval · multimodal · distillation · small-models · benchmarks
Why read this
Hightop 30%Recounts both checkpoints from their headers, derives vectors and bytes per page from the configs, and shows cross-model means index big, query small.
- Runs on a consumer GPU
- Original analysis
- Widely used
Vision & multimodalMITPractitioner model
How this was scored
- Is it new?
- 2 of 3: A real new idea, method or capability
- Can I trust it?
- 2 of 3: Measures key facts from files, code or configs
- Can I run it?
- 3 of 3: Open, permissive, runs on reader hardware with instructions
- Will I understand it?
- 2 of 3: Mechanism from first principles with figures
- Can I act on it?
- 2 of 3: A concrete recipe, numbers or comparison
- Will it last?
- 2 of 3: A reference for a year or more
- Does it affect many?
- 2 of 3: A widely used model, tool or lab release
- Only here?
- 2 of 3: A teardown or measurement few others did
Score 73 of 100, ranked 61 of 476 rated articles. Each question is answered 0–3 by hand, and a 3 is rare. How articles are scored
Perplexity's announcement said the two new models "retrieve text, images, and pages with a shared embedding space for cross-model querying." I read that as cross-modal the first time, and so did the note that sent me to it. Every multimodal retriever has a shared space between text and images; that is what makes a text query find a picture. It would not be news.
The word is model. The 0.6B and the 9B produce vectors that live in the same space, so a corpus indexed with the big one can be searched with queries from the small one. In a late-interaction retriever, where the index is huge and the query path is latency-bound, that is a more useful property than it sounds, and it is the part of this release I would actually build around.
So I went through the files: both model cards, both safetensors headers (two HTTP range requests each, no weights downloaded), every config in the repos, the Sentence Transformers 6 code that loads them, the transformers code for the Qwen3.5 backbone and its image processor, and the launch post with its ten charts. I did not run the models.
| Weights | pplx-embed-v2-late-0.6b, pplx-embed-v2-late-9b, float32 safetensors |
| Licence | MIT, both sizes |
| Output | one 128-dimensional, unit-length vector per token or image patch |
| Scoring | MaxSim, similarity_fn_name: "maxsim" |
| Inputs | text, or images (photos, screenshots, rendered pages); not both in one input |
| Runtime | sentence-transformers >= 6.0.0, transformers >= 5.4.0, no custom code |
| Paper | none yet; the post promises "a technical report later this year" |
- architecture
- Qwen3_5Model
- task
- feature-extraction
- library
- sentence-transformers
- license
- mit
- safetensors
- 2 shards
- largest file
- 33.57 GB
- files
- 17
- downloads
- 240
- likes
- 15
- languages
- multilingual
The header holds 8,392,695,024 parameters: 6.92B text layers, 456M vision, 1.02B token embeddings, and no output head.
repo last modified 2026-10-05
- architecture
- Qwen3_5Model
- task
- feature-extraction
- library
- sentence-transformers
- license
- mit
- safetensors
- 2 shards
- largest file
- 2.38 GB
- files
- 17
- downloads
- 251
- likes
- 21
- languages
- multilingual
The header holds 594,321,600 parameters: 239M text layers (12 of Qwen3.5-0.8B's 24), 101M vision, 254M token embeddings.
repo last modified 2026-10-05
One vector is a lossy summary
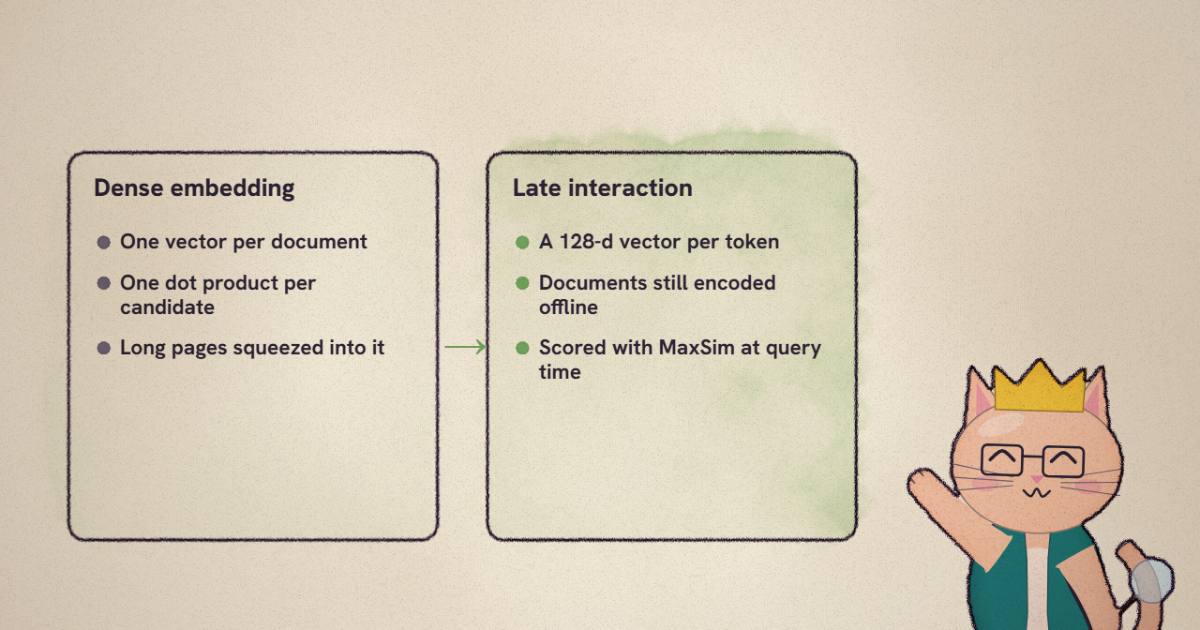
A dense embedding model turns a document into one vector and a query into one vector, and the score is their dot product. This is why it scales: a billion documents is a billion points in an approximate-nearest-neighbour index, and a search is one probe. The price is that a 4,000-token contract and a slide full of numbers each get squeezed into the same few thousand floats, before anyone knows what the query will ask. Perplexity's post points at the LIMIT benchmark, which makes the stronger version of that argument: for a fixed dimension and a large enough corpus, some patterns of relevance cannot be produced by any single-vector model, however it is trained.
The opposite end is a cross-encoder, which reads query and document together and can match anything to anything, but needs a forward pass for every candidate on every search. Nobody runs that over a corpus. It reranks a shortlist.
Late interaction, the idea from ColBERT, sits between them. Documents are still encoded alone and offline, like a dense model. But the encoder keeps one vector per token instead of pooling them, and the score is computed from all of them at query time:
where is the vector for query token and the vector for document
token (or image patch) . Every query token looks across the whole document for its single best
partner, and the partners' similarities are added up. The vectors are unit length (the last module
in the pipeline is Normalize), so each term is a cosine between -1 and 1, and the score grows
with the number of query tokens.
Perplexity's own figure is the clearest picture of it I have seen, so here it is, and below it the same numbers in a grid you can poke.
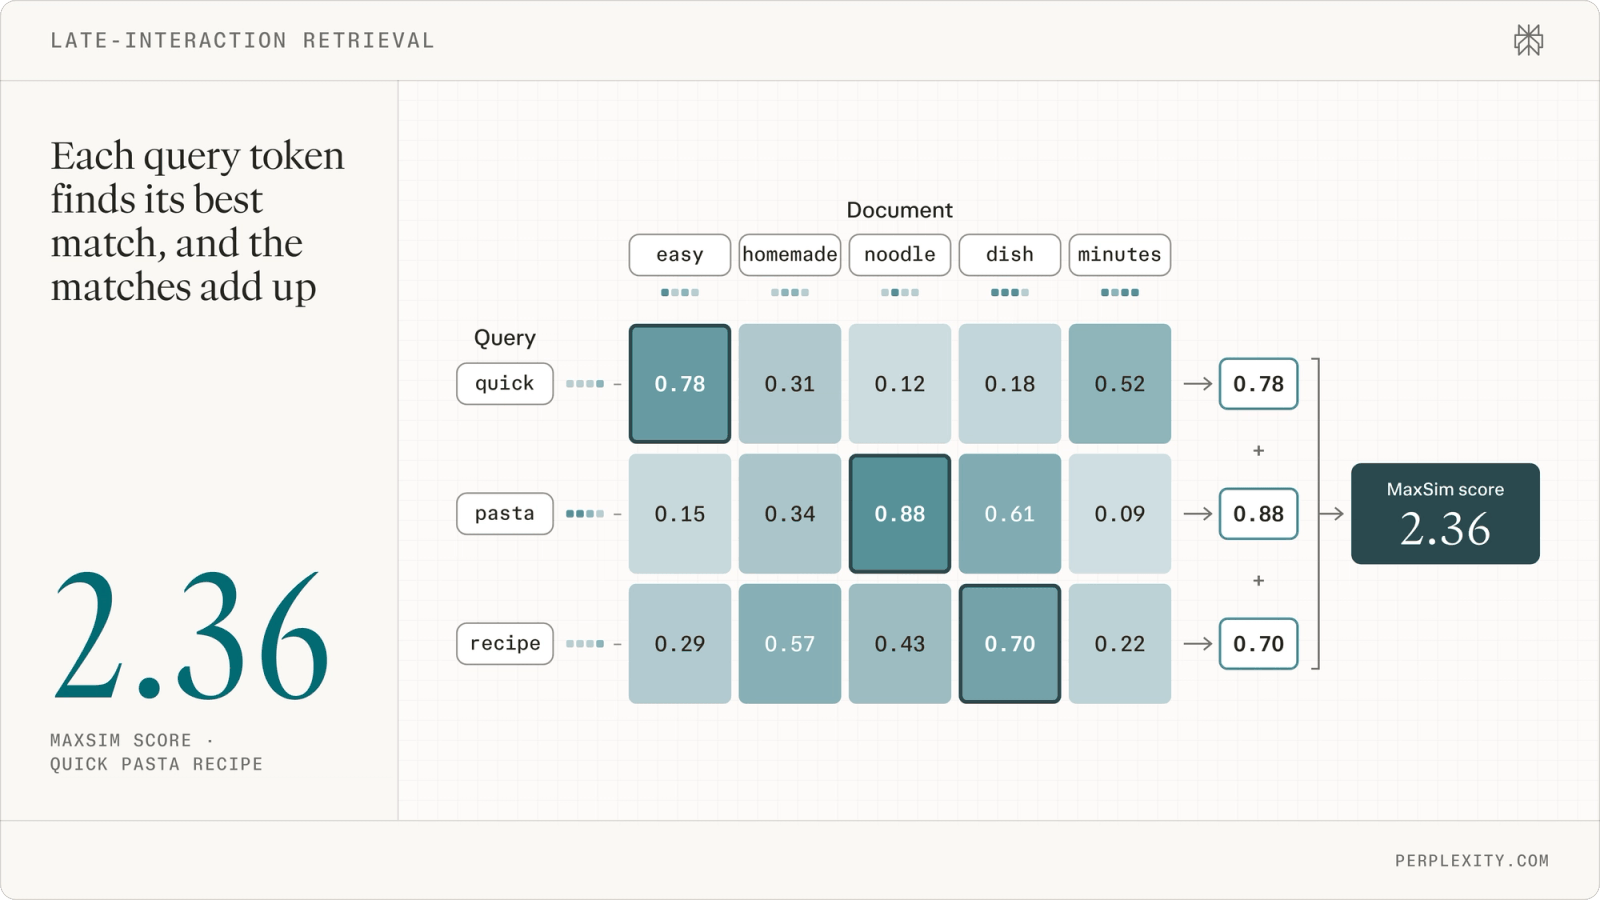
| query \ doc | best | |||||
|---|---|---|---|---|---|---|
| 0.78 | 0.31 | 0.12 | 0.18 | 0.52 | 0.78 | |
| 0.15 | 0.34 | 0.88 | 0.61 | 0.09 | 0.88 | |
| 0.29 | 0.57 | 0.43 | 0.70 | 0.22 | 0.70 |
Drop "noodle" and "pasta" falls back to "dish" at 0.61, so the score loses 0.27, not 0.88. Each query token only ever needs one good partner, which is why removing redundant document vectors costs less than the vector count suggests, and why removing the one vector that carries a rare fact costs a lot.
Two things fall out of the sum that matter later. A query token only needs one good partner, so a document can lose many redundant vectors and barely notice: drop "noodle" and "pasta" falls back to "dish" at 0.61, costing 0.27 rather than 0.88. And a document's cost is its vector count. Scoring one candidate is dot products of 128 numbers, where a dense model does one.
What is in the two checkpoints
The model card says "built on Qwen3.5 with bidirectional attention." The configs say which Qwen3.5.
The 9B's text tower is Qwen3.5-9B's exactly (hidden size 4,096, 32 layers, 12,288-wide MLP) with
its 27-block vision tower. The 0.6B's widths are Qwen3.5-0.8B's (hidden 1,024, MLP 3,584, a
12-block vision tower), but num_hidden_layers is 12 where the base has 24. The post confirms it:
they "prune its 24-layer text tower to 12 layers." It doesn't say which twelve survived.
Summing every tensor in the headers:
| Group | 0.6B | 9B |
|---|---|---|
| Text layers | 239,449,024 | 6,919,565,824 |
| Vision tower | 100,592,896 | 456,010,480 |
| Token-embedding table | 254,279,680 | 1,017,118,720 |
| Total in the file | 594,321,600 | 8,392,695,024 |
| Card's "active" | 340M | 7.4B |
128-wide projection (1_Dense) | 131,072 | 524,288 |
The card's "active parameters" is everything except the embedding table: 594.3M minus 254.3M is 340M, and 8.39B minus 1.02B is 7.38B. It's a fair way to count an encoder, since a table lookup costs nothing at inference, and the post says so plainly for the small model. For text-only input the 0.6B's vision tower sits idle too, so a text query runs through about 240M parameters.
The 9B has no output head at all, which is why its file holds 8.39B rather than Qwen3.5-9B's
nine-and-a-bit: an embedding model never predicts a next token, so lm_head was dropped. The 9B
config still carries mtp_num_hidden_layers: 1 from the base, but no multi-token-prediction
weights are in the header. Everything is stored in float32, which makes the 9B's single
model.safetensors 33.57 GB on disk. Cast it to bfloat16 when you load it; nothing in the configs
asks for float32 at runtime.
After the backbone, modules.json lists the rest of the pipeline, and it is short:
0  Transformer         Qwen3.5, last_hidden_state for every position
1  Dense               4096 -> 128 (1024 -> 128 on the 0.6B), no bias, no activation
2  MultiVectorMask     drop bare punctuation tokens, documents only
3  Normalize           unit length, so MaxSim terms are cosines
Queries are prefixed with [Q] and documents with [D] , both added to the tokenizer as special
tokens; the card warns that PyLate puts these markers second where this model expects them first.
Queries are cut at 1,024 tokens and documents at 4,096. query_expansion is null, so there is no
ColBERT-style padding of short queries with [MASK] tokens; a five-word query is scored with
roughly five vectors plus the marker. The punctuation skiplist is the classic ColBERT one (all 32
ASCII punctuation characters) and applies only on the document side.
"Bidirectional" covers a quarter of the layers
This is the detail I didn't expect. Qwen3.5 is a hybrid: three of every four layers are Gated
DeltaNet linear-attention layers, and every fourth is ordinary softmax attention. The configs keep
that pattern (full_attention_interval: 4), so the 9B has 8 softmax layers out of 32 and the 0.6B
has 3 out of 12.
The config sets is_causal: false, and in transformers that flag does what it says for the softmax
layers: create_causal_mask returns a bidirectional mask, and the flag is also passed to the
attention kernel. But it does not reach the DeltaNet layers. Qwen3_5GatedDeltaNet runs a causal
1-D convolution and then a left-to-right recurrent scan, and nothing in it reads is_causal. In
those layers each token still sees only what came before it.
So "bidirectional attention" is true of a quarter of the depth. Information from the end of a passage reaches its first tokens only through the softmax layers, and since the last layer in both models is a softmax layer, every output vector does see the whole input at least once. Whether that costs anything I can't tell without running it; ColBERT-style vectors are mostly about the local token in context, and the benchmark numbers below say the hybrid works. It's a design trade the card's one line hides. If the gated delta rule is new to you, the article on it explains why it is a recurrence and not an attention matrix.
How a page becomes 1,692 vectors
The headline modality is pages: PDFs, slides and scans rendered to images and embedded directly,
with no OCR in between. How many vectors an image produces is not on the card, but it is fully
determined by processor_config.json.
The image processor is Qwen2-VL's. Its vision tower cuts the image into 16-pixel patches and then
merges each 2×2 block of patches into one token, so each output vector covers a 32×32-pixel block.
Before that, smart_resize rounds the image to multiples of 32 and, if it has more than
max_pixels (1,800,964, which is 1,342 squared), scales it down to fit. The cap works out to at
most 1,758 vectors per image. (The same file also carries a size.longest_edge of 16,777,216; in
the current transformers code the legacy max_pixels key overrides it at load time, so the
1.8-megapixel cap is the one that applies.)
What that means for the things you would actually feed it:
| Input | Resized to | Vectors |
|---|---|---|
| Letter page at 72 dpi (612×792) | 608×800 | 475 |
| Letter page at 100 dpi | 864×1,088 | 918 |
| Letter page at 150 dpi | 1,152×1,504 | 1,692 |
| A4 page at 150 dpi | 1,120×1,568 | 1,715 |
| 1080p screenshot | 1,760×992 | 1,705 |
| 12 MP phone photo | 1,536×1,152 | 1,728 |
Add three or four marker tokens ([D] , the vision start and end tokens) to each. The mask module
in this export does not strip them: keep_only_token_ids is null, so nothing restricts the index
to image-patch vectors the way colpali-engine's mask_non_image_embeddings does. With so few text
tokens around an image it hardly matters here.
Anything rendered at 150 dpi or more hits the cap, so a realistic page is about 1,700 vectors. The render resolution is the main dial on your index size, and it is set by your PDF rasteriser, not by the model. Perplexity doesn't say what resolution ViDoRe's pages were embedded at, so I can't tell you what quality you give up at 72 dpi.
One limitation is stated plainly on the card and is easy to miss: "Mixed text+image inputs are not supported." A document is either text or an image. A page with a useful OCR layer can't be embedded as both at once; you would index it twice and merge.
What the index costs
The launch post gives storage one paragraph and leaves the sums to the reader. Every one
of those vectors is stored. encode_document returns float32, so a 150-dpi page is
1,692 × 128 × 4 bytes, 866 KB. In float16 it is 433 KB. A dense model with a 4,096-wide float32
vector stores 16 KB for the same page, so late interaction costs about 26 times as much at half
precision. A million pages is 433 GB of vectors before any index structure.
Nothing in the release reduces that. There is no token pooling in modules.json and no quantised
variant. Sentence Transformers 6 does ship the tools: a HierarchicalTokenPooling module that
clusters a document's vectors and keeps about one in pool_factor, which you can pass per call to
encode_document, and ColBERTv2-style engines store each 128-d vector as a 4-byte centroid id plus
2 or 1 bits per dimension (36 or 20 bytes instead of 256). Perplexity reports no results with
either, so how much quality survives them on these models is unmeasured.
A Letter page rendered at 150 dpi is past the 1,800,964-pixel cap, so it is shrunk to 1,152 x 1,504 and gives 1,692 vectors: 433 KB in float16, about 26 times a 4,096-wide float32 vector. Rendering at 72 dpi gives 475 vectors instead; how sharp you rasterise a page sets the index bill, and that is a choice the model card leaves to you.
Two things in that calculator are worth a second look. The single-vector baseline's width matters less than you'd think: going from 1,024 to 4,096 dimensions changes the dense index fourfold, while the late-interaction index is ten to a hundred times bigger in every setting. And the last cell is the quiet advantage of the shared space. Both models emit 128-d vectors from the same tokenizer and image processor (I diffed the configs: only the backbone widths and depths differ), so a 9B index costs exactly the same bytes as a 0.6B one. The bigger model costs you indexing compute, once.
The post makes a fair point on the other side. The vision-only multi-vector models it compares against emit wider vectors: 2,048 dimensions for EVIE-4.5B, 2,560 for Nemotron ColEmbed V2 4B and 4,096 for EVIE-8B and Nemotron ColEmbed V2 8B. Per vector that is 16 to 32 times the bytes of a 128-d vector, which is why Perplexity says indexing its 100,000-image internal benchmark at those widths "was impractical" and left those models off that chart. Their patch counts per page depend on their own processors, which I didn't check, so I'd treat the per-vector ratio as the fair comparison rather than a per-page one.
The shared space is between sizes
Now the property in the headline. Perplexity trained an 18B ColBERT teacher contrastively (built, the post says, by the same layer pruning from a 27B backbone), then distilled it separately into the 9B and the 0.6B. The distillation is not the usual "match the teacher's ranking." It is LEAF-style representation distillation, done per token: for every retained token, the student's output vector is pulled toward the teacher's vector for that token. LEAF did this for single-vector models; the extension here is that the target is a whole matrix of token vectors.
If both students reproduce the teacher's vectors, they reproduce each other's, and the two models become interchangeable at the vector level, which is all "cross-model querying" means. Encode the corpus once with the 9B, offline, and encode live queries with the 0.6B, which runs about 240M parameters for text and could sit on a laptop or a phone.
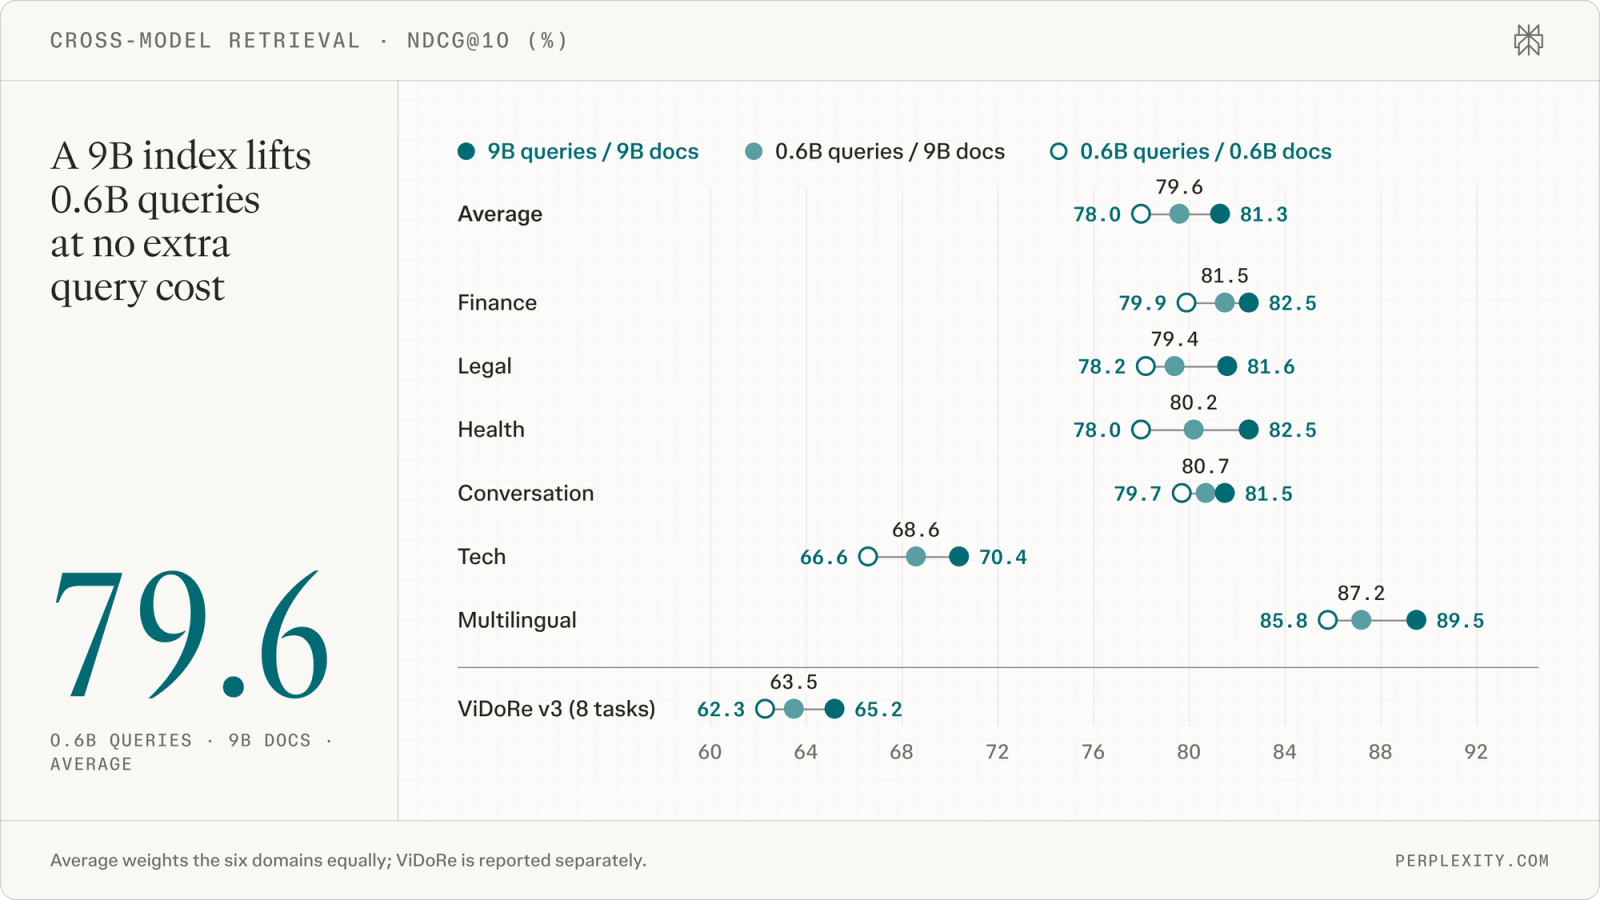
The arithmetic on that chart is better than "a 9B index helps." On the text average the asymmetric setup gains 1.6 points of the 3.3 between the two models, so about half, which is what the post claims. On ViDoRe v3 images it gains 1.2 of 2.9, about 41%. Query cost is identical to running the 0.6B alone, because it is the 0.6B encoding the query, and the index is the same size.
Two cautions. Only one direction is reported: 0.6B queries against a 9B corpus. The post also suggests encoding private documents locally with the 0.6B and merging them with results from a cloud 9B index, which is the reverse pairing mixed into one ranking, and there is no number for it. Scores from two different encoders sharing a space are not guaranteed to share a scale. And "shared space" is a property of how well each student matched the teacher; a fine-tune of one size on your own data will break it unless you fine-tune the other to match.
Does it hold up
The evaluation is broad: 72 text tasks, Perplexity's own web benchmark, two visual-document benchmarks, a natural-image one and two agentic ones. I checked every claim in the post's prose against the numbers on its own charts. They agree, with one wording issue I come to at the end.
The training mix is worth knowing first, because it frames the text results. Both models saw 186 million query-document pairs from 594 datasets in 46 languages: 88.3% text-to-text, 8.3% text-to-image and 3.4% text-to-page, rebalanced by sampling weights to 56.5%, 30.9% and 12.6%. Perplexity says it excluded every dataset tied to a benchmark it reports. I have no way to check that, but it is the right policy and they paid for it in lost training data.
Text
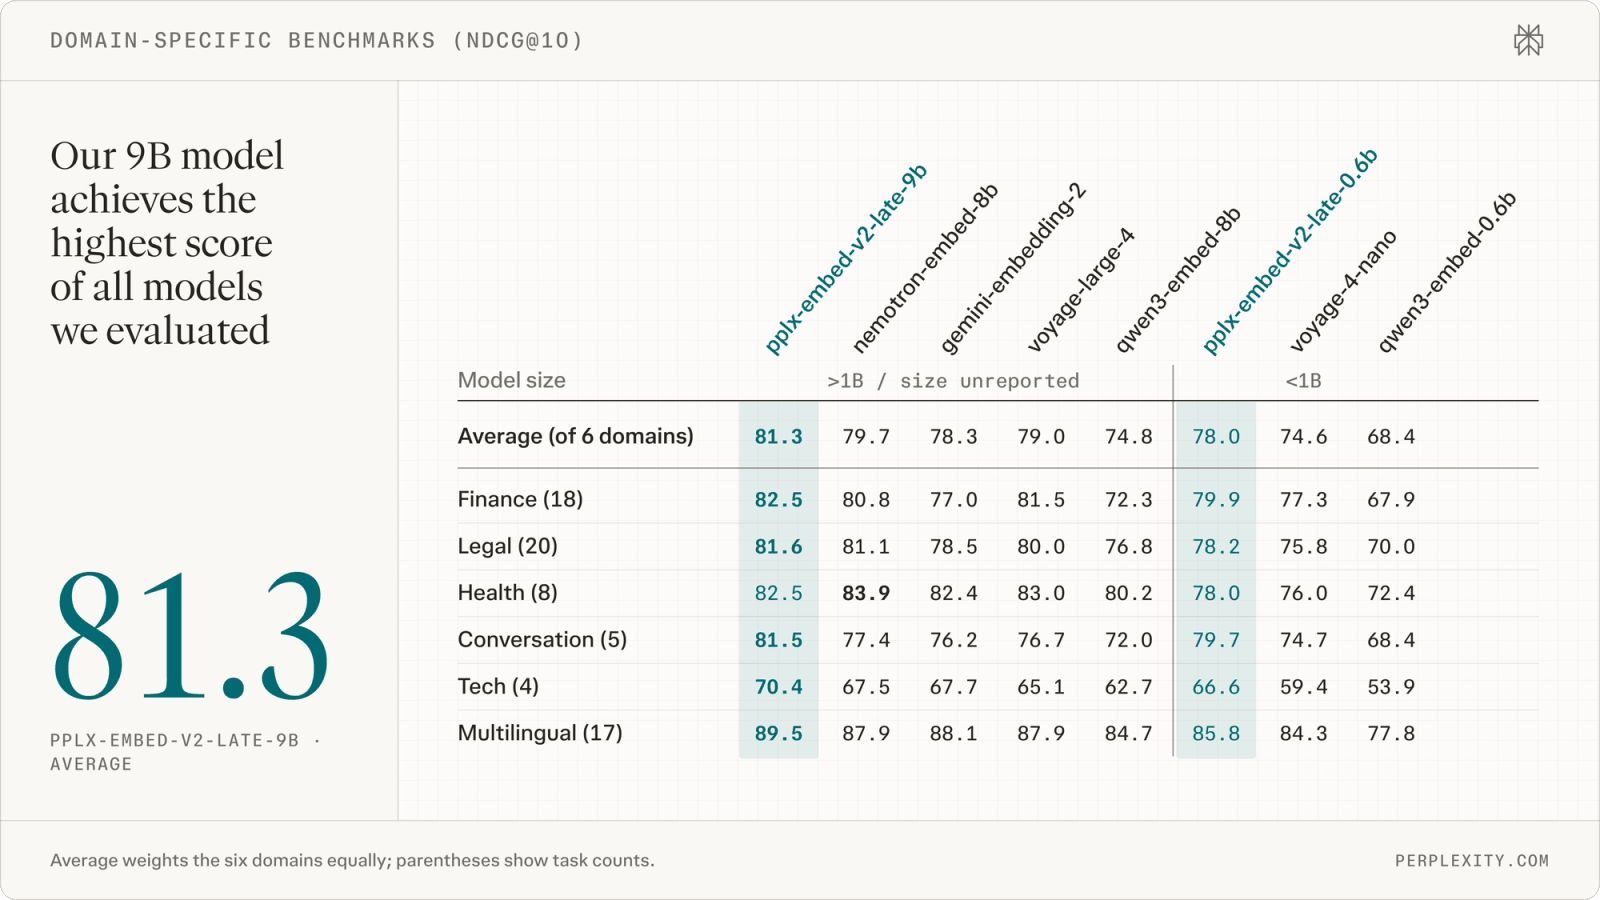
On 72 MTEB-style tasks across finance, legal, health, conversation, tech and a multilingual group,
the 9B averages 81.3, 1.6 ahead of nemotron-embed-8b at 79.7, and the 0.6B averages 78.0, 0.3
behind gemini-embedding-2. The 9B is not top everywhere: in health, nemotron-embed-8b scores
83.9 to its 82.5.
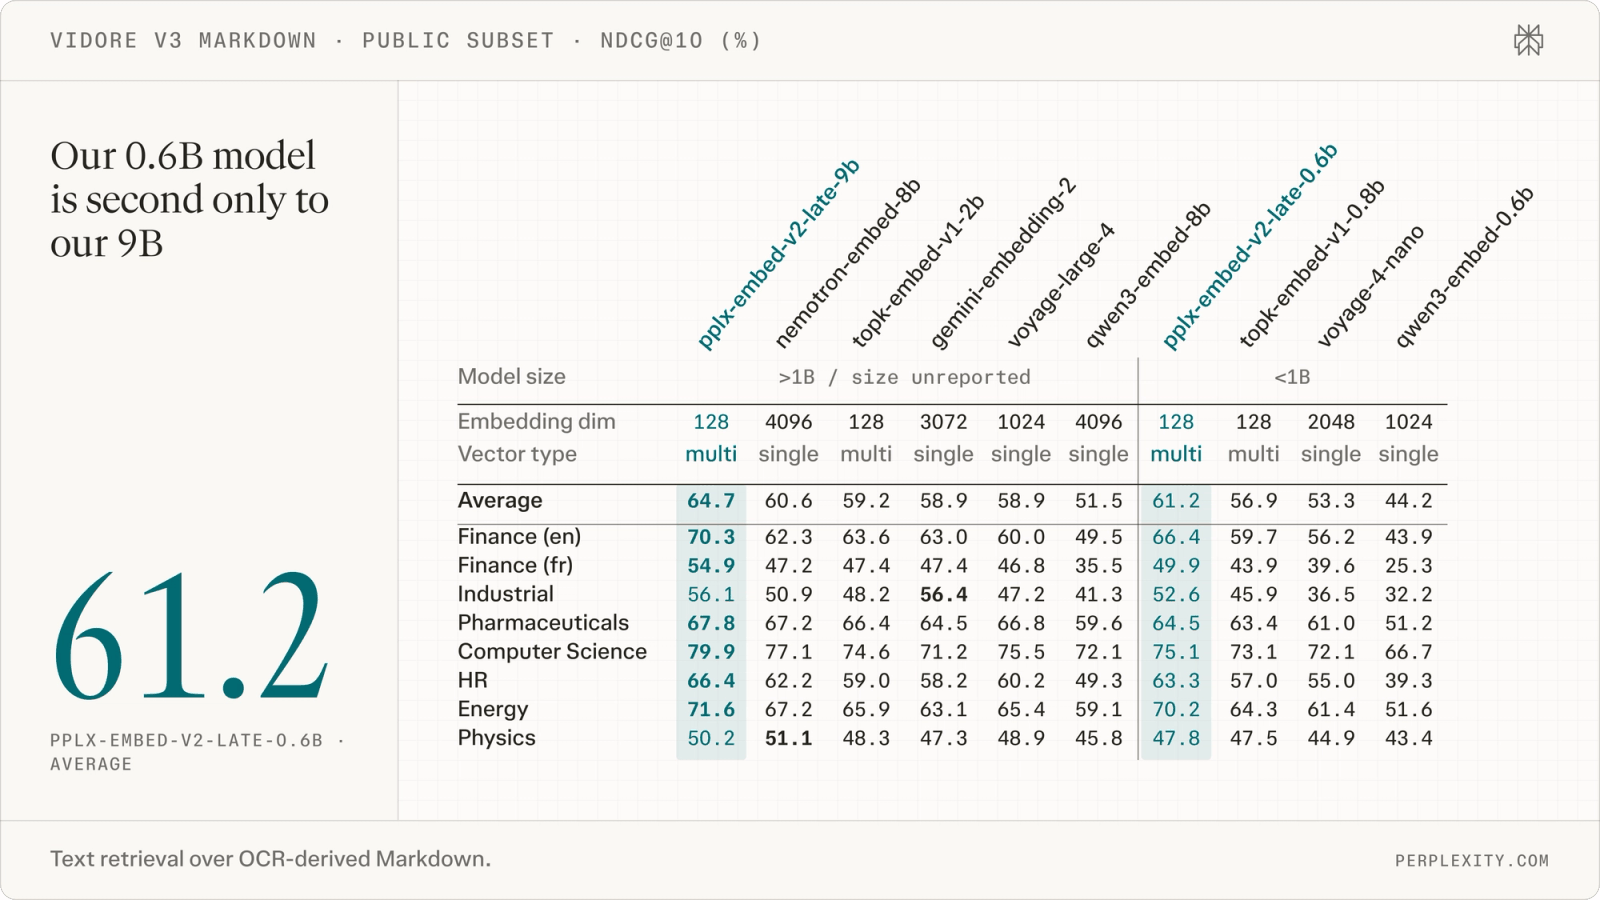
The more striking text result is ViDoRe v3 with the pages converted to Markdown by OCR, a pure text
task on visually rich documents. The 9B scores 64.7 and the 0.6B 61.2; the best model from anyone
else is nemotron-embed-8b at 60.6, and the best other sub-1B model, topk-embed-v1-0.8b, is 4.3
points behind the 0.6B.
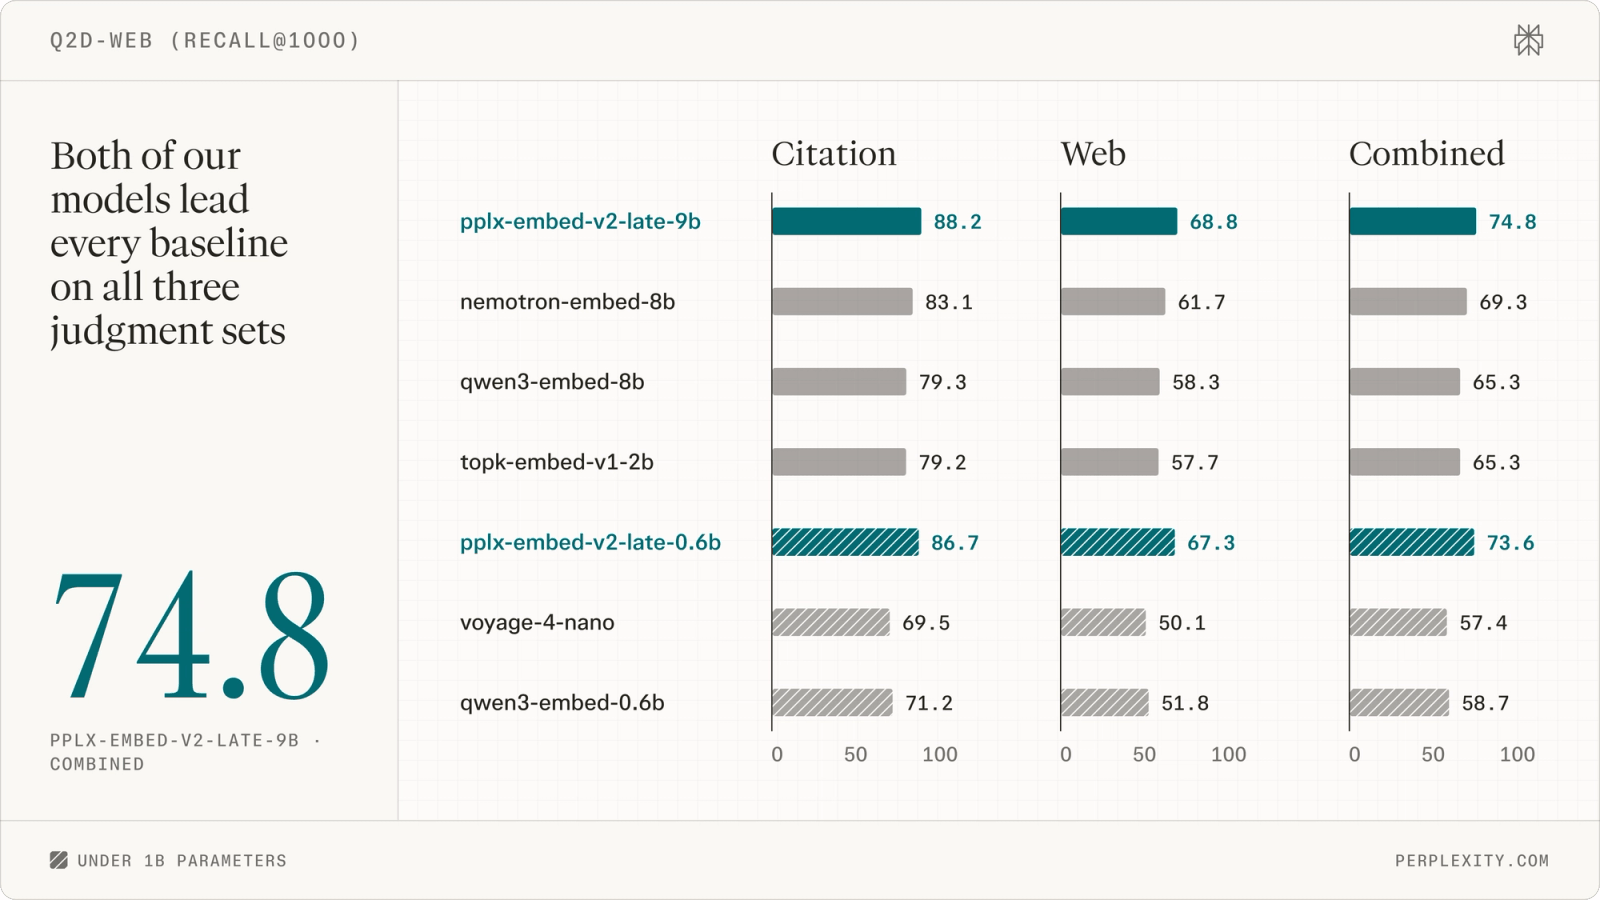
Q2D-Web is Perplexity's own benchmark: about 70,000 agent-reformulated queries from production
traffic over 190 million web documents, scored by Recall@1000. The 9B and 0.6B reach 74.8 and 73.6
on the combined judgments against 69.3 for nemotron-embed-8b. Read it with the caveat the post
itself gives: two of the three judgment sets come from what Perplexity's own systems already cited
or ranked, which favours a model trained to rank like them, so they lead with the
combined set, which adds LLM judgments of documents neither system surfaced. It is still their
benchmark, their queries and their judge.
Pages and images
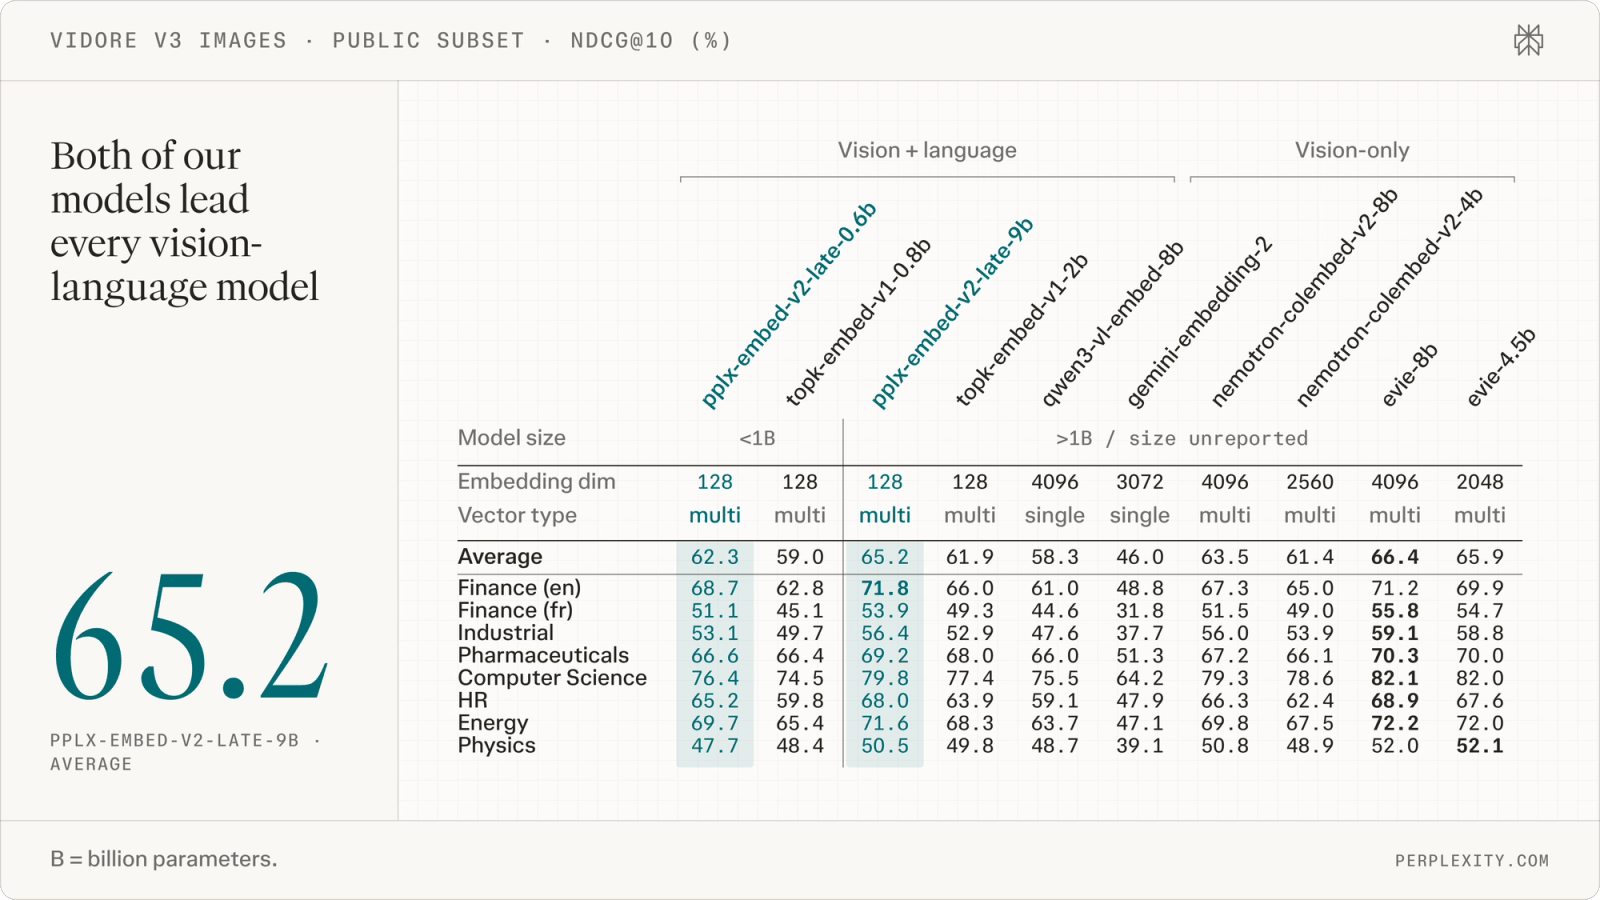
On the ViDoRe v3 public subset with real page images, the 9B averages 65.2 and the 0.6B 62.3. Both
beat every other vision-language model on the chart, including topk-embed-v1-2b at 61.9 and the
single-vector qwen3-vl-embed-8b at 58.3 and gemini-embedding-2 at 46.0. The vision-only
multi-vector models are separated out, and two of them beat the 9B: EVIE-8B at 66.4 and EVIE-4.5B at
65.9. Nemotron ColEmbed V2 8B scores 63.5, 1.2 above the 0.6B.
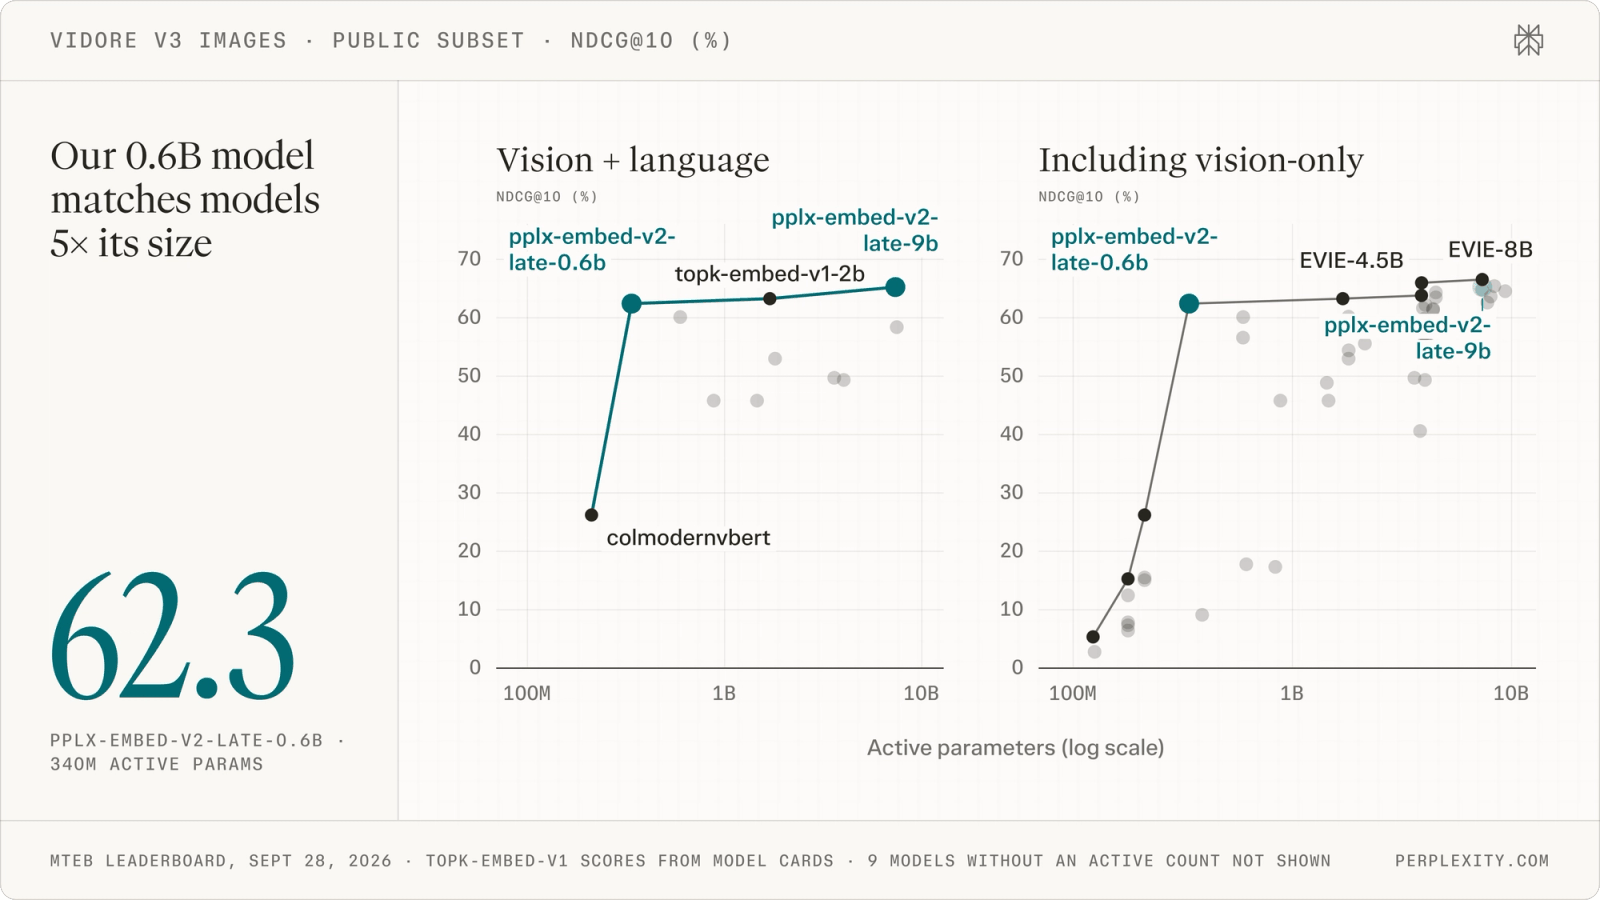
The post's "our 0.6B model matches models with five times as many active parameters" comes from
this chart plotted against size. On the vision-language panel the 0.6B at 340M active sits at 62.3
and the next frontier point is topk-embed-v1-2b, at roughly 1.7B on the log axis, with 61.9. The
footer adds that nine models without a published active count are left off the plot.
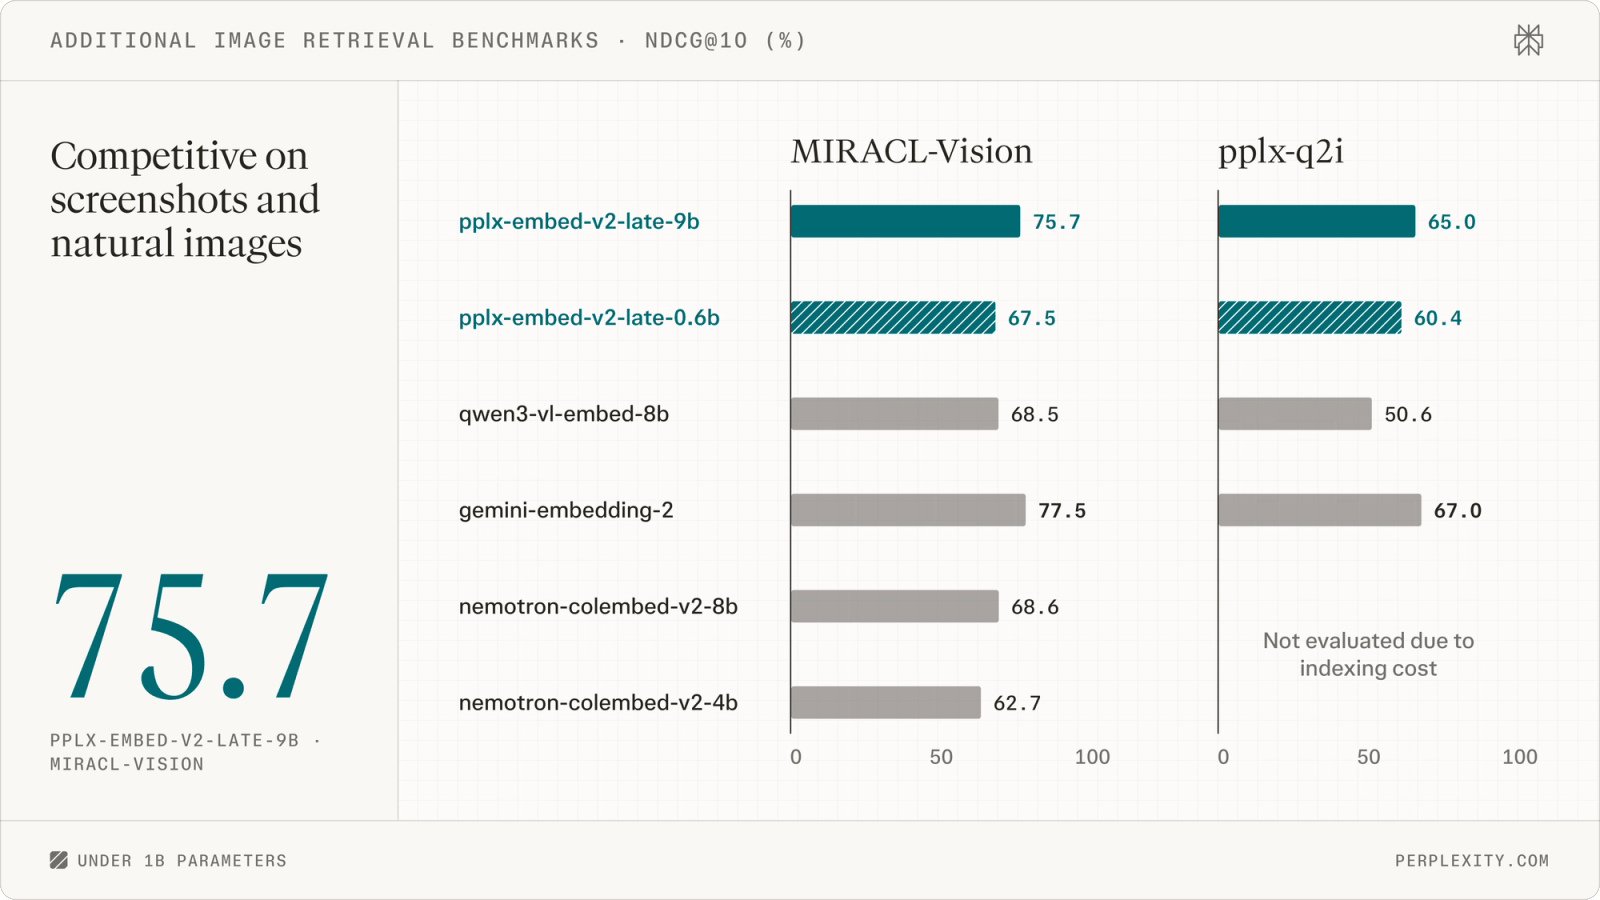
Natural images are the weaker side. On MIRACL-Vision (Wikipedia screenshots) the 9B scores 75.7,
behind gemini-embedding-2 at 77.5, and the 0.6B's 67.5 is a point under qwen3-vl-embed-8b. On
PPLX-Q2I, an internal benchmark from Perplexity's image-search logs (10,000 queries, 100,000
images), the 9B's 65.0 trails gemini's 67.0 and both sizes beat qwen3-vl-embed-8b by more than 9
points. The second benchmark is internal and unreleased, so treat it as a claim.
Agents
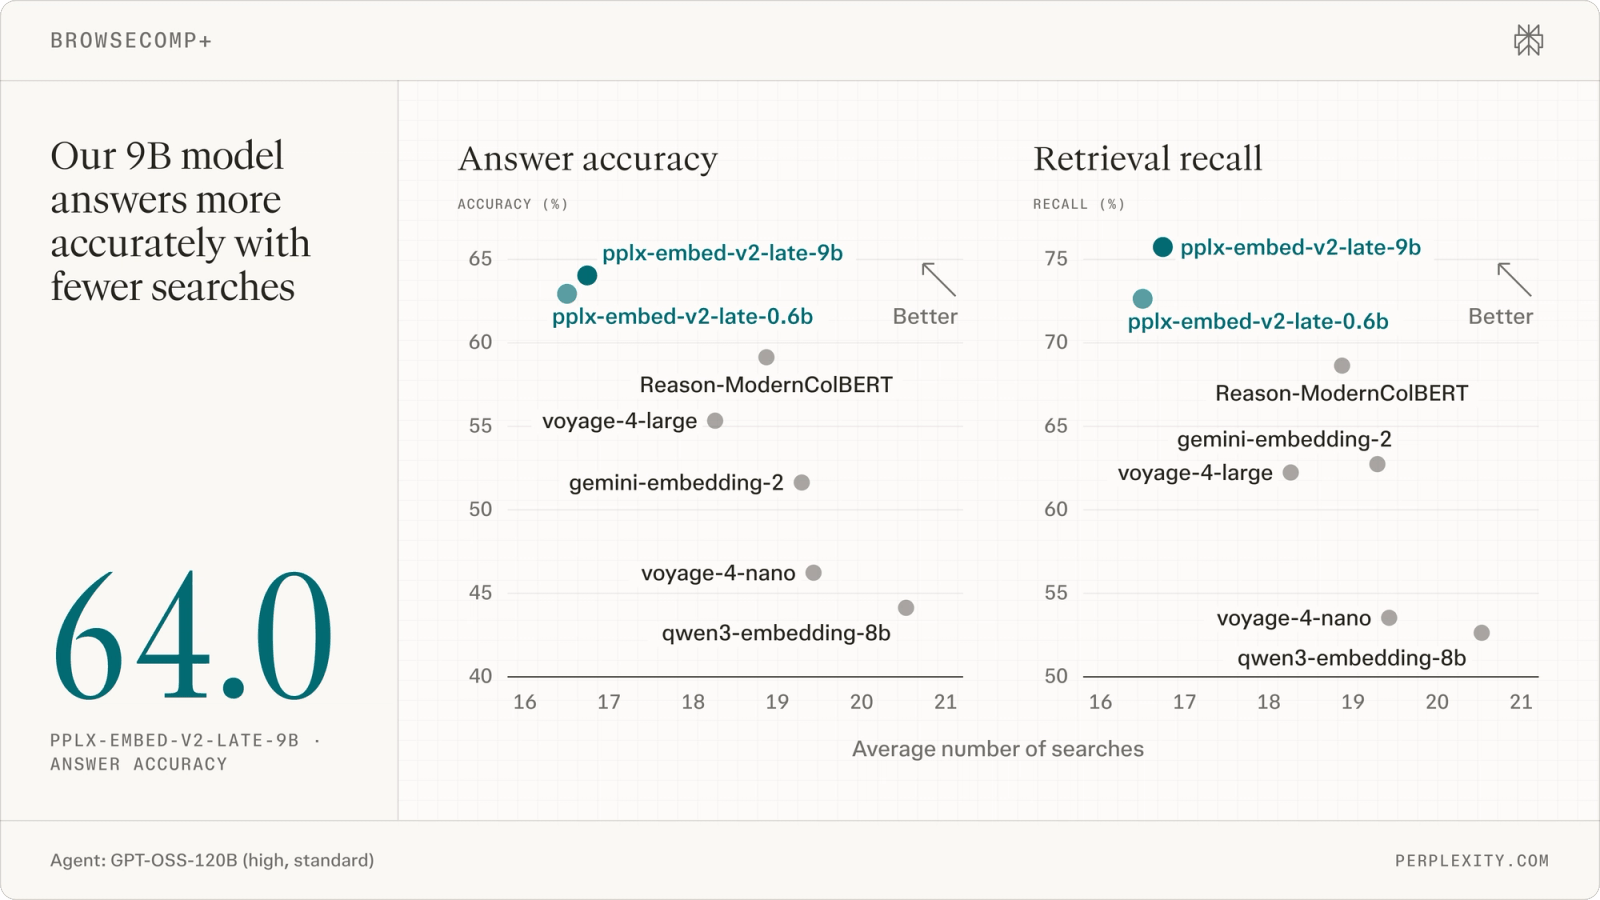
The agentic results are the ones I find most interesting, because they measure the thing late interaction is supposed to help with: an agent issuing many short, specific queries. On BrowseComp+, with GPT-OSS-120B doing the searching, the 9B gets 64.0% of questions right, 4.9 points ahead of the next ColBERT model (Reason-ModernColBERT) and 8.7 ahead of the best dense one, and the two pplx models need the fewest searches on the chart. A better retriever ending an agent's loop sooner is a real cost saving that a recall table doesn't show.
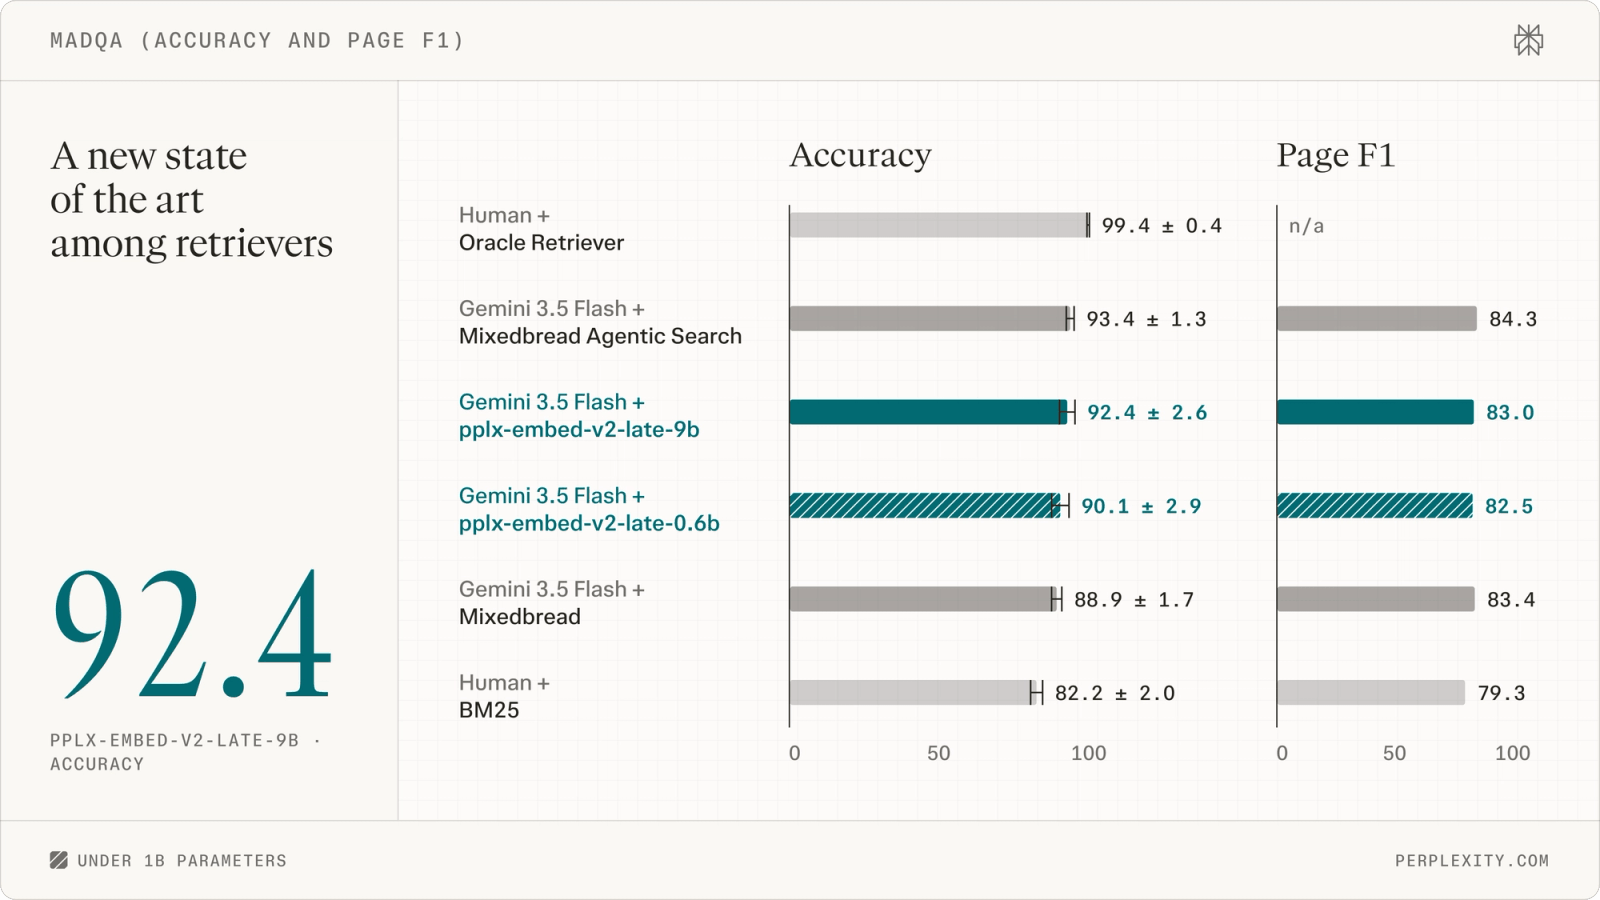
MADQA is 500 human-written questions over 800 PDFs (more than 18,000 pages), answered by a Gemini 3.5 Flash agent using the retriever under test. The 9B reaches 92.4% and the 0.6B 90.1%, against 88.9% with Mixedbread's retriever and 93.4% for Mixedbread's agentic search, which runs its own planning sub-agent. Perplexity calls the 9B "a new state of the art among retrievers." On the point estimate it is. But the chart prints the error bars: 92.4 ± 2.6 against 88.9 ± 1.7, so the ranges overlap, and on page F1, the measure of whether the agent found the right evidence pages, Mixedbread's retriever is slightly ahead, 83.4 to 83.0. I'd call that a tie on retrieval quality with a lead in answers that 500 questions can't confirm.
What I'd do with it
If you are indexing PDFs, slide decks or scans and today you run OCR into a text embedder, this is the most practical open option I know of for skipping the OCR step. It is MIT-licensed, it loads in stock Sentence Transformers, and the 0.6B is small enough to try on a laptop:
# pip install 'sentence-transformers>=6.0.0' 'transformers>=5.4.0'
from PIL import Image
from sentence_transformers import MultiVectorEncoder

model = MultiVectorEncoder("perplexity-ai/pplx-embed-v2-late-0.6b",
                           model_kwargs={"torch_dtype": "bfloat16"})
pages = model.encode_document([Image.open("page-001.png").convert("RGB")])
q = model.encode_query(["which clause sets the limitation period?"])
print(pages[0].shape)               # (vectors, 128): about 1,700 for a 150-dpi page
print(model.similarity(q, pages))   # MaxSim
The deployment I'd pick is the one Perplexity recommends: index with the 9B on a GPU box, query with the 0.6B wherever the query arrives. You pay for the 9B once per document and get about half its quality lead for free, with no change in index size.
Then budget the index before you commit. At about 1,700 vectors a page, storage is the real cost of this design, and the release gives you no compressed variant and no numbers on how pooling or 2-bit residuals affect it. Plan to measure that yourself on your own pages, and to render them at the lowest resolution your retrieval quality tolerates. For general web-text search, where a page of prose is a few hundred tokens and you need billions of documents, a single-vector model with an ANN index is still the economical choice; the post itself positions late interaction as a quality-sensitive first stage or a later stage in a larger pipeline. For more on the single-vector side of that trade, see EmbeddingGemma 2, where Qdrant squeezes 768 dimensions to 40 bytes, and TurboVec for what quantised ANN search costs. If you are still deciding whether you need embeddings at all, BM25 is a fair baseline to beat first.
One wording note to close on, the one I mentioned earlier. The post says these are "the first to
combine" multi-vector representations, text and image input, and a shared space across sizes. The
first two together are not new: the topk-embed-v1 models on Perplexity's own charts are 128-d
multi-vector retrievers scored on both text and page images. The claim only holds with the third, and the third is the one that is
genuinely new.
How I checked
- Parameters. Read both
model.safetensorsheaders and both1_Dense/model.safetensorsheaders from the Hub with range requests (8 bytes for the length, then the JSON), summed every tensor's shape and grouped by prefix (language_model.embed_tokens,visual, the rest). All tensors are F32. The 9B file size, 33,570,869,768 bytes, is from the Hub'sx-linked-sizeheader. - Configs. Read and diffed every config in both repos:
config.json,modules.json,1_Dense,2_MultiVectorMask,3_Normalize,config_sentence_transformers.json,sentence_bert_config.json,processor_config.json,tokenizer_config.jsonand the chat template. Compared the backbone shapes withQwen/Qwen3.5-9BandQwen/Qwen3.5-0.8B's configs. - Code. Read Sentence Transformers'
MultiVectorMask,maxsimandHierarchicalTokenPoolingat the main branch on 7 October 2026 (version 6.2.0.dev0), and transformers'modeling_qwen3_5.py,masking_utils.py,integrations/sdpa_attention.py, theis_causalhandling inutils/generic.py, andsmart_resizeinimage_processing_qwen2_vl.pyat main on 8 October 2026. The vector counts per image come from running thatsmart_resizearithmetic on the configuredmax_pixels, not from encoding images. - Benchmarks. Every score is Perplexity's, from the launch post's prose and its ten charts, which I downloaded and checked against each other. The ratios (half the gap, 41%, 26 times) are my arithmetic on those numbers and on the configs. The thread on X adds nothing beyond the post.
- Not checked. I did not run either model, so I have not confirmed the vector counts end to end, measured quality under float16, pooling or compression, or tested the reverse cross-model pairing. The contamination exclusion, the 18B teacher and which twelve layers the 0.6B kept are as stated by Perplexity.