2026-10-23 · 17 min · webgpu · small-models · browser-ml · performance · benchmarks · developer-tools
A 1:59 narrated explainer, drawn in code. Every number and picture in it is this article's own; the sources are below.
› transcript
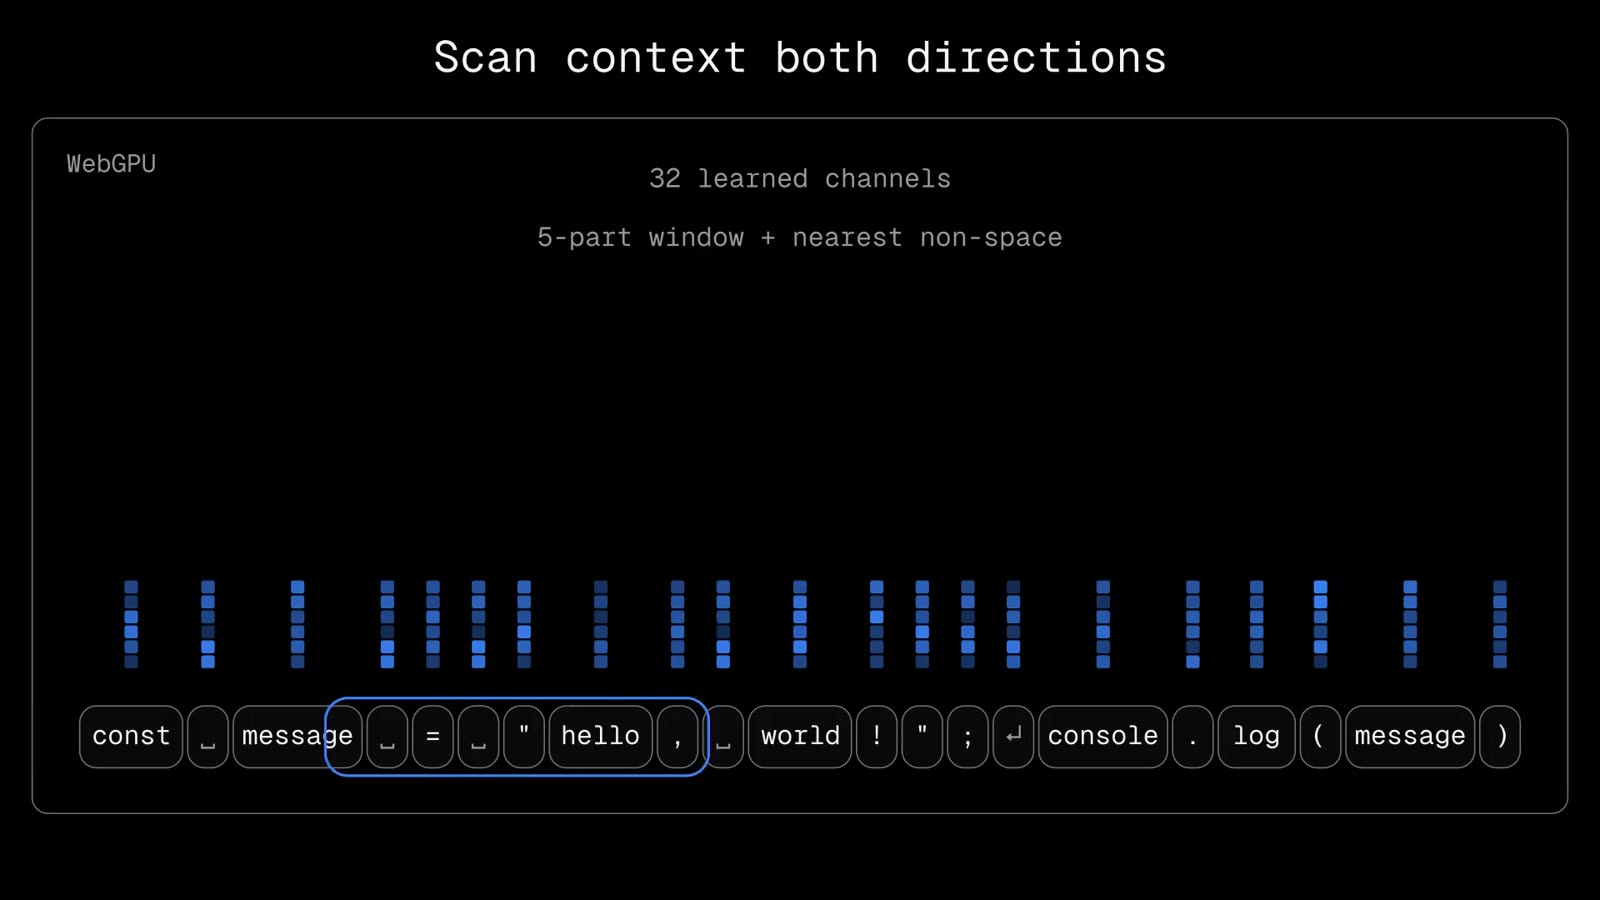
Hi, I'm Dovetail! Today: a highlighter with no grammar that colours a whole file at once. Treat code as a one dimensional image, and label every part in parallel. A normal lexer walks one character at a time, with a grammar per language. gpu-lexer is never told the language, and labels every part at once. One CPU pass splits the source into words, spaces and symbols. On the GPU, each part becomes thirty two learned channels. A learned scan carries context in both directions. A tree merges blocks into one file summary, then sends it back down. Every part gets one of nine classes, and equal neighbours merge into spans. Here is the formula. The gate a decides how much old state survives. b is what the current part writes in. Two of these maps in a row are still one map, so any stretch of code shrinks to two numbers per channel. Cut the parts into blocks of thirty two. Fold every block into one pair, all at once. A short scan tells each block where it starts. Each block replays from its true start. Here is the tree from Shu Ding's animation. Whole file context comes back down to every part. On five and a half million characters, gpu-lexer takes about two hundred and twenty milliseconds. Highlights takes about seventy five. And the three point eight times? Measured the same way before and after, the code is worth one point three seven. These maps compose into maps of the same size, so the scan never grows. Code as an image, one scan, one tree. Every source is in the full article. I'm Dovetail. Bye!
Why read this
Hightop 30%Reads gpu-lexer's scan kernels, shows its 3.8x is 1.37x of code plus a re-measured baseline, and runs a parallel-prefix lexer against a sequential one.
- Checked against the source
- Runs in a browser
- A lasting reference
GPUs, kernels & systemsMITPractitioner teardown
How this was scored
- Is it new?
- 2 of 3: A real new idea, method or capability
- Can I trust it?
- 3 of 3: Reproduces the headline result, or shows from primary files it is wrong
- Can I run it?
- 2 of 3: Open code or weights with real limits
- Will I understand it?
- 2 of 3: Mechanism from first principles with figures
- Can I act on it?
- 2 of 3: A concrete recipe, numbers or comparison
- Will it last?
- 2 of 3: A reference for a year or more
- Does it affect many?
- 1 of 3: A specialist community
- Only here?
- 2 of 3: A teardown or measurement few others did
Score 73 of 100, ranked 77 of 607 rated articles. Each question is answered 0–3 by hand, and a 3 is rare. How articles are scored
On 22 October Shu Ding posted that he had made gpu-lexer "3.8x faster: 850ms → 221ms", added that it is "still far behind" Pierre's Highlights, and linked an essay, Ideas Behind GPU Lexer. I covered gpu-lexer once already, as the seed of a cluster of tiny browser models. This piece is about the two things that article did not take apart: how a lexer runs in parallel at all, and what the 3.8x actually measures.
Short version, each part labelled:
- The parallelism is an affine scan, not a state machine. Each of 32 channels follows . Two such steps compose into one step of the same shape, so a block of any length folds into two numbers per channel and a scan stitches the blocks together. (Read from
tree-shader.js; the closure argument is reasoned.) - The 3.8x is two measurements, not one. 850 ms is a single sample from 16 September; 220.5 ms is a median of three fresh workers from 22 October. Run the same way before and after, the code change is 290 ms to 212 ms, about 1.37x. (Reported numbers, my division.)
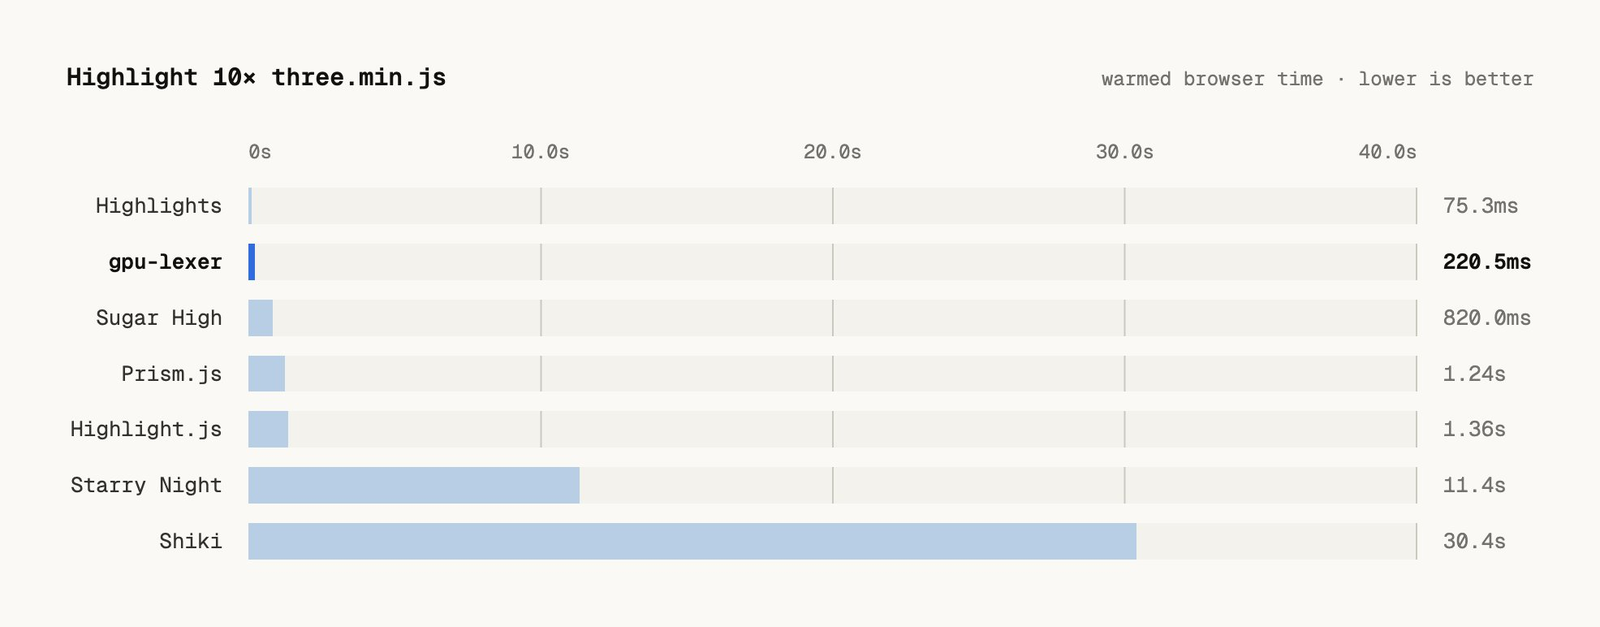
- Highlights is a different design entirely: one hand-written WebAssembly lexer per language, sequential, with SIMD scans for the boring stretches. On the same input it took 75.3 ms in gpu-lexer's own run, against gpu-lexer's 220.5 ms. (Reported.)
- A parallel-prefix lexer pays for its parallelism in work. My 11-state DFA lexer on CPU did about 10.5x the sequential work in its parallel phase, and about 4.4x after merging start states that converge, because quote parity never forgets. (Measured.)
The workload: ten copies of three.min.js
Every number in the post is the same stress test. The input is three.min.js from three.js r97, concatenated ten times: 555,650 characters a copy, 5,556,500 in total. I downloaded it from the URL in the benchmark report and its SHA-256 matches the report's 3ed7c931… (measured). The time is one warmed parse() call in a dedicated worker, DOM rendering excluded, on an Apple M4 Pro with a 20-core GPU (reported, packages/benchmark/reports/browser-performance-2026-10-22.json).
It is a large minified file: lots of independent work for one GPU dispatch. Asked on X why lexing takes 220 ms at all, Shu Ding replied that "Running just a RegExp on it would take 10ms" (reported).
How gpu-lexer works
The essay frames the problem as image segmentation in one dimension. Split code into its smallest parts, treat each part as a pixel, and label every pixel. The architecture doc fills in the rest:
- One CPU pass splits the string into word runs, whitespace runs, newlines and single symbols, and packs each part's features into two
u32s: kind, a log length bucket, first and last character, two word hashes, line-start and shape flags, and neighbouring-symbol hashes. No grammar, no regex table. - On the GPU, sparse features are summed into a 32-channel vector per part, mixed with a five-part window and the nearest non-whitespace neighbours.
- Learned affine state updates scan the sequence in both directions.
- A binary tree merges 32-part blocks bottom-up into one whole-file summary, then pushes context back down.
- A classifier with 72 hidden units gives each part one of nine classes, and adjacent equal labels merge into spans.
- license
- MIT
- branch
- main
- tests
- 43 files
- source
- 1.2 MB
- commit date
- 2026-10-22
by size of tracked source at this commit, file counts in brackets; docs, data and vendored trees excluded
local clone, 2026-10-23 at 4f36e39 — branch, commit, commitDate, fileCount, hasTests, languages, license, licenseFile, testFileCount
The weights are 41,321 six-bit integers, and the whole package is about 28.6 KB with Brotli after this week's change: 28,580 bytes in the README, 28,599 in the size benchmark (reported).
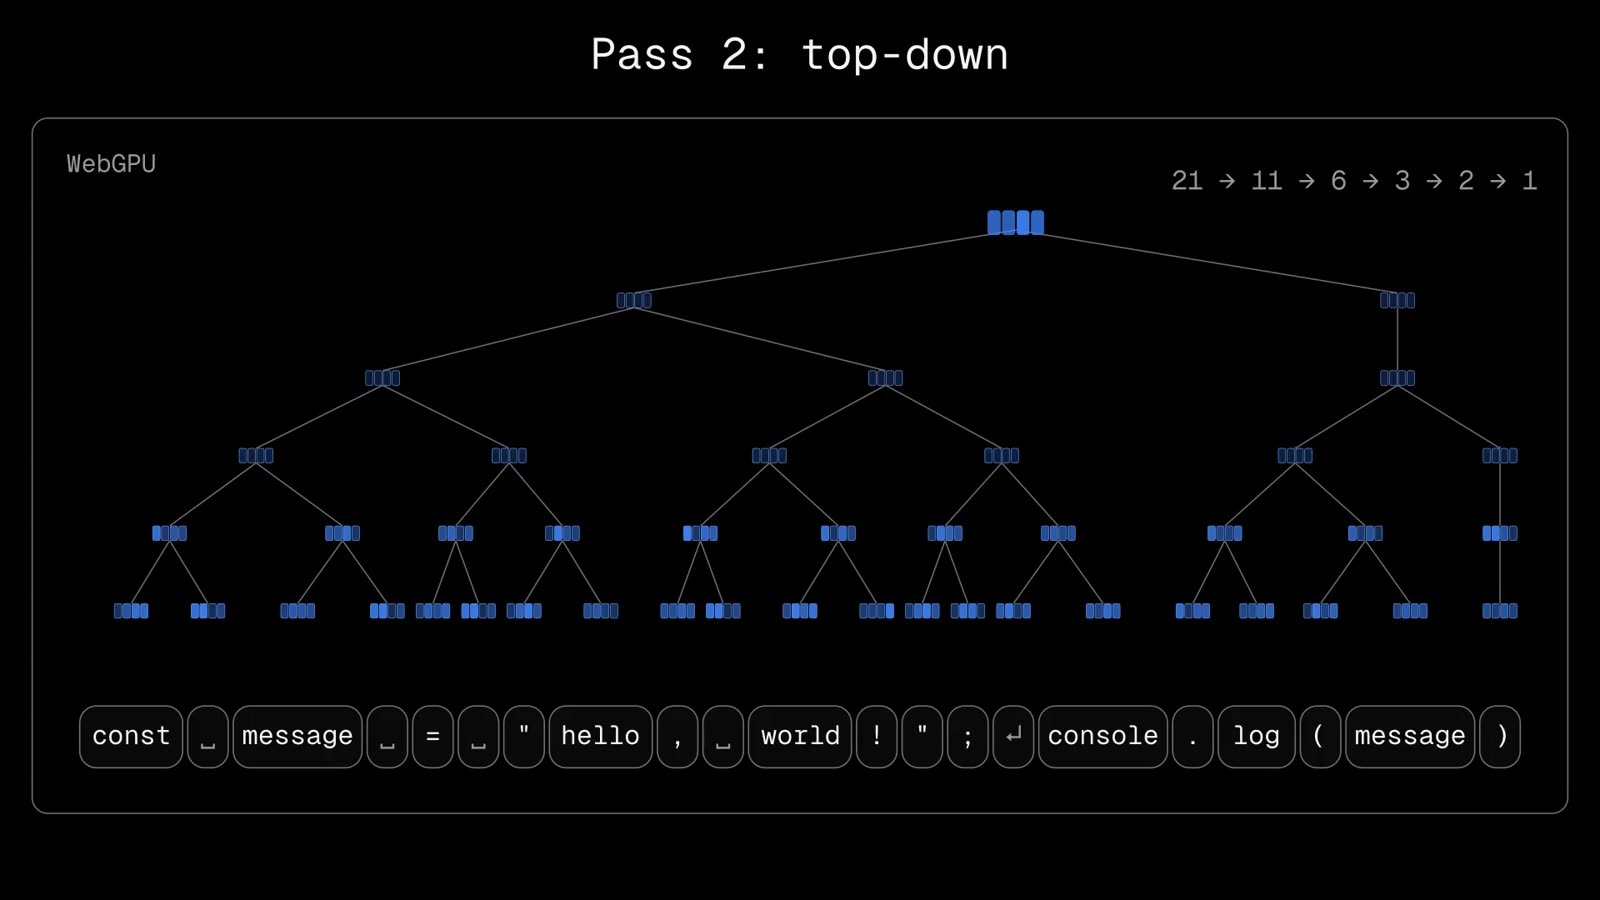
Step 3 is the part that answers "how do you lex in parallel", so it gets its own section.
Why a lexer looks sequential
A conventional lexer is a loop with a state variable: inside a string, inside a comment, in code. Whether the * at byte 4,000,000 is multiplication or the end of a comment depends on everything before it. Each state needs the previous one, which is a dependency chain the length of the file.
The classical escape is to stop carrying a state and carry a function instead. For a DFA with states , each chunk of input defines a transition table , "if you enter in state , you leave in state ". Function composition is associative, so the state at every chunk boundary is a prefix scan over those tables, and a scan finishes in parallel rounds (Hillis and Steele, 1986). Once each chunk knows its start state, every chunk re-lexes itself independently.
The widget runs that algorithm exactly on a six-state toy grammar: code, a pending /, a block comment, a pending * inside it, and two kinds of string. Each chunk becomes a table of six arrows. The scan composes them in rounds and reads off each chunk's real start state. Then every chunk re-lexes from that state. Press "skip the scan" and each chunk assumes it starts in code. That is what chunked lexing without a scan does, and a quote or a /* in an earlier chunk then colours later characters wrong.
I wrote about the cost of doing this for real grammars in Lexing on the GPU. Pareas, a GPU compiler, does exactly this, and its precomputed composition table grows from 7.4 MB to 126.5 MB when a single string rule is added (measured there). The trouble is that composed tables do not stay small. A string introduces a mode, compositions stop collapsing, and the number of distinct functions explodes.
What the DFA scan costs on CPU
I ran the same algorithm on the benchmark input, in JavaScript on Node 22, single-threaded, on a shared 4-core cloud VM (dfa-scan.mjs, an 11-state DFA covering code, // and /* */ comments, three quote styles and escapes; regex literals ignored, so it is a toy, not a JavaScript lexer). Medians of five runs, measured:
| Phase, 5,556,500 characters | Time |
|---|---|
| Sequential walk, one state | 18.3 ms |
| Phase 1: each of 4,096 chunks run from all 11 start states | 193 ms |
| Phase 1, merging start states once they converge | 80.1 ms |
| Phase 2: scan over 4,096 tables | 1.33 ms |
| Phase 3: re-lex every chunk from its true start | 16.9 ms |
The output matched the sequential walk on all 5,556,500 characters, and the converged tables matched the full ones exactly (measured, zero mismatches). The scan itself is nearly free. The cost is phase 1: running every start state costs about 10.5x the sequential work (reasoned, 193 / 18.3), or 4.4x with merging, and that is what a parallel machine has to amortize before it wins anything.
Merging start states helps, but less than I expected. I sampled 2,000 random offsets and ran all 11 states forward. After 4,096 characters, an average of 3.05 distinct states were still alive (measured). Start states that differ only in whether you are inside a string never merge: every " swaps "in a string" and "in code", so a chunk cannot know which side of a quote it is on without its prefix. Quote parity is the part of lexing that refuses to be local.
gpu-lexer's scan: an affine map instead of a table
gpu-lexer sidesteps the table problem by not scanning a DFA at all. Its state is 32 floating-point channels, and each part updates each channel with a gated linear step. From affine_at in packages/core/src/tree-shader.js:
let a = sigmoid(gate);                       // in (0, 1)
return vec2<f32>(a, (1.0 - a) * tanh(input)); // the pair (a_t, b_t)
and the state update is . Both and are computed from the part's own local features, not from . That is what makes the step an affine map of the previous state, and affine maps have the property DFA tables lack: composing two gives another affine map of exactly the same size,
A block of 32 parts, or a million, summarizes to one pair per channel. There is no closure to precompute and nothing that grows with the grammar. This is the same trick as the selective scan in Mamba, applied to lexing.
The kernels split it into three passes, which I read off the shader:
hybrid_scan_blocks: one workgroup per 32-part block. Each channel folds its block serially into a forward and a reverse pair, so the scan runs in both directions.hybrid_scan_prefixes: per stream, 32 lanes take 32 block pairs and run a Hillis-Steele inclusive scan in five doubling rounds, carrying the total into the next 32 blocks. Each block then knows the exact state it starts from.hybrid_mix_tree_up: each block replays its 32 steps from that carried start, then feeds the tree.
The architecture doc puts it in one line: "block boundaries do not reset context".
The widget runs that on one channel with hand-picked gates: a quote that looks like an opening (after =, ( or a space) writes +1, one that looks like a closing writes −1, everything else leaks the state slowly. Change the block size and the block pairs change, but the replayed states do not.
I checked the exactness claim numerically (affine-scan.mjs, measured). On 1,000,000 random gated steps in float32, the blocked scan with gpu-lexer's block size and lane count differs from a plain serial loop by at most , one float32 rounding step near 1. Both sit within of a float64 reference. Because the recurrence is contractive, so re-associating it does not let errors grow. That agrees with the repository's own parity test: the new kernels produced zero label mismatches across 5,028 corpus files and 5,979,352 spans, in both f16 and f32 (reported).
What the affine scan gives up
There is a catch, and it is the same quote parity that kept my DFA from converging. With and independent of the state, a channel cannot flip its sign at a quote. It can only overwrite itself ("I just saw something that looks like an opening quote") or decay. So the scan cannot count quotes. Whether a " opens or closes a string has to come from local evidence, like the character before it, plus whatever the tree pass adds (reasoned). That is the price of a scan that stays two numbers wide. It is also consistent with the accuracy being high but not perfect: 86.8% agreement with Shiki on the site's popularity-weighted measure, against 84.1% for Prism.js and 70.1% for Highlight.js (reported, essay), and 83.02% per-part on the held-out corpus (reported, README). I have not checked which classes the errors land on.
Where the 3.8x came from
Here is what the two numbers in the post are:
| 16 September | 22 October | |
|---|---|---|
| gpu-lexer | 850 ms | 220.5 ms |
| Samples | 1 warm-up, 1 measured call | median of 3 fresh workers |
| Browser | Chrome 152 | headless Chrome 156 |
| Prism.js | 8,391.9 ms | 1,238.1 ms |
| Highlight.js | 15,906.7 ms | 1,364.0 ms |
| Sugar High | 4,829.6 ms | 820.0 ms |
| Starry Night | 72,312.8 ms | 11,356.1 ms |
| Shiki | 33,096.7 ms | 30,438.8 ms |
All reported, from the two browser-performance JSON files in the repository. The ratio 850 / 220.5 is 3.85 (reasoned), so the headline arithmetic holds. But four of the five comparison libraries also got 5.9x (Sugar High) to 11.7x (Highlight.js) faster between those runs, with the same versions and no code change; only Shiki barely moved, at 1.09x (reasoned). The October report says so itself: "Re-measured comparison libraries were 4-12x faster than that run under the same versions … so the earlier figures were not representative."
The controlled comparison is in the same file. The same runner, run on the old commit 07f3e56 and the new tree, five fresh-worker samples per series, gives medians of 289.6 and 290.2 ms before and 212.1 and 212.8 ms after (reported). That is about 1.37x (reasoned, 290 / 212). So of the 3.85x, the code accounts for roughly 1.37x and the measurement change for roughly 2.8x (reasoned, 3.85 / 1.37).
The 1.37x is still a real optimization, and the commit (c82583f) says where it came from:
- Column-major weights for every matrix read across output units, so adjacent threads read adjacent weights. The commit message credits this alone with GPU time going from 176 to 119 ms on the same input (reported).
- Recompute instead of round-trip: local states are rebuilt in workgroup memory by the scan and mix passes instead of being written to a part-by-hidden FP32 buffer and read back. GPU allocation for the 10-copy input fell from 891 to 220 MiB (reported).
- A parallel workgroup scan for neighbour prefixes, which finds the nearest non-whitespace part across block boundaries, and shared tree levels in the classifier.
- Table-driven CPU preparation, about 33% faster (reported).
Nothing changed in the model; the checkpoint is the same 20260916T055435.785Z in both reports. Someone in the replies asked how the 221 ms splits between the CPU split and the GPU. The repository does not publish that split for this input, so I cannot say.
One more data point shows how noisy these numbers are. The pre-optimization runtime has been timed on this input at 557.85 ms (the architecture doc's repeated benchmark on 16 September, 18 calls with ABBA ordering, Chrome 152), at 400.8 ms (Pierre's run of 0.0.2 on 21 October, Chromium 153, diffs.com/highlights/benchmark-browser.json), and at about 290 ms (the October before/after, commit 07f3e56, Chrome 156). All reported, all on an M4 Pro, and none of them is the 850 ms single sample. Browser timing of a GPU workload moves with the browser build and the harness.
How Pierre's Highlights differs
- license
- Apache-2.0
- branch
- main
- tests
- 424 files
- source
- 11.9 MB
- commit date
- 2026-10-23
by size of tracked source at this commit, file counts in brackets; docs, data and vendored trees excluded
local clone, 2026-10-23 at 99c8881 — branch, commit, commitDate, fileCount, hasTests, languages, license, licenseFile, testFileCount
Highlights is close to the opposite design. From its repository and its ARCHITECTURE.md:
- Hand-written lexers, one per language, in WebAssembly Text. Its README lists 84 languages. Each lexer reads UTF-8 bytes with a cursor and emits token ranges in order. It classifies "from nearby tokens and saved state" without building a syntax tree.
- Sequential, but wide where it can be. The scanning helpers use 128-bit SIMD.
$scanToLineEndcompares 16 bytes at a time against\nand\r, and$scanBlockCommentEndfinds*/across vector boundaries. I counted 63 lines usingv128ori8x16operations inscan.watalone (measured, with grep). - Saved state instead of a scan. For streams and live documents it saves the lexer state after each line, re-lexes only dirty lines, and stops when the state matches the saved one. This is the incremental answer to the same "where am I?" problem the prefix scan solves in bulk.
- Deterministic, written per language. It does not guess, which is why the gpu-lexer essay uses it, alongside Shiki, as a reference for its correctness chart.
On the benchmark input, Highlights took 75.3 ms in gpu-lexer's run and 81.6 ms in Pierre's (reported). That makes it about 2.9x faster than gpu-lexer (reasoned, 220.5 / 75.3) on a workload chosen to favour the GPU. It is also larger: 98,187 bytes with Brotli for all its languages, against gpu-lexer's 28,599 (reported, gpu-lexer's size benchmark). That is the trade in one line. Highlights spends bytes on per-language lexers and gets determinism and speed; gpu-lexer spends accuracy and gets one 28 KB model for every language, including ones nobody wrote a grammar for.
The comparison is not quite like for like. Highlights is told the language (lang: "javascript") and returns themed tokens. gpu-lexer is told nothing and returns nine-class spans (the benchmark notes say so).
What I ran
Everything below ran on a shared 4-core cloud VM with no GPU, CPU only, at low priority behind other jobs.
The two scans on CPU. dfa-scan.mjs (about 100 lines) and affine-scan.mjs (about 40) are plain JavaScript on Node 22.22.0; their numbers are in the sections above.
Both gpu-lexer releases, and Highlights, in headless Chromium. I loaded the published npm builds of gpu-lexer 0.0.3 (before the optimization) and 0.0.4 (after), plus @pierre/highlights 0.2.0, into module workers in Playwright's headless Chromium 141 with WebGPU enabled. The adapter it handed out was SwiftShader: architecture: "swiftshader", isFallbackAdapter: true, no shader-f16 (measured). That is Google's software Vulkan, running the compute shaders on the CPU. The input was one copy of three.min.js, 555,650 characters, timed the way gpu-lexer's runner times it: one warm-up call, then one timed call, in each of three fresh workers.
| One copy of three.min.js, SwiftShader | Median of 3 | Samples |
|---|---|---|
| gpu-lexer 0.0.3 | 71,561 ms | 64,095 / 78,940 / 71,561 |
| gpu-lexer 0.0.4 | 72,426 ms | 66,595 / 74,794 / 72,426 |
| Highlights 0.2.0 | 63.7 ms | 122.2 / 57.2 / 63.7 |
All measured. Three things in that table:
- It runs. The shaders compile and execute on a software adapter, and both releases return the same 180,444 spans for the file. I hashed every
(type, start, end)triple in a separate run: the two releases agree on all of them (measured), in f32, since SwiftShader offers no f16. That is a small, independent echo of the repository's own parity test on a single file. - The optimization does nothing here. 0.0.3 and 0.0.4 are within noise of each other; the spread inside each row is wider than the gap between rows. That fits what the commit changed: coalesced weight reads and less buffer traffic help a real GPU's memory system, and SwiftShader is a CPU running shader code.
- Without a GPU, the design is a non-starter. gpu-lexer was about 1,100x slower than Highlights on the same input (reasoned, 72,426 / 63.7). The architecture doc warns about this: "WebGPU is most useful for warm, large, or batched inputs".
I did not run ten copies; at this rate one call would take more than ten minutes. I also could not reproduce 220.5 ms or 75.3 ms, because I have no Apple M4 Pro. Those stay reported.
The take
The interesting idea in gpu-lexer is not "neural network replaces grammar". It is that the network's sequence model is scannable. A state update that is affine in the previous state has a property a DFA table lacks: any run of steps composes into one step of the same size. That is exactly what a GPU needs: fold blocks independently, scan a few pairs, replay. A DFA has the scan but not the fixed size, and Pareas shows what happens to its tables. Highlights keeps the hand-written lexer's determinism and gives up the scan, then makes the sequential pass fast with SIMD and the incremental pass cheap with saved states.
The 3.8x is honest arithmetic on two published numbers, but it is mostly a better benchmark. The engineering improvement is about 1.37x, with a 4x drop in GPU memory, and it is well documented in the commit. If you are choosing a highlighter today: Highlights is faster, and rule-based, for the 84 languages it knows. gpu-lexer is the one that needs no grammar and no language id, and accepts some wrong colours for that.