2026-10-07 · 27 min · kernels · triton · cuda · gpu · training · performance

Why read this
Notabletop 60%Reads Meta's Triton TBE against FBGEMM's CUDA: the 2x is a tail, the typical backward is 1.13x, and most of the win is one threshold moved from 32 to 256.
- Original analysis
- A lasting reference
- Concrete numbers to act on
GPUs, kernels & systemsNeeds datacenter GPUsBSD-3-ClausePractitioner tool
How this was scored
- Is it new?
- 1 of 3: An incremental tweak
- Can I trust it?
- 2 of 3: Measures key facts from files, code or configs
- Can I run it?
- 1 of 3: API-only, gated or restrictive licence
- Will I understand it?
- 2 of 3: Mechanism from first principles with figures
- Can I act on it?
- 2 of 3: A concrete recipe, numbers or comparison
- Will it last?
- 2 of 3: A reference for a year or more
- Does it affect many?
- 1 of 3: A specialist community
- Only here?
- 2 of 3: A teardown or measurement few others did
Score 58 of 100, ranked 268 of 454 rated articles. Each question is answered 0–3 by hand, and a 3 is rare. How articles are scored
The PyTorch account posted that replacing CUDA with FBTriton for the table-batched embedding kernels gave Meta "up to 1.28x faster forward passes, 2x faster backward passes, and a huge boost in developer velocity". That is a strong claim about the one operator every large recommender is built on, and the kernel it replaces is not a naive one. FBGEMM's TBE has been tuned for years. So I wanted to know where a 2x could come from in a kernel that does no matrix multiplication at all.
The answer turned out to be narrower and more interesting than the headline. The engineering post itself, by Daohang Shi, Oleksandr Stashuk, Rupert Wu, Liangbei Xu and Rich Zhu, never says 2x for the backward. Its own chart puts the median at 1.13x for unweighted tables and 1.22x for weighted ones. The large gains live in one band of run lengths, 32 to 255 lookups per embedding row, and the reason is that CUDA TBE changes strategy at 32 while Triton TBE waits until 256. I went and found that 32 in FBGEMM. It is one constexpr.
That does not make the work less good. The Triton code is careful, well commented, and full of measured numbers. But it changes what the result means, and it is worth being exact about.
I read the post and all eight of its figures, then shallow-cloned three repositories: TorchRec at 37c6943, where the Triton TBE actually lives, FBGEMM at c297b97, which holds the CUDA templates it replaces, and Meta's Triton fork at 0e7d779. I have no Blackwell GPU, so every timing below is Meta's.
A lookup table that is most of the model
A recommender sees a user and a candidate item, and most of what it knows about them arrives as ids: the last fifty items clicked, the ad id, the advertiser, the country, the device. Each kind of id is a sparse feature, and each feature has an embedding table, a matrix with one learned row per possible id. Production tables run to millions or billions of rows. Their parameters dwarf the dense layers on top, which is why TorchRec shards them across GPUs.
A feature is not one id per sample. "Items clicked" is a list of any length, so the operator is an embedding bag: look up every id in the list and pool the rows, usually by summing, into one vector. PyTorch has had this as nn.EmbeddingBag for years.
Lists of uneven length are stored jagged. All ids go into one flat indices array, and an offsets array marks where each bag starts. The Triton TBE lays offsets out feature-major: bag (t, b), feature t of sample b, is indices[offsets[t*B + b] : offsets[t*B + b + 1]]. The forward kernel says exactly that:
# torchrec/distributed/triton_tbe/triton_table_batched_embeddings.py:1125-1130
b_t = t * B + b
...
start = tl.load(offsets_ptr + b_t)
end = tl.load(offsets_ptr + b_t + 1)
A model with forty features could launch forty EmbeddingBag kernels. Each would be tiny, memory-bound and launch-dominated. A table-batched embedding packs every table into one weight buffer, every feature's bags into one indices/offsets pair, and runs the lot as one kernel that writes a [B, sum of D] output, each feature's pooled vector at its own column offset. That single operator is what FBGEMM calls SplitTableBatchedEmbeddingBagsCodegen and what TorchRec calls a TBE.
Play with the toy below. It has three tables of different widths, a batch of three, and the same indexing the kernel uses.
Some bags are long, one is empty, and every sample shares a country.
Feature-major: bag (t, b) is indices[offsets[t·B+b] : offsets[t·B+b+1]]. Colour is the table. 12 lookups in 9 bags.
[B=3, ΣD=9]; bag lands at row 0, columns 0 to 3Pooled sum of 3 rows: row 1 + row 4 + row 1. A repeated id is simply added twice.
In the forward tab, pick a bag. Its slice of indices lights up, the rows it names are pulled from its table, and their sum lands in one row of the output at that table's column offset. The ad_id bag of sample 2 is empty, and its slot stays zero. A repeated id is added twice. Nothing about the forward is hard. It is a gather and a sum, and its speed is how fast you can pull rows out of HBM.
The forward: a general gather and one clever special case
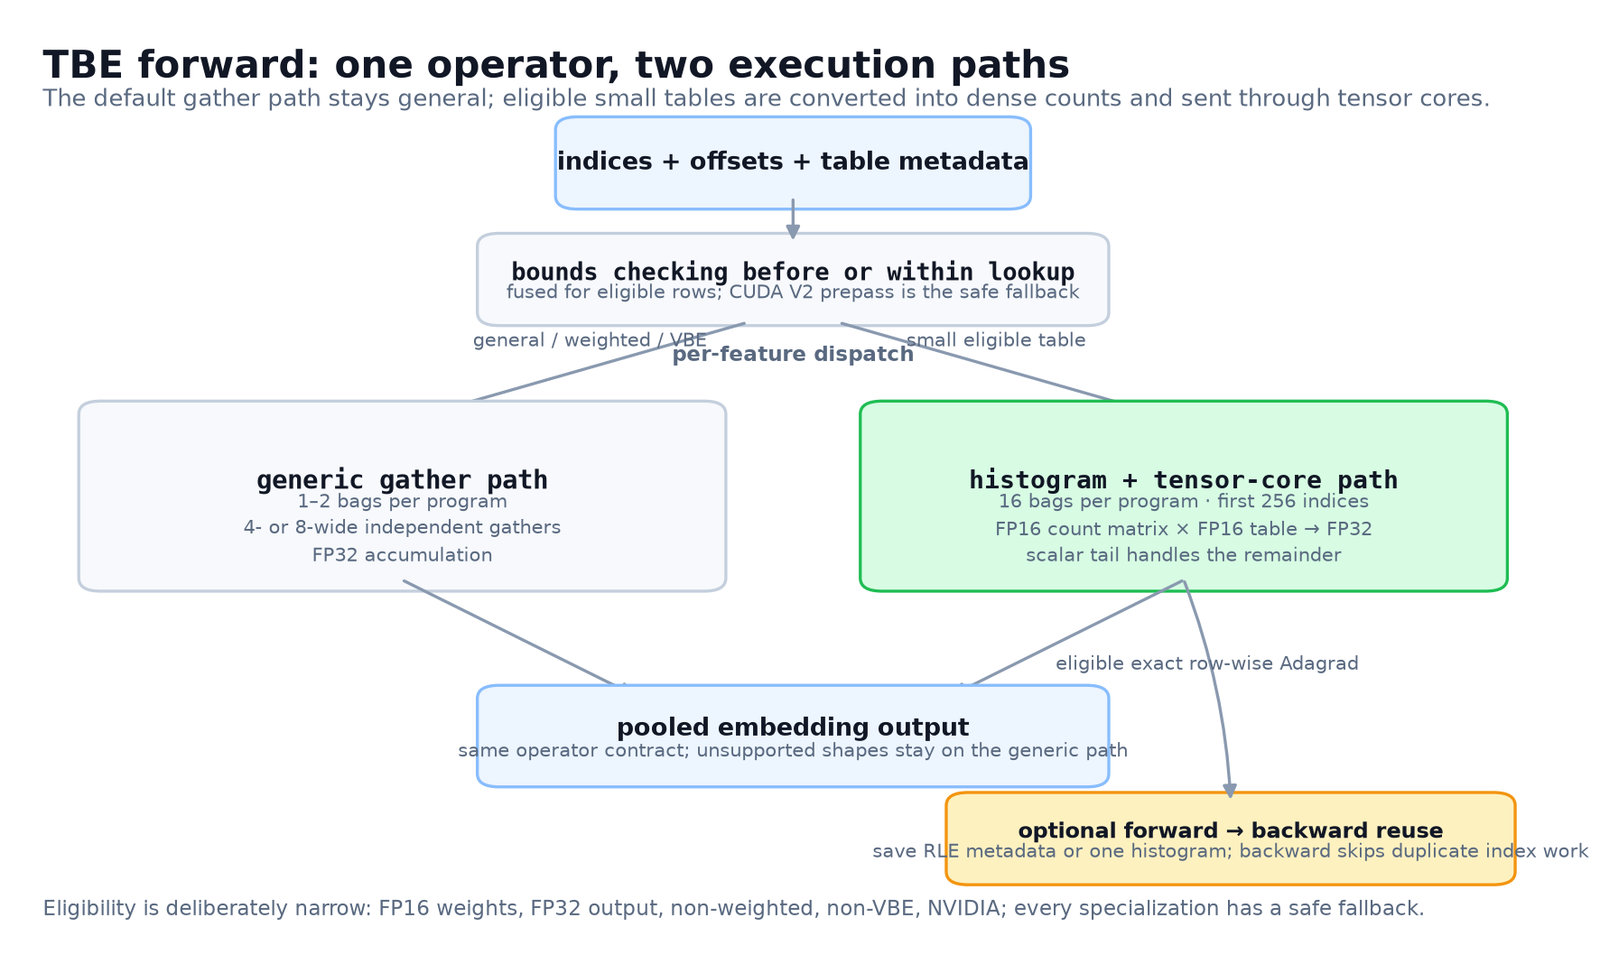
The generic path launches ceil(B / BAGS_PER_PROGRAM) programs, and each one loops over all T features rather than launching a B x T grid. Inside a bag, the loop issues four independent row loads per iteration, or eight on the tuned two-bag path. Independent is the point. A row gather is a chain of dependent loads (read the index, then read the row it names), and the only way to hide that latency on one thread of control is to have several chains in flight.
The special case is the part I liked best. For one feature with at most 64 rows, a width of 64 to 128, at least 64 ids per bag, FP16 weights and no per-sample weights, the kernel stops gathering. It builds a histogram of the first 256 ids of each of 16 bags and multiplies that count matrix by the whole table:
# triton_table_batched_embeddings.py:2117-2142 (abridged)
counts = tl.histogram(encoded_indices.reshape((bags_per_program * histogram_chunk_size,)),
                      bags_per_program * ROW_BINS, mask=...).reshape((bags_per_program, ROW_BINS))
...
table = tl.load(weight_ptr + table_offset + rows[:, None] * embedding_dim + columns[None, :], ...)
bag_output = tl.dot(counts.to(tl.float16), table)
A pooled sum is a weighted sum of table rows where the weight is how many times each row appears. When the table is small enough to sit in one tile, that is a [16, rows] x [rows, D] matrix product, and it runs on tensor cores. The counts go through FP16, which is exact here since a count is at most 256. Ids past the first 256 fall back to a scalar loop. It is the kind of rewrite that is obvious once you see it and that nobody does in a templated CUDA kernel, because it means a second kernel with its own eligibility rules.
One small thing in the post does not match the code. It says FP32 weights accumulate in FP64 "to preserve accuracy at large D". The code does that only when the optimization flag is off:
# triton_table_batched_embeddings.py:1132-1137
accumulator_dtype: tl.constexpr = (
    tl.float32
    if ENABLE_TRITON_TBE_OPTIMIZATIONS
    or weight_ptr.dtype.element_ty != tl.float32
    else tl.float64
)
With enable_triton_tbe_optimizations on, which is the configuration the tuned numbers come from, FP32 tables accumulate in FP32. The headline benchmarks used FP16 weights, so this does not touch them.
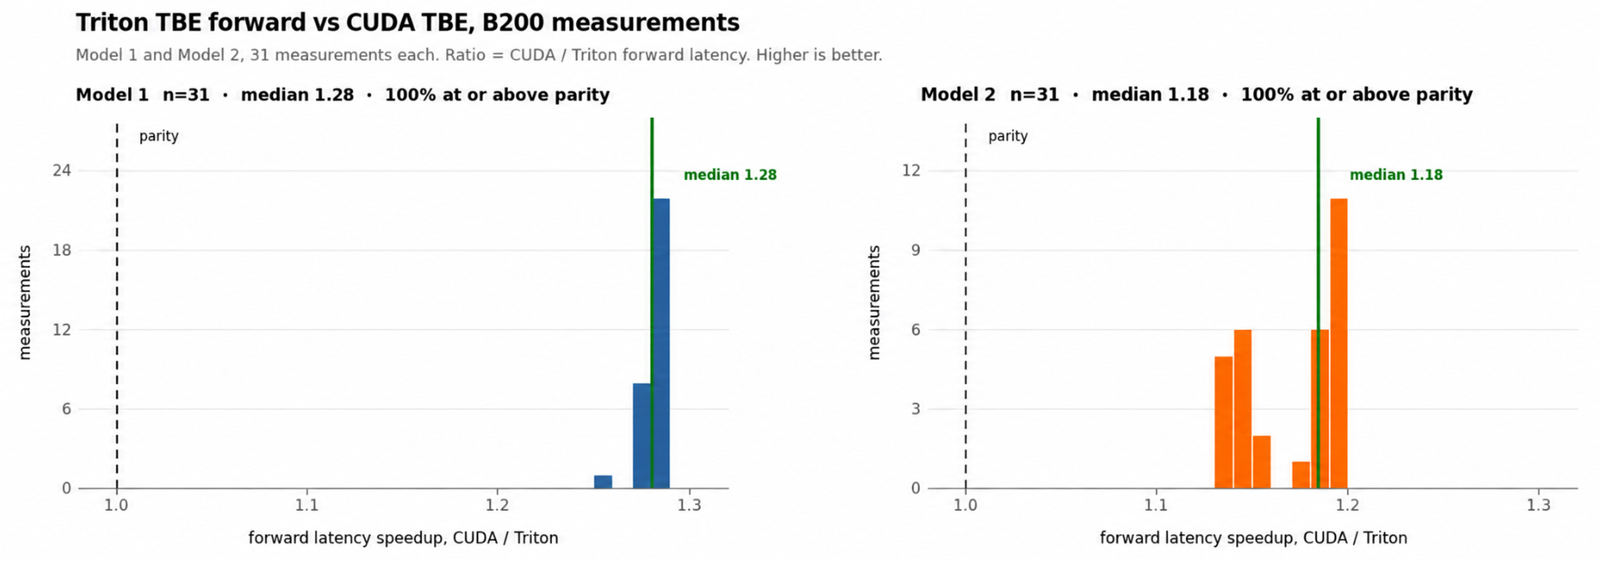
The forward result is solid and modest, and the chart and the text describe it differently. The text says the forward was measured on "307 shard configurations (283 distinct shapes) on GB200" with a median of 1.28x. The chart is labelled B200, shows two models with 31 measurements each, and has 1.28 as Model 1's median and 1.18 as Model 2's. Both are above parity everywhere, and "up to 1.28x" on X is a fair reading of the better model's median. I would quote 1.18 to 1.28.
Why the backward is the hard half
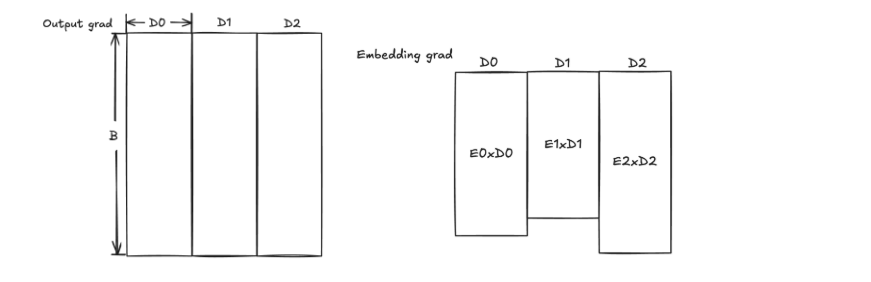
The backward has a strange shape. The gradient with respect to the embedding table is a matrix the size of the table, but almost all of it is zero. Only rows that some bag read in this batch get a gradient, and each such row's gradient is the sum of the output gradients of every bag that read it.
The post gives one batch's statistics, and they explain everything that follows. With T x B at 4.2M bags and B at 128K, there were 83M lookups, 3M distinct rows, and one row was hit 125K times. That is about 32 features, 20 ids per bag on average, and 28 lookups per distinct row on average. The average hides the problem. One row has 125K contributors. Most have a handful.
TBE also never hands the gradient back to PyTorch. Writing out a table-sized gradient tensor to let an optimizer read it would cost more than the backward itself, so the optimizer runs inside the kernel: as soon as a row's gradient is complete, the kernel applies the update to the weights and moves on. Triton TBE supports two optimizers, exact SGD and exact row-wise Adagrad, and the Adagrad update is short enough to read whole:
# triton_table_batched_embeddings.py:2409-2418
grad_square = grad_original * grad_original
grad_square_average = tl.sum(grad_square) / embedding_dim
momentum = tl.load(momentum_ptr + momentum_idx)
momentum_new = momentum + grad_square_average
tl.store(momentum_ptr + momentum_idx, momentum_new)
adaptive_learning_rate = learning_rate / (tl.sqrt(momentum_new) + eps)
row_update = row - adaptive_learning_rate * grad_original
One scalar of state per row, updated from the mean squared gradient of the row. This is why "exact" matters. The update is nonlinear in the gradient, so it must see the finished sum. Applying it once per contributing sample would be a different optimizer. FBGEMM's enum keeps both: SGD is documented as "non-deterministic updates (atomicAdd(..)) with duplicate ids", and EXACT_SGD as "deterministic updates (via sorting + segment reduction)".
Now the choice is plain. Switch the toy to the naive scatter tab: one thread per lookup adds its sample's gradient into the row it read. Every row read twice has two writers at the same address. With atomics the sum comes out right, in a nondeterministic order, and the 125K-way row serializes. Worse, no single writer knows when the row is finished, so there is nowhere to run Adagrad.
The alternative is to invert the batch. Sort every lookup by its row, and every row's contributors sit next to each other.
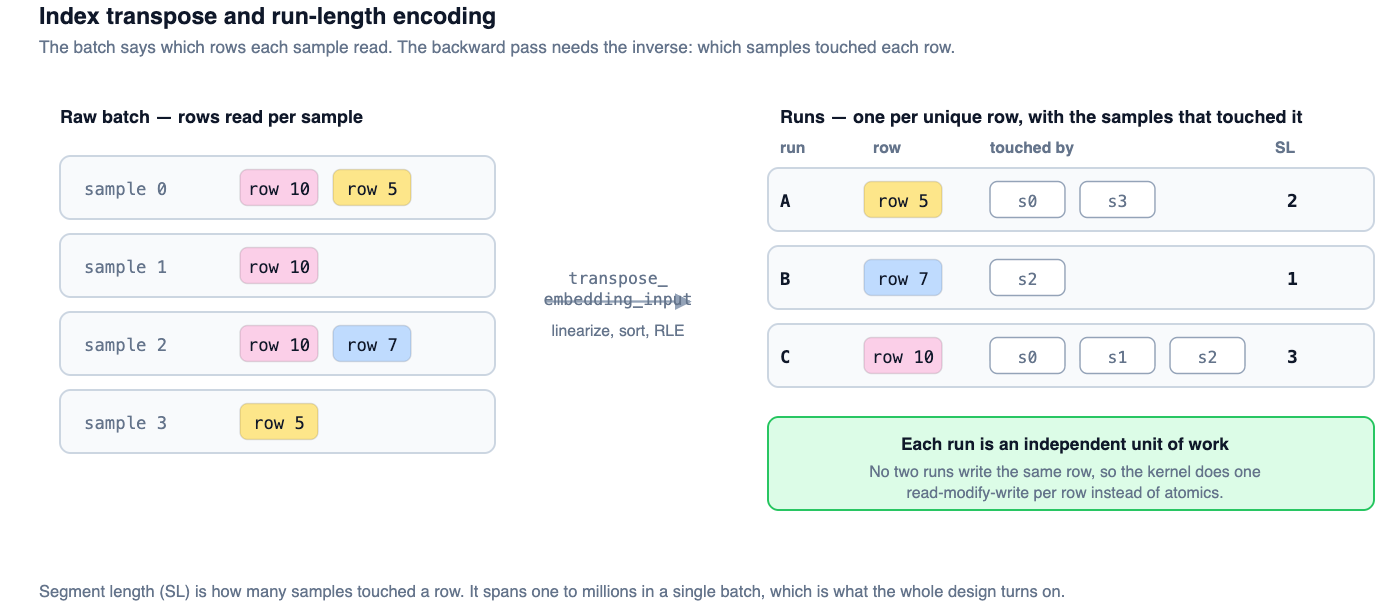
The third tab of the toy does this: a key of hash_size_cumsum[t] + row so rows of different tables never collide, a sort, and a run-length encode. Each run is now an independent unit of work. No two runs share a row, so one program can own a run from gather to optimizer to store and write the row with a plain store. No atomics at all. The cost moved into the sort, and into one number per run, the segment length SL, which in the post's batch spans one to 125K.
This sort, by the way, is still CUDA. The Triton backward calls FBGEMM's torch.ops.fbgemm.transpose_embedding_input (triton_table_batched_embeddings.py:3978), which does the linearize, radix sort and run-length encode. Bounds checking outside the fused path also calls torch.ops.fbgemm.bounds_check_indices. "The entire sparse path is now written in ordinary Python" is true of the kernels that read and write embeddings, not of the sort that feeds them.
Three tiers, routed by run length
Since SL varies over five orders of magnitude, no single kernel shape is right for every run. Triton TBE routes runs into tiers.
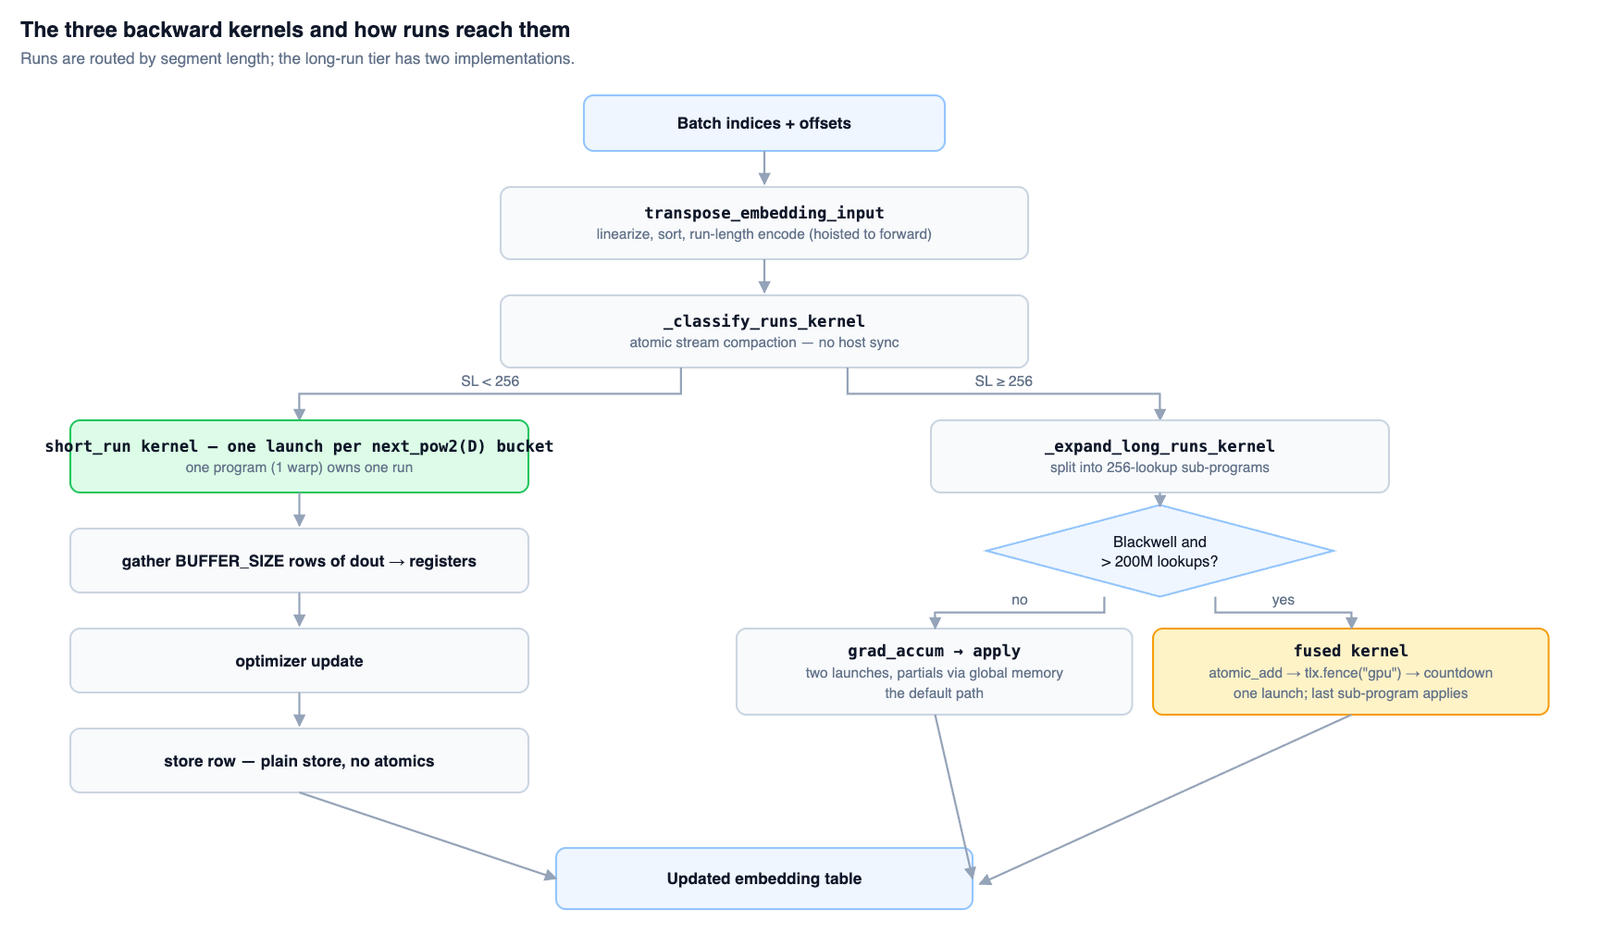
Below 256, the short-run kernel owns a run outright. At or above 256, the run is cut into 256-lookup chunks, split-K style, so a two-million-lookup row becomes roughly eight thousand programs instead of one program the rest of the GPU waits on. The chunks' partial sums meet in a workspace and a second kernel applies the optimizer.
The split happens on the GPU without a host round trip, and the classification kernel is a tidy piece of stream compaction:
# torchrec/distributed/triton_tbe/triton_tbe_backward_utils.py:251-257
is_long = (run_len >= threshold) & mask
is_short = (~is_long) & mask

num_long_block = tl.sum(is_long.to(tl.int32))
long_base = tl.atomic_add(num_long_ptr, num_long_block)
long_local = tl.cumsum(is_long.to(tl.int32), axis=0) - 1
long_pos = (long_base + long_local).to(tl.int64)
One atomic per block of 1,024 runs reserves space, and a prefix sum places each run inside it. The counts never come back to the host, so there is no .item() and no stream synchronization in the backward. The downstream kernels read the counts through device pointers and divide work among themselves with while-loops.
The third tier fuses the two long-run kernels into one, and here the post leans on FBTriton. Once a run is split, the optimizer can only run after every chunk's partial has landed, and plain Triton had no way to say "make my writes visible to the whole device before I tell anyone I am done". The fused kernel uses TLX, Meta's low-level Triton extension, for the fence:
# torchrec/distributed/triton_tbe/triton_tbe_backward_long_run_fused.py:409-418
tl.atomic_add(
    temp_grad_buffer_ptr + temp_grad_offset + col_offsets,
    grad,
    mask=mask,
)

tlx.fence("gpu")

remaining = tl.atomic_add(grad_accum_counter_ptr + grad_buffer_id, -1)
if remaining == 1:
Every chunk adds its partial, fences, and decrements a per-run counter. The chunk that sees the counter at one knows the sum is complete and applies the update. tlx.fence("gpu") lowers to fence.acq_rel.gpu (third_party/tlx/language/tlx/mem_ops.py:2224 in the fork). The post's explanation of why the order matters is right: without the fence, the last decrement could land before another chunk's add is visible, and the update would read a partial sum. Nothing would crash. The gradient would just be wrong.
What the post does not say is that this is FBGEMM's design. The CUDA cooperative kernel already splits very long runs across blocks and finishes them the same way:
// fbgemm_gpu/codegen/training/backward/embedding_backward_split_kernel_cta_template.cu:341-351
int counter = 0;
if (threadIdx.x == 0) {
    __threadfence();
    counter = gpuAtomicAdd(&grad_accum_counter[really_long_run_id], -1);
}
counter = SHFL_SYNC(counter, 0);
// Only the thread block accumulated the gradient last does the weight update.
if (counter > 1) {
    continue;
}
CUDA_KERNEL_ASSERT(counter == 1 && "Invalid grad_accum_counter. Race condition?");
So the fused tier is Triton reaching parity with something CUDA could always express, which is what TLX is for. The gate is also narrow. The fused path runs only with CLC available and more than 32 * 24576 * 256 lookups in the batch (triton_table_batched_embeddings.py:4196-4199), which is the post's "more than 200M lookups". A code comment says how many production shapes reach it: "On the only shape large enough to reach the fused path, narrowing to 2 is worth 12% (1.76 -> 1.97 vs CUDA TBE)." That 1.97 is, as far as I can find, the nearest thing in the post or the code to the 2x on X.
Where the backward speedup comes from
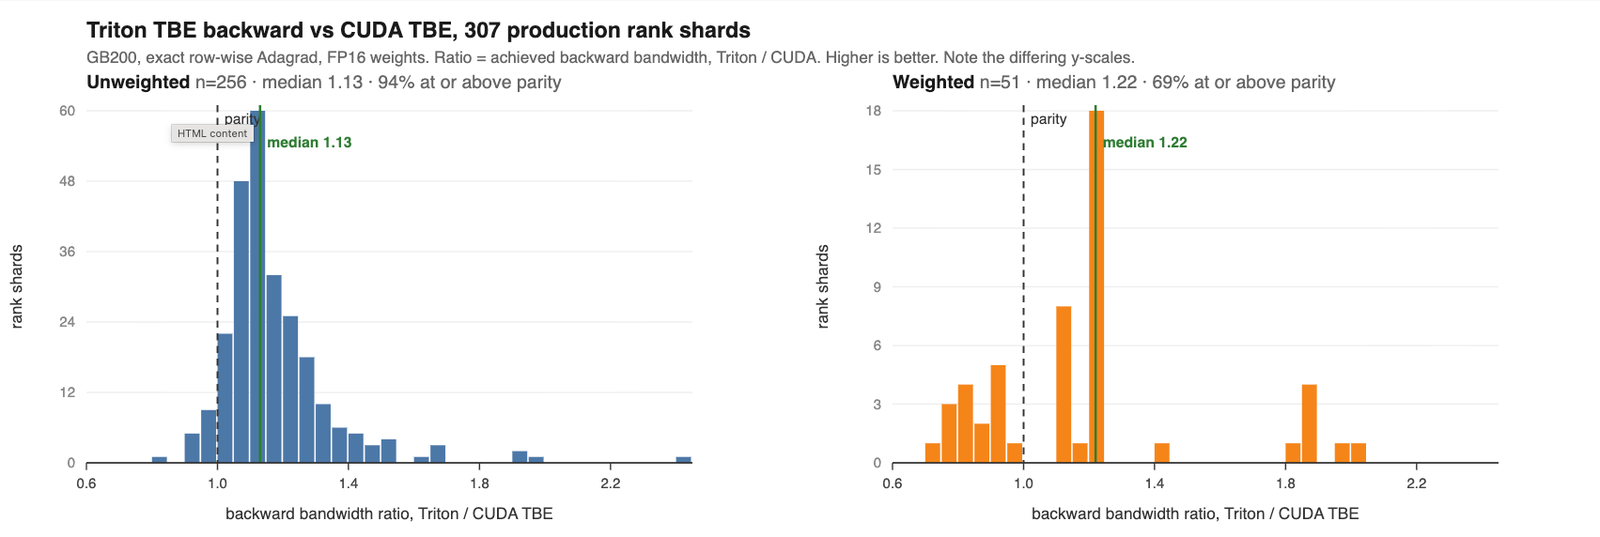
This is the chart to read, and it is honest. Over 307 production shards, 256 unweighted and 51 weighted, the median backward ratio is 1.13 and 1.22. Triton is at or above parity on 94% of unweighted shards and 69% of weighted ones. The right tails are real: a few unweighted shards sit near 1.9 to 2.4, and a handful of weighted ones near 1.8 to 2.0. "2x faster backward passes" describes those tails, not the fleet. If you run a typical shard, expect something like 1.1x to 1.2x, and on roughly a third of weighted shards, a slowdown.
The interesting question is what separates the tail from the middle, and the post's answer is the threshold.
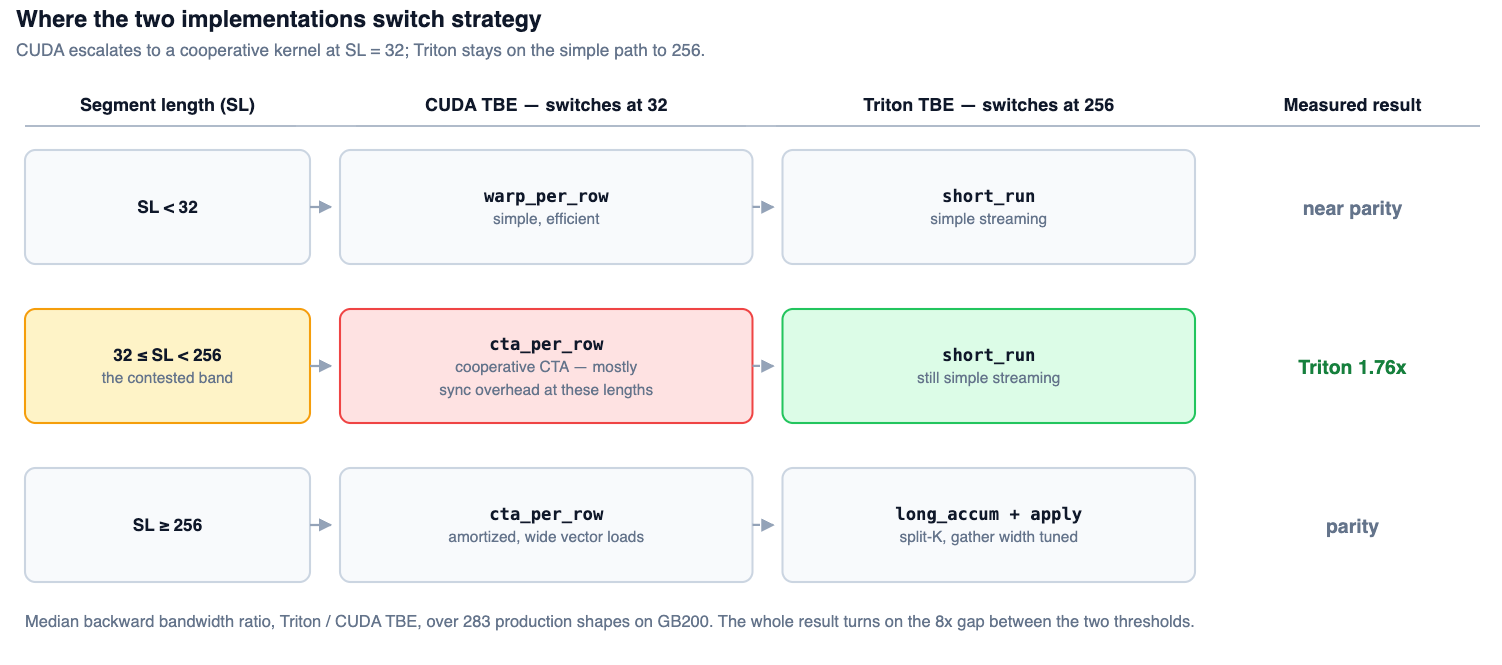
CUDA TBE has two kernels for runs. Below 32 lookups, one warp walks the run. At 32 and above, a whole thread block cooperates on it: warps split the lookups, reduce through shared memory, synchronize, and one warp applies the update. Cooperation pays when there is enough work to spread. For a run of 40 lookups there is not, and the block spends its time synchronizing. Triton's short-run kernel uses one warp (num_warps=1 in the Blackwell config) per run all the way to 256. In the band between, Triton does less coordination per byte, and the post puts the median gain there at 1.76x.
CUDA has a third regime for very long runs: a block takes at most 1,024 lookups of a run (4,096 on Blackwell when the TBE_USE_TUNED_SEGMENT_LENGTHS_CTA_B200 feature gate is on, embedding_backward_split_template.cu:1149-1158), and longer runs are shared across blocks. Drag the slider to see who owns a run at each length:
The two thresholds are 32 and 256, eight times apart. Between them CUDA pays for a cooperating block, with shared-memory reductions and barriers, on runs too short to amortize it, while Triton keeps one program per run. The post puts its median backward gain in that band at 1.76x and calls the band on either side near parity.
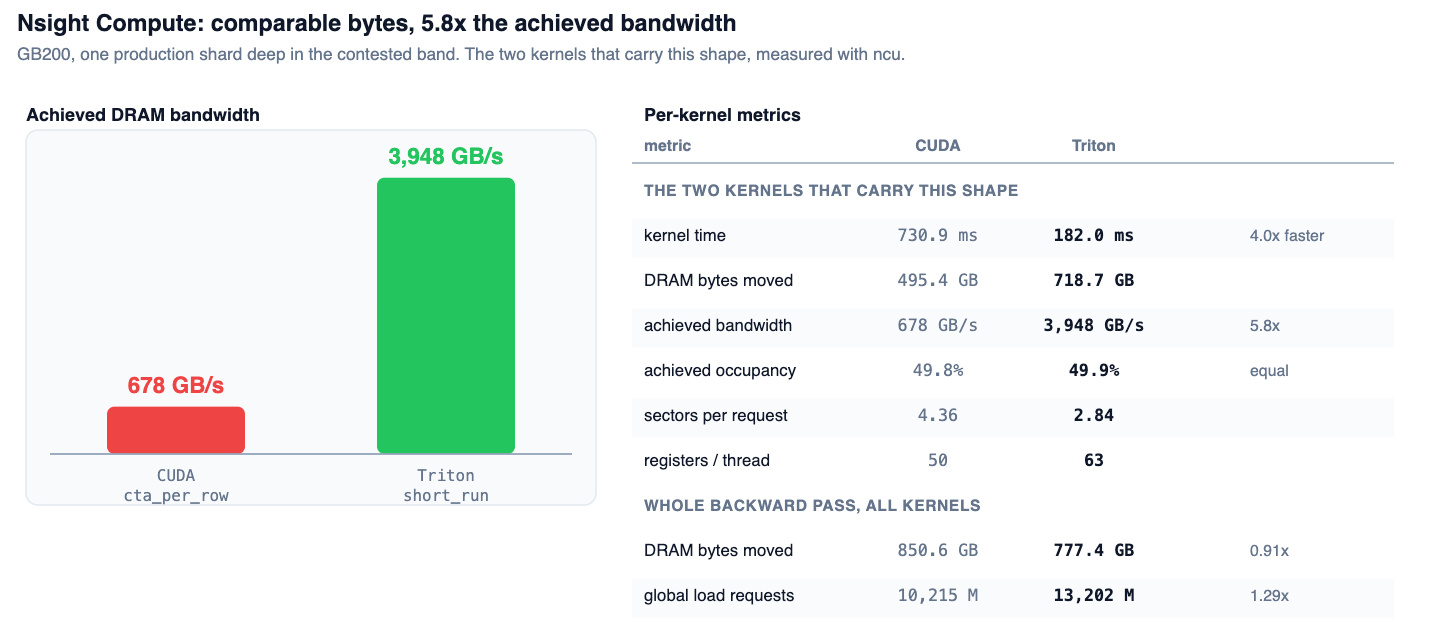
The profile supports the story, with one number to fix. On one shard deep in the band, CUDA's cooperative kernel achieves 678 GB/s and Triton's short-run kernel 3,948 GB/s, which is the 5.8x the figure states, at equal occupancy (49.8% against 49.9%). The post's text says Triton "runs 4.3x faster". The figure's own kernel times are 730.9 ms and 182.0 ms, which is 4.0x, and the figure labels it 4.0x. The text also says the two move "the same DRAM bytes across the pass (0.91x)". That is true of the whole pass, 777.4 GB against 850.6 GB. For the two kernels in the chart, Triton moves more, 718.7 GB against 495.4 GB, and finishes four times sooner anyway. This is a latency-bound kernel being turned into a bandwidth-bound one, and the extra bytes do not matter.
There were two other knobs, and they are the ones the post says moved the fleet numbers.
The first is gather width, which the post calls a register cliff. The short-run kernel loads BUFFER_SIZE rows at a time as a [BUFFER_SIZE, BLOCK_SIZE] tile of pointers, dout_row_start_ptr[:, None] + col_offsets[None, :], and every one of those is a live 64-bit address. Wider buffers mean more loads in flight and more registers. Past a point, registers cost occupancy faster than the extra loads buy latency hiding:
| tier | width | registers | occupancy | effect |
|---|---|---|---|---|
| short run, unweighted | 8 → 2 | 184 → 64 | 12.5% → 49.9% | 0.41 → 1.05 |
| long run, accumulate | 8 → 2 | 158 → 62 | 17.6% → 44.7% | fleet parity 82% → 87% |
| short run, weighted | 4 → 2 | 125 → 64 | 24.8% → 49.3% | weighted parity 51% → 69% |
The table is the post's, measured on B200. The same numbers appear in the config file's comments, with a detail the post leaves out: on the long-run kernel the change came with "byte-identical memory traffic and an identical global-load request count, so the entire delta is latency hiding." A comment on the weighted width gives slightly different figures from a different run (median 1.02 to 1.21, parity 50% to 68%), within a point of the chart.
The second knob is the grid. The Blackwell config launches 32 times the historical base grid for short runs, and a comment on the Hopper config says the base grid was "badly undersized for large run counts (1.66x slower than 32x on the portable path)".
So, where could a 2x backward plausibly come from? From four things, in decreasing order of how often they apply. A shard whose lookups fall mostly in runs of 32 to 255 gets the band effect, a median of 1.76x and more in the tail. A shard with many short runs benefits from the width and grid tuning, which turned a kernel at 0.41 of CUDA into one at 1.05. The single shape large enough for the fused path reaches 1.97 per the code comment. And a shard of runs shorter than four goes the other way: the post counts 11 of 307 shards below parity for that reason, each under about a millisecond. My own count from the histograms is closer to 30 shards below parity in total, about 15 unweighted and 16 weighted, so the short-run explanation covers about a third of the losses. The post does not explain the other two thirds, most of them weighted.
Was it Triton, or was it the threshold?
The post's argument for Triton is that "the wins came from config values", and that "moving an escalation point or gather width in template-generated CUDA means restructuring which kernel handles what". For gather width, I believe it. FBGEMM's kernels are Jinja templates that generate C++ per optimizer and per variant, and the vector widths are baked into generated access loops. Changing them is real work.
For the escalation point, I went looking:
// fbgemm_gpu/codegen/training/backward/embedding_backward_split_host_template.cpp:983-994
#ifdef USE_ROCM
    ...
    constexpr int32_t max_segment_length_per_warp = 16384;
#else
    constexpr int32_t BT_block_size = kWarpSizeHost();
    constexpr int32_t max_segment_length_per_warp = 32;
#endif
On NVIDIA, the switch from warp to block is that 32. The same file sets it to 16384 on ROCm, where the warp kernel handles nearly everything, so FBGEMM has already run with a much higher threshold on another vendor. What I could not find, in the post or anywhere, is CUDA TBE measured with the threshold at 256. The CUDA warp kernel might not stream as well as Triton's short-run kernel at those lengths; it was written for runs under 32 and may hold its accumulators differently. But until someone runs that counterfactual, the honest reading of the 1.76x is "CUDA's cooperative kernel is the wrong tool for runs of 32 to 255", which is a finding about a threshold, not about a language.
The developer-velocity claim I take more seriously, with caveats. The Triton TBE is about 7,100 lines across four files (triton_table_batched_embeddings.py, 5,963; the fused long-run kernel, 486; the backward utilities, 426; the config, 226), and that includes inference kernels for quantized tables. FBGEMM's forward, backward and optimizer template directories hold 13,422 lines, before the 5,375 lines of Python that generate code from them. So "smaller than the original CUDA templates alone" is true. It is also comparing different scopes. Triton TBE supports two optimizers:
# torchrec/distributed/triton_tbe/triton_tbe_backward_utils.py:15-18
OPTIM_TYPE_TO_INT: dict[OptimType, int] = {
    OptimType.EXACT_SGD: 0,
    OptimType.EXACT_ROWWISE_ADAGRAD: 1,
}
FBGEMM's generator has entries for Adam, LAMB, partial row-wise Adam and LAMB, row-wise Adagrad with weight decay or counters, RMSprop, LARS and more, each across weighted, unweighted, VBE, SSD and dense variants. A large part of FBGEMM's line count is that matrix of variants. Triton TBE is smaller partly because it does less, and partly because Triton really is more compact than templated C++. I cannot separate the two from the code.
The portability claim needs a footnote too. The config file opens with "TBE does no tensor-core work, so the kernel bodies are hardware portable and every target runs the same Triton source." The Blackwell values are tuned. The Hopper, MI300X and MI350X configs are each marked UNTUNED in their comments. And the AMD path does not run the same source: it imports its own kernel variants.
Using it, and the import that stops you
If you train with TorchRec, Triton TBE is selected per table group with the fused_triton compute kernel (EmbeddingComputeKernel.FUSED_TRITON in torchrec/distributed/embedding_types.py:110). Two defaults matter:
# torchrec/distributed/batched_embedding_kernel.py:4086-4088
enable_triton_tbe_optimizations: bool = fused_params.get(
    "enable_triton_tbe_optimizations", False
)
With that flag off, the short-run kernels ignore the tuned widths in the config and gather 16 rows at a time (BUFFER_SIZE if ENABLE_TRITON_TBE_OPTIMIZATIONS else 16, lines 2277 and 2479), which is the wide, register-hungry setting the post spent a section tuning away. The small-table histogram path and the FP32 accumulation for FP32 tables are also behind it. The hoisted index transpose (hoist_transpose_to_forward) defaults to False in the module, and the post says the TorchRec wrapper does not expose it. So to get anything like the post's numbers, you pass "enable_triton_tbe_optimizations": True in fused_params and run on Blackwell.
Then you hit this, at the top of the module:
# torchrec/distributed/triton_tbe/triton_table_batched_embeddings.py:64-66
# AMD-compatible kernel variants (no CLC, FP32 accum, portable tl.range)
from ads_mkl.ops.triton.amd.triton_table_batched_embeddings import (  # noqa: F811
    _expand_long_runs as _amd_expand_long_runs,
ads_mkl is not in TorchRec, not on PyPI (both spellings return 404), and not guarded by a try. TorchRec imports the Triton TBE lazily, so import torchrec works, but at commit 37c6943 choosing fused_triton outside Meta should fail with a ModuleNotFoundError on the first table. I did not run it, since running third-party code is off limits for me here; it follows from reading the import. It is the kind of thing that gets fixed in a day once someone files it, and the rest of the file is clean of internal dependencies.
There is one more thing I would check before trusting the weighted path. Per-sample weights are put in sorted order by a second, independent sort:
# triton_table_batched_embeddings.py:4000-4003
if weighted:
    # linear_indices and per_sample_weights need to be sorted together so they matchs
    perm = torch.argsort(linear_indices)
    sorted_per_sample_weights = per_sample_weights[perm]
The kernel then multiplies the weight at sorted position i by the output gradient of the sample recorded at position i in FBGEMM's sorted infos. Within one run, every entry has the same key, so the pairing is right only if both sorts break ties the same way. FBGEMM's radix sort is stable. torch.argsort is called without stable=True, which does not promise any tie order. In practice PyTorch's CUDA sort may well come out stable at these sizes, and the post's weighted results show no sign of trouble, but I would want stable=True or a test that permutes duplicate ids.
What FBTriton is
FBTriton is Meta's fork of Triton, public at facebookexperimental/triton under the MIT licence and on PyPI as fbtriton. Its README describes it as tracking upstream closely and adding "compiler and language work aimed at one thing: giving kernel authors real control over warp-level execution on modern GPUs." The relevant layer here is TLX, which exposes barriers, TMA, cluster launch control and fences to Triton code. TLX also ships alone as triton-utlx, a plugin for stock Triton.
The TBE uses three TLX features, and all three sit behind flags in the Blackwell config. tlx.fence("gpu") makes the fused long-run tier possible. Cluster launch control (tlx.clc_create_context, clc_producer, clc_consumer) lets a persistent program keep stealing new runs after it finishes one, which is hardware work stealing for the load imbalance that runs of wildly different length cause. And tlx.async_descriptor_store(..., store_reduce="add") replaces element-wise tl.atomic_add with a TMA bulk reduction when thousands of chunks merge into one row. The config's comment on the grid puts CLC's value in perspective: 0.97x CUDA on the portable path, 1.01x with CLC on top.
So most of what this post reports is plain Triton. The portable short-run kernel, the classification, the width tuning and the dimension buckets need nothing from the fork. FBTriton matters for the last few percent on Blackwell and for the one fused tier.
What I could check and what I could not
From the code, I could check the kernel structure, the thresholds on both sides, the tuned widths and the register numbers in the comments, the fused-path gate, the classification kernel, the optimizer coverage, the defaults, the line counts and the import. The post's description of its own kernels matches the code closely, with the FP64 accumulation note as the one mismatch.
From the post's own figures, I could check that its text and charts disagree in three places: the forward setup (307 GB200 shards in the text, two B200 models of 31 in the chart), the kernel speedup (4.3x in the text, 730.9 over 182.0 is 4.0x in the chart), and the bytes (the 0.91x is for the whole pass; the two charted kernels move 1.45x more). The X post's "2x backward" matches the tails and the one fused shape, not the medians.
I could not check any timing. Every number for B200 and GB200 is Meta's, on Meta's production shards, against Meta's build of FBGEMM. I could not check whether CUDA TBE with its warp threshold raised would close the gap, since nobody has published that run. And I could not check the developer-velocity claim beyond line counts, which measure size, not how long a change takes.
If you work on recommender training, the useful lesson is general. Look at the segment-length distribution of your embedding backward before you look at the kernel. The whole result here turns on where runs of 32 to 255 lookups go. If your batches have few of them, Triton TBE will look like parity. If they dominate, the gain is real, and so is the question of whether one constant in FBGEMM would have bought most of it.
For more on reading kernels from the source, TileLang is a different answer to the same "write kernels in Python" problem, FlashAttention-3 shows what TLX-style warp control buys on a kernel that does use tensor cores, and reading a torch.profiler trace covers the overhead-bound versus bandwidth-bound distinction that the Nsight numbers above turn on.
How I checked
I fetched the PyTorch post on 2026-10-07 and downloaded its eight figures; they are reproduced here flattened onto white, and every timing in this article comes from them or the post's text. The X post's wording came from the fxtwitter mirror of status 2107607522961928529. I shallow-cloned TorchRec (37c69431), FBGEMM (c297b97f) and facebookexperimental/triton (0e7d779a) and read the files cited by path and line. Line counts are wc -l over those files; the FBGEMM count covers fbgemm_gpu/codegen/training/{forward,backward,optimizer} excluding ROCm, and the generator count fbgemm_gpu/codegen/genscript. The PyPI checks were plain JSON API requests for ads-mkl, ads_mkl, fbtriton and triton-utlx. Below-parity shard counts are read off the bars of the post's backward histograms and are approximate. I ran no kernel and no third-party code. The clones were deleted afterwards.