2026-10-16 · 19 min · reinforcement-learning · agents · benchmarks · harness
A 1:46 narrated explainer, drawn in code. Every number and picture in it is this article's own; the sources are below.
› transcript
Hi, I'm Carillon! When a pager goes off, someone has to work out why. Datadog trained a model to do that. Real incidents have no clean labels. So simulate the system, inject a fault, and the fault you injected is the answer key. Their simulator builds each training incident in four moves. An agent turns a real postmortem into a blueprint of the causal chain. Another agent builds a working system from it, or writes the telemetry directly. The fault is injected, and an alert fires. It is kept only if solvable, leak-free, and still hard. The model gets the alert and tries the same incident several times. Each try queries a sandboxed copy of the real production tools. The diagnosis is scored for being right, and for claims the evidence supports. Tries are compared within the group, and new weights flow back as rollouts keep running. Training on the evaluation judge alone backfired. The model learned to claim less. The reward that worked pays for chasing evidence, then for supported claims. On their internal benchmark, quality is plotted against cost. Scout at its highest effort matches Claude Fable five point one at its highest effort, at about a quarter of the cost. On the public SREGym benchmark, Scout climbs into the top group. With one attempt per fault, those rows tie. Make the injected fault the label, train in the real harness, and never train on your evaluation judge alone. To recap: injected faults as labels, sandboxed real tools, and a reward that pays for evidence. Every source is in the full article. I'm Carillon. Bye!
Why read this
Solidtop 85%Exact AlertEval scores pulled from the figure's vectors, SREGym rows checked against the leaderboard with intervals, and the incident loop stepped through.
- Original analysis
- Concrete numbers to act on
- Explained from first principles
Training & RLNothing to runProprietaryPractitioner paper
How this was scored
- Is it new?
- 1 of 3: An incremental tweak
- Can I trust it?
- 2 of 3: Measures key facts from files, code or configs
- Can I run it?
- 0 of 3: Closed, nothing to run
- Will I understand it?
- 2 of 3: Mechanism from first principles with figures
- Can I act on it?
- 2 of 3: A concrete recipe, numbers or comparison
- Will it last?
- 1 of 3: Relevant for months
- Does it affect many?
- 1 of 3: A specialist community
- Only here?
- 2 of 3: A teardown or measurement few others did
Score 53 of 100, ranked 445 of 577 rated articles. Each question is answered 0–3 by hand, and a 3 is rare. How articles are scored
Samuel Müller, who leads RL methods on the project, put it in one line: "We have post-trained GLM 5.3 flash to become as strong as Fable 5.1 on SRE tasks." The technical report behind that line is 22 pages from Datadog AI Research, dated October 15, 2026. It describes Scout 1.0: GLM-5.3 Flash, post-trained with reinforcement learning to investigate production alerts through the same tools Datadog's own Bits Investigation agent uses.
I read all of it, plus the launch thread and its replies. The recipe is the interesting part. The headline claim is narrower than the tweet: true on one benchmark, at one effort setting, and that benchmark is internal, unpublished and unsized.
Throughout, reported means Datadog's figure, not re-run. Measured means I computed it from a file: the PDF's vector graphics, the Hugging Face API, the SREGym leaderboard page. Reasoned means my arithmetic on the other two.
What an SRE investigation is
A monitor fires. Say all 30 Postgres autovacuum workers have been busy for more than an hour. An on-call engineer, or an agent, now has to answer one question: why? The answer is rarely where the alert is. It sits a few services and a few hours upstream, buried in telemetry that mostly says nothing useful.
An investigation episode in Scout's world looks like this (reported, Section 4.1):
- Start state. The alert and its monitor context, which name the affected service and a time window.
- Actions. Tool calls against Datadog's platform: query metrics, search logs, inspect traces, follow service dependencies, track changes (deployments, feature flags), inspect code, read runbooks and dashboards.
- Observations. Whatever the query returns, including empty results, row limits and syntax errors. The report is explicit that these matter: "If a query returns no matching logs, the model needs to interpret that result and choose a useful follow-up."
- End state. A written diagnosis: the immediate cause, the deeper causal chain behind it, and proposed recovery actions.
- Success. The diagnosis matches a reference explanation. Matching is graded, not binary (more on the judge below).
The report's case study, a real Datadog incident, shows why this is hard. The alert was the autovacuum one. The cause was a Kubernetes node drain about two hours earlier, five causal hops away: the drain removed a read replica and its local disk; the replacement replica came up empty and kept asking for a write-ahead log segment that no longer existed; the primary kept the old replication slot alive, which pinned its cleanup horizon; dead rows climbed from 0.3M to 4.5M; autovacuum workers stayed busy without being able to remove any of them.
Step through the run below. Each step is one tool call from the report's Figure 11, in its own words. Watch the hypothesis list and the causal chain: the agent rules out the runbook's obvious answer first, then works backwards from the symptom, and the chain fills in from the alert end.
Without the widget: the agent reads the runbook (two candidate causes: more writes, or vacuum not matching writes). Metrics show workers pinned at 30 of 30 for two hours and dead rows climbing without a break. Traces are a dead end, an unrelated gRPC error. Kubernetes shows one read replica only 2 hours old and not ready. Dashboards show rows read up 10x while query count is flat, which rules out a write spike. Vacuum logs say the rows are dead but not removable, with the same oldest-transaction limit on every table. No idle transactions in 4 hours, and replicas that report lag are under 4 s behind, which rules out the two usual suspects and leaves "something outside the primary". Logs show the new replica retrying every 9 seconds for a segment that has been removed. The change log shows a node drain 10 minutes before onset. The primary still holds that replica's slot. Diagnosis: drop the slot, rebuild the replica.
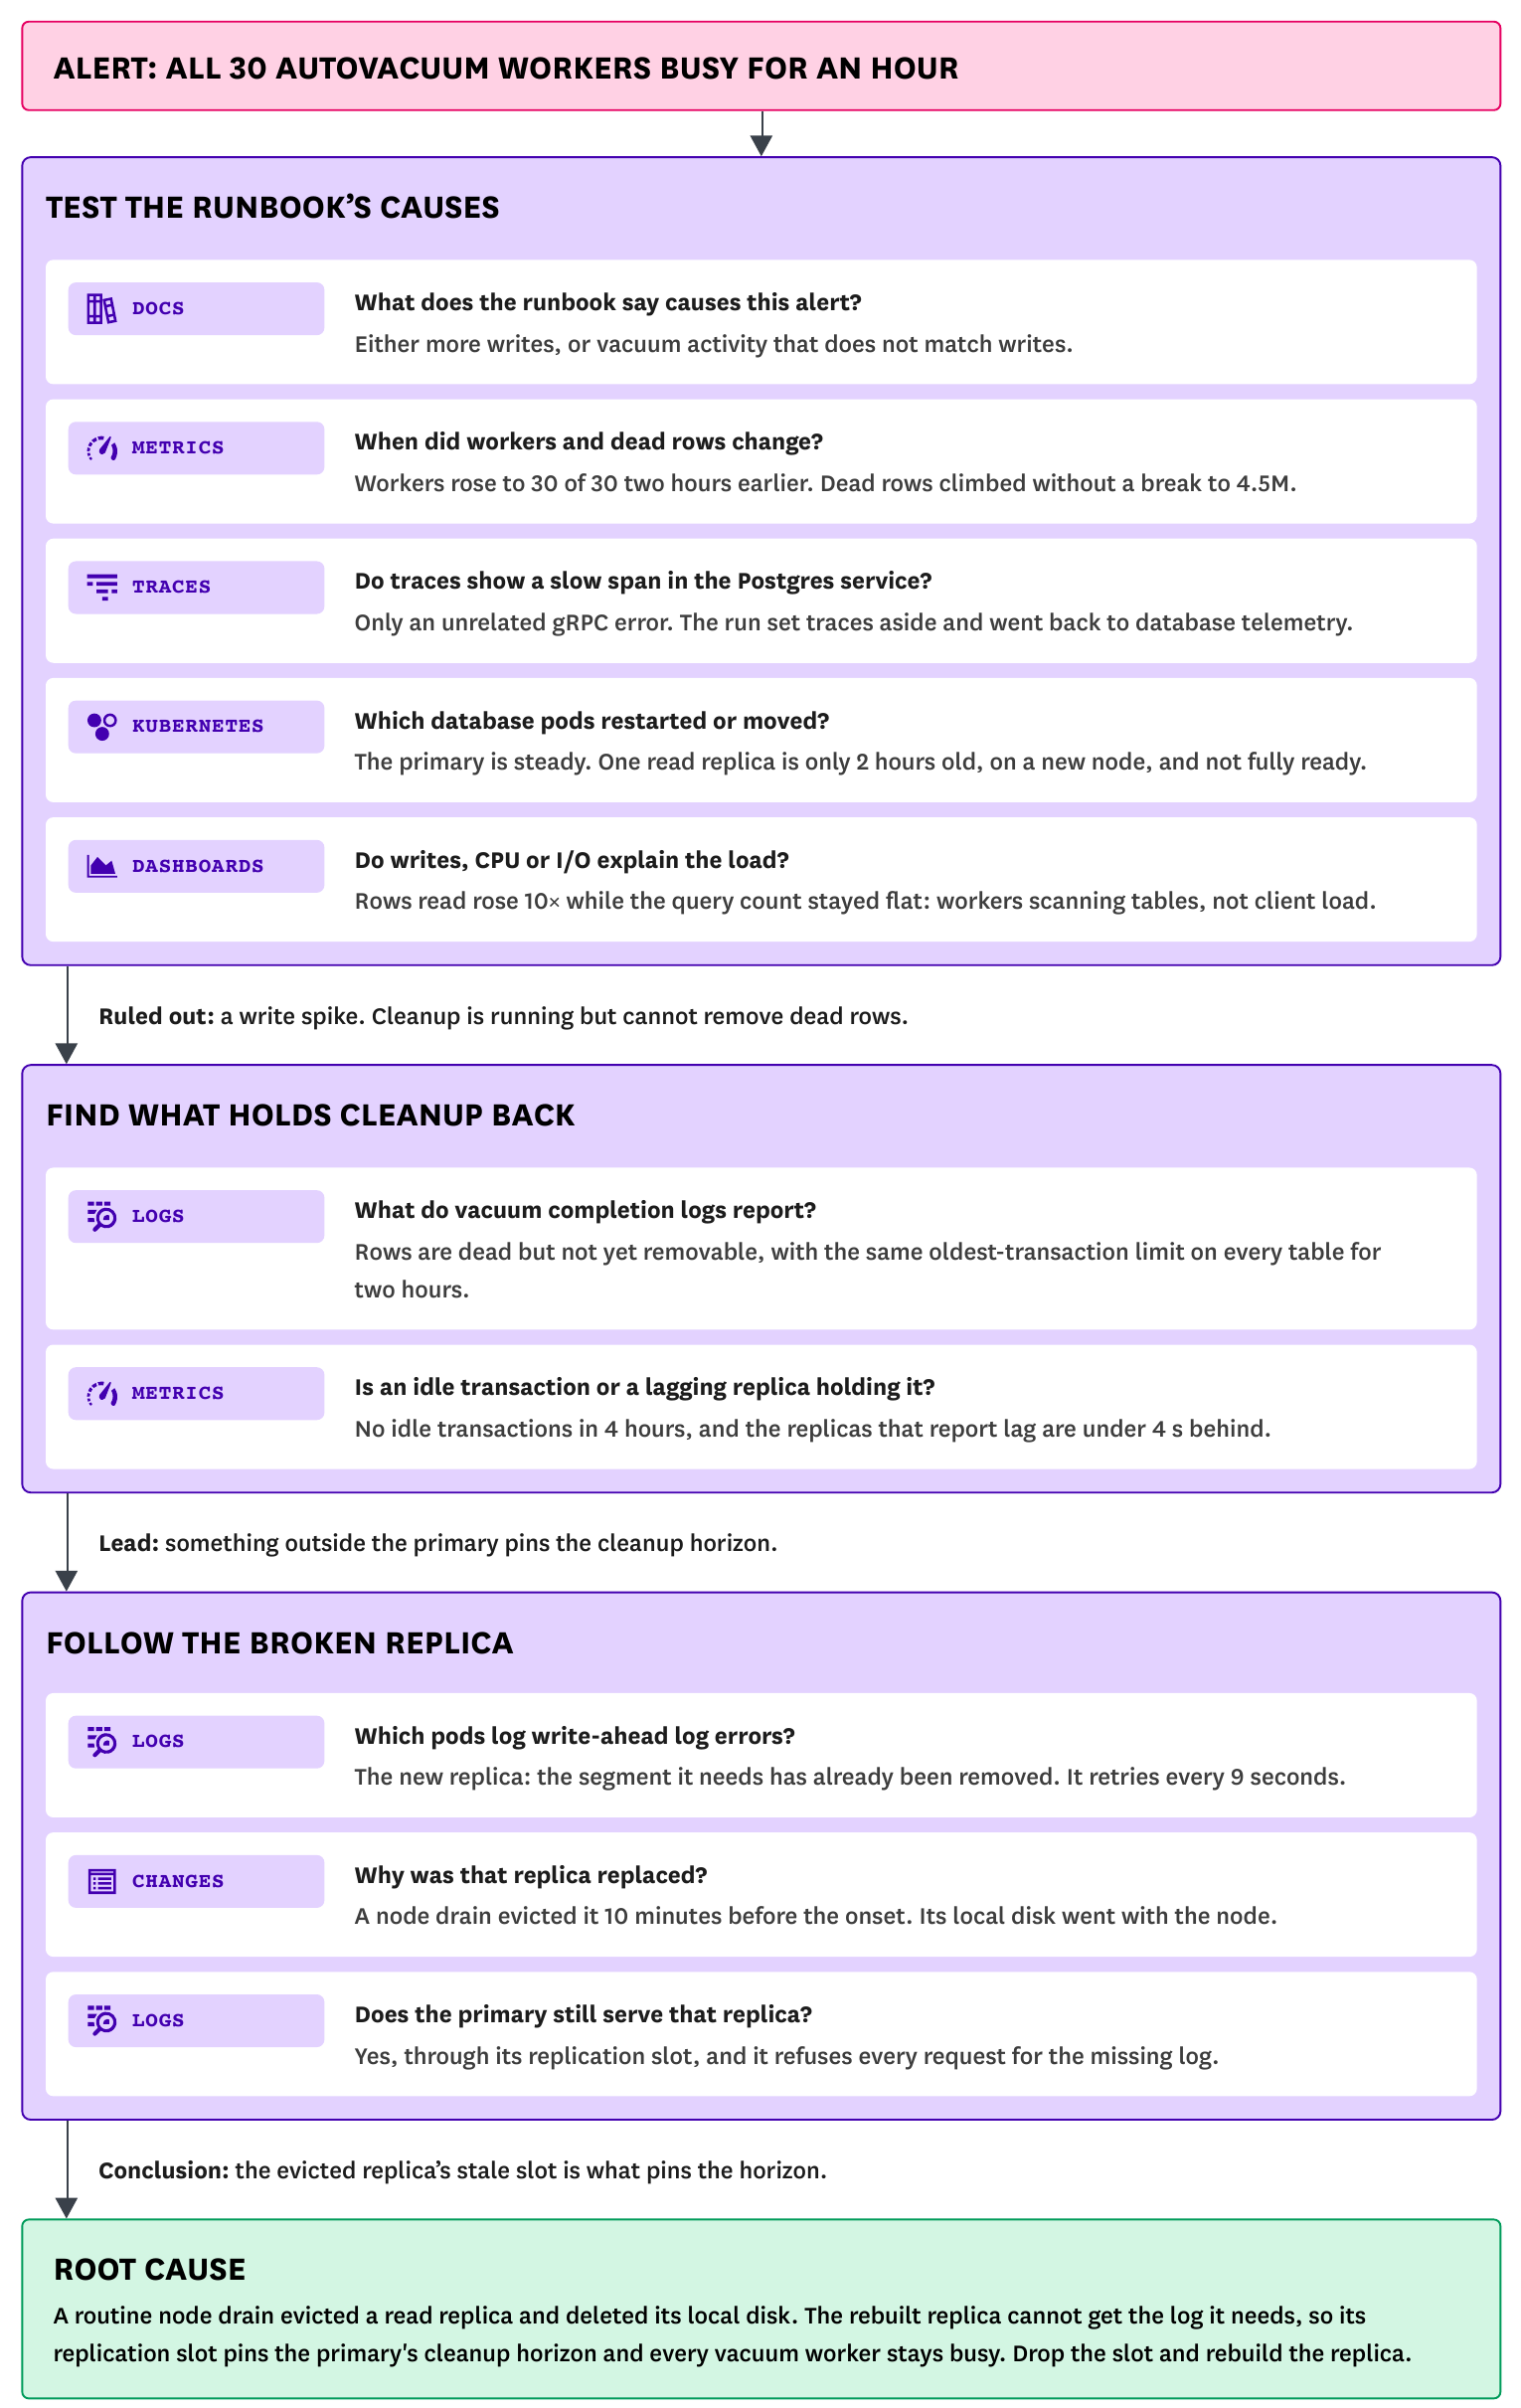
This is a good RL target and a bad supervised one: there is no single correct sequence of queries, only a correct conclusion, and the hard skill is ruling things out.
Building incidents with known answers: GenSim
RL needs many episodes with an answer key. Real incidents have answers but come with two problems the report names directly: labels need expensive expert time, and archived telemetry is sparse because nobody keeps everything. So Datadog built GenSim, a simulator that deploys "behavioral twins" of the kinds of applications its customers run and injects faults "in the spirit of chaos engineering" (reported, Section 3).
The trick is that the fault you inject is the label. Simulate a service graph emitting metrics, logs and traces; inject a fault; the symptom propagates; an alert fires; the injected fault becomes the reference root cause.
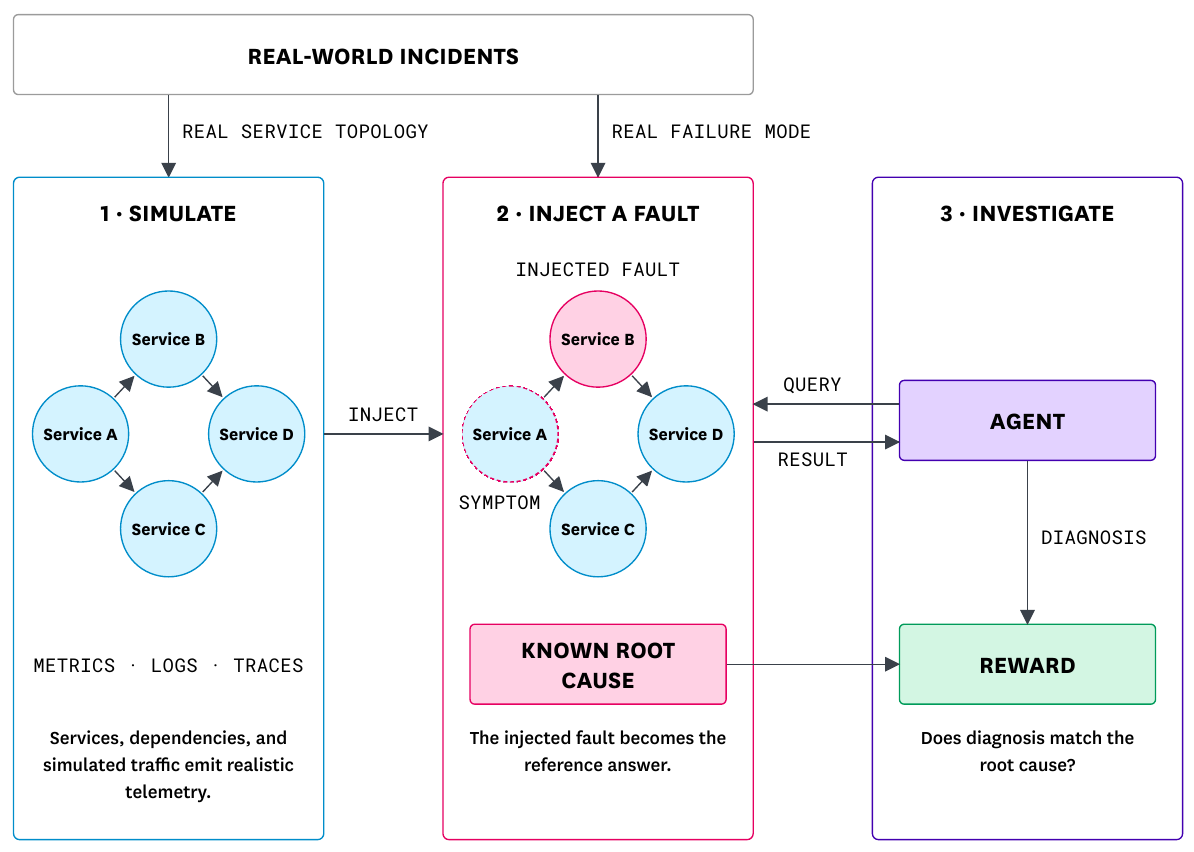
Some scenarios are seeded from real postmortems, through two pipelines that trade cost against fidelity:
- CausalGen. An agent extracts the causal structure of a real incident into a blueprint (environment, trigger, causal sequence to the alert). A second agent implements and deploys a working distributed system from that blueprint in a sandboxed cluster. Then the fault is triggered and real telemetry is recorded. Accurate, but bound by compute and wall-clock time, because it runs in real time.
- SynthTel. Same blueprint, but an agent writes code that emits coherent logs, metrics and traces directly, with no application running. Cheaper and faster, possibly less realistic.
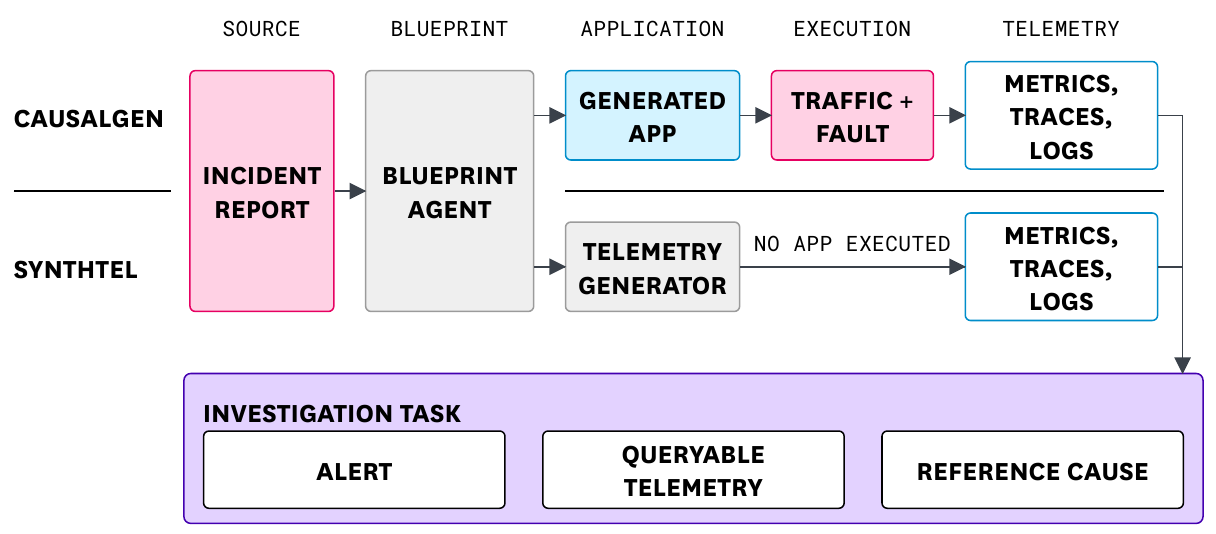
The curation section is the most transferable part of the report, because it is a list of ways an RL environment lies to you:
- Solvability. The evidence has to be reachable through the tools, or the episode teaches nothing.
- Leakage. Simulation details must not leak into alert text, service names or metadata. A runbook that is "too detailed" turns the scenario trivial. They scan scenarios and trajectories with heuristics and adversarial agents for shortcuts. This is the same class of bug as MiMo's environments shipping the fix commit in
.git, and it is good to see it named as a curation step rather than discovered after release. - Difficulty. Scenarios the current model solves consistently in repeated rollouts are dropped, as in Qwen2.5-Math's difficulty filtering.
- Coverage. The same fault presents differently in an API-plus-database app than in a queue-and-worker system, so coverage is tracked over the product of system type and fault mechanism, and the mix is rebalanced so filtering for hard cases does not empty whole cells.
- Signal-to-noise. Because the simulator is controllable, they tune how much irrelevant telemetry surrounds the evidence. Telemetry from unaffected components is kept on purpose: it is what lets an agent rule out competing explanations.
What the report does not give: how many scenarios, the CausalGen/SynthTel split, how many were seeded from postmortems, or any example blueprint. "We train on a curated mix of both kinds" is the whole quantitative description.
The environment: Bits Investigation, sandboxed
The RL environment reproduces the production harness, not a generic one: same tool names, same arguments, same response structures (reported, Section 4.1). A local query service answers from archived scenario data, so many rollouts can share one immutable telemetry archive while each keeps isolated query state. Repeated training queries never touch live systems.
The bet is explicit: "Training a model in the specific harness it will be used in confers a significant performance advantage." The SREGym run exists to test the flip side.
The training stack and the loss
The trainer is asynchronous RL on a fork of SkyRL (commit 29f0fdf, vendored 2026-05-13) running on Ray. Generation and training run on separate GPU pools; a rewarder scores finished investigations; a queue assembles groups for the trainer; new weights go back to the rollout workers. Rollouts may be a bounded number of versions stale.
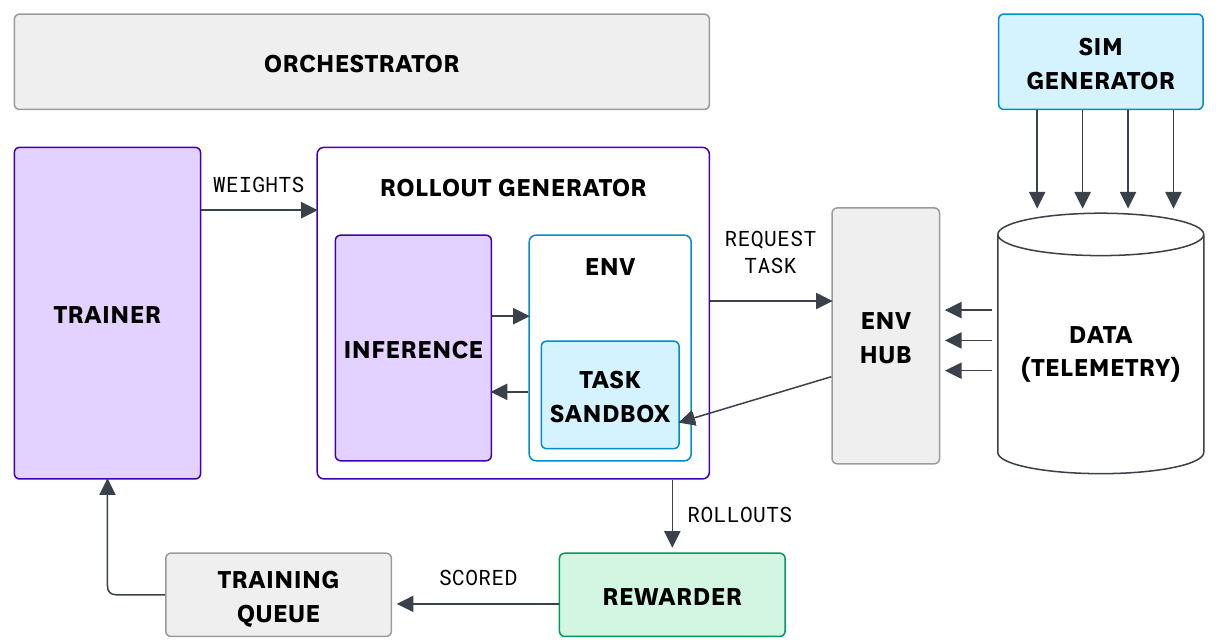
The objective is GRPO with three borrowed modifications, all cited in the report:
- rollouts of the same scenario form a group, and the advantage is rollout 's reward standardized within that group. No value network.
- The importance ratio divides by , the policy that actually generated the tokens (stale weights, a different inference engine), not the trainer's old policy. That is the GLM-5 formulation, and it is why async RL works at all; Qwen's first-order view of RL explains why that ratio has to stay small.
- Asymmetric clip bounds come from DAPO, and so does dropping the KL penalty and entropy bonus.
- The sum is divided by a constant maximum length , not by each rollout's length (Dr. GRPO). Per-length averaging gives each token of a long, wrong investigation a smaller penalty; a constant denominator removes that discount on rambling.
- Tool output tokens are masked out of the loss. The model is graded on what it wrote, not on what the tools returned.
Two fixes close the gap between inference and trainer: the prediction head is computed in fp32 (as in MiniMax-M1), and Rollout Routing Replay records which experts each token was routed to during generation and replays them in training. GLM-5.3 Flash is a mixture-of-experts model, and in some experiments R3 cut the rollout-to-trainer log-probability mismatch by 30% (reported).
The reward: what went wrong first
The most honest section of the report is the one about reward design (Section 5.3).
Datadog's evaluation judge, DeepJudge, is an LLM-as-judge rubric that compares an investigation's findings with a reference explanation. It credits the immediate cause and deeper causal findings, and it penalizes contradictions and spurious findings absent from the reference. As a training reward it failed: the model learned to investigate less and claim less, because the cheapest way to avoid penalties for wrong findings is to report fewer findings.
The opposite fix also failed. An ensemble of granular rubrics gave a denser signal, and rubric scores went up, with "no gain on the product judge".
What shipped is a "hybrid reward signal that balances correctness, exploration, and grounding": pursue the evidence that resolves the incident, then make only the claims that evidence supports. The report does not give the weights, the components or the judge model. The figure that explains it says outright that its positions are "illustrative, not quantitative ablation results". So the lesson is reported, the recipe is not.
The last trick is harness fuzzing. Production tools change as Datadog ships its MCP server, and some can't be reproduced in the sandbox. So during training, optional tools are randomly dropped and the turn budget is sampled from a range, keeping core tools and holding conditions fixed within each GRPO group so rollouts in a group stay comparable. It is domain randomization for tool surfaces.
The base model, and the release status
Scout starts from GLM-5.3 Flash. The report cites the BF16 checkpoint at a pinned revision, zai-org/GLM-5.3-Flash-BF16. I read that repo's metadata from the Hugging Face API: 321,323,031,390 parameters in the safetensors index, MIT licence (measured). The site's architecture walk-through of GLM-5.3-Flash covers the hybrid attention stack; GLM-5.3 is the larger sibling that appears as a baseline here; and the MLX quantization write-up covers running the base on a laptop.
- architecture
- Glm5NextForConditionalGeneration
- task
- image-text-to-text
- library
- transformers
- license
- mit
- safetensors
- 62 shards
- largest file
- 5.37 GB
- files
- 73
- downloads
- 3.5M
- likes
- 2.5K
- languages
- en, zh
repo last modified 2026-09-07
That card is the base, not Scout. Scout's weights are not released. Asked in the replies whether it would be open weights, Müller answered "Probably not for now" (reported). The Datadog organisation on Hugging Face lists Toto time-series models and two datasets, and no Scout model (measured, 2026-10-16). AlertEval is not published either. A reply asking whether the evaluation dataset would be public got no answer in the thread. Scout is in closed preview inside Bits Investigation.
Training compute, data volume, number of RL steps and GPU type are all absent. Asked about cost in the replies, Müller said "I can't say too much and it is a moving target". The only scale hint is in the appendix: in some experiments, "a single checkpoint could exceed 10 TB". For scale (reasoned): 321.3B parameters at 14 bytes each (bf16 weights, plus fp32 master weights and two fp32 Adam moments) is about 4.5 TB. A 10 TB checkpoint is roughly what the 753B-parameter GLM-5.3 would need at the same 14 bytes. So either those experiments trained a larger model, or the checkpoint carries much more state than that. The report doesn't say which.
Checking "as strong as Fable 5.1"
AlertEval: the claim holds, on the axis it was made
The report prints no results table, only Figure 1, a scatter of average DeepJudge score against estimated inference cost per investigation. The PDF keeps it as vector paths, so I read every marker's centre and the axis ticks out of the page and converted them to data coordinates (measured; the markers land on 0.1-point values, which suggests the plotted data has one decimal).
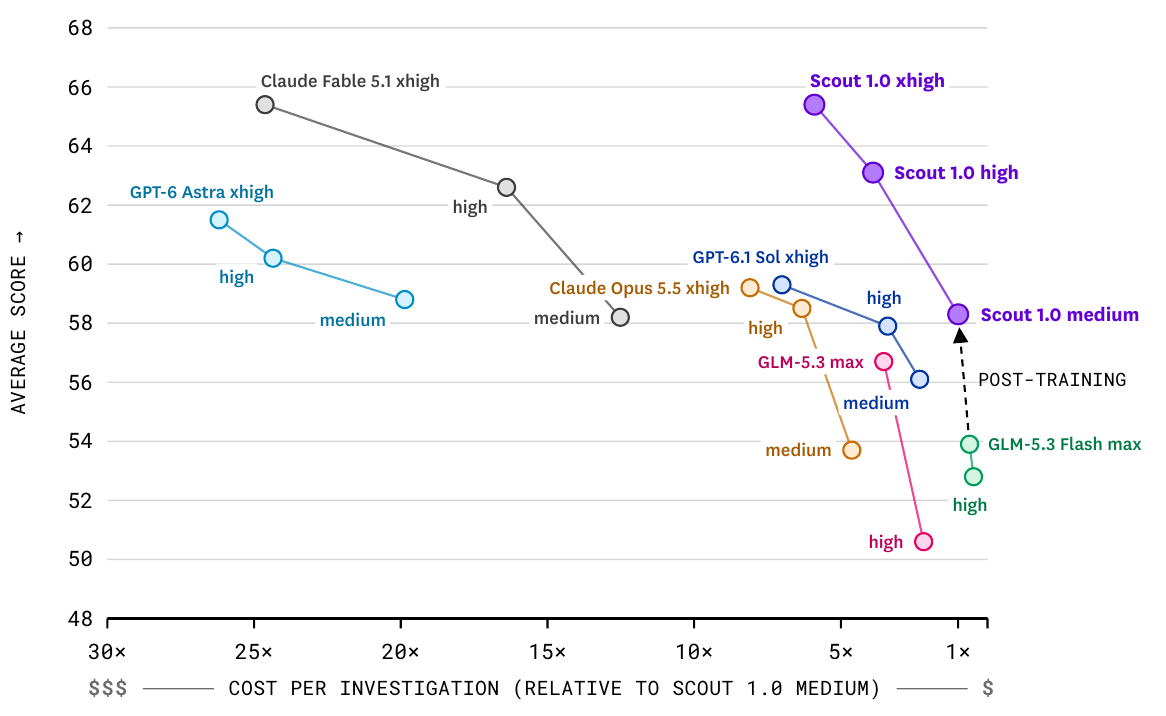
- Scout 1.0 xhigh scores 65.4; Claude Fable 5.1 xhigh scores 65.4 (measured from the figure). Their markers sit at the same height. Costs read 5.9x and 24.6x Scout-medium, a ratio of 4.2 (reasoned), so "4x lower cost" is accurate.
- Scout 1.0 medium scores 58.3; Fable 5.1 medium 58.2 at 12.5x the cost; GPT-6 Astra medium 58.8 at 19.9x (measured). The "12x" and "19x" claims check out.
- Post-training gain: GLM-5.3 Flash max 53.9 to Scout medium 58.3, +4.4 points (reasoned). Scout high reaches 63.1.
- Scout medium costs more per investigation than its own base. GLM-5.3 Flash max sits at 0.61x and high at 0.48x (measured), so Scout medium spends about 1.6x what the base does at max effort (reasoned). Same architecture and size, so the extra cost has to be more tokens or more turns. That fits a reward that pays for exploration after a judge-only reward taught the model to stop early.
So: Scout xhigh does match Fable xhigh on AlertEval. What the figure cannot tell you:
- How many incidents. The report says engineers curated "thousands of evaluation points" and that AlertEval is "a subset". The subset's size is never stated, so I can't put a confidence interval on any point. On a partial-credit 0-100 scale, a 0.1-point tie between two models is not evidence of equality or inequality without that number.
- Which judge model. DeepJudge is an LLM judge; which LLM is not stated. If it shares a family with any contestant, that is worth knowing.
- How cost is estimated. "Estimated inference cost" for a self-hosted model against list prices for API models depends on assumptions (hardware, utilisation, batch size) the report doesn't give.
- Train/test distance. Training is on simulations; AlertEval is real incidents. That is the right split. But GenSim scenarios are seeded from Datadog's real incidents and postmortems, and AlertEval is also built from Datadog's incidents. The report doesn't say whether any AlertEval incident seeded a training scenario.
SREGym: public, and tied at the top
SREGym is a third-party benchmark of 90 live-system faults. A fault counts only if the agent diagnoses and mitigates it correctly. Datadog ran the nine starred rows itself (three Scout settings and six baselines) through the supplied Stratus harness, "one attempt for each fault", and took the rest from the leaderboard (reported).
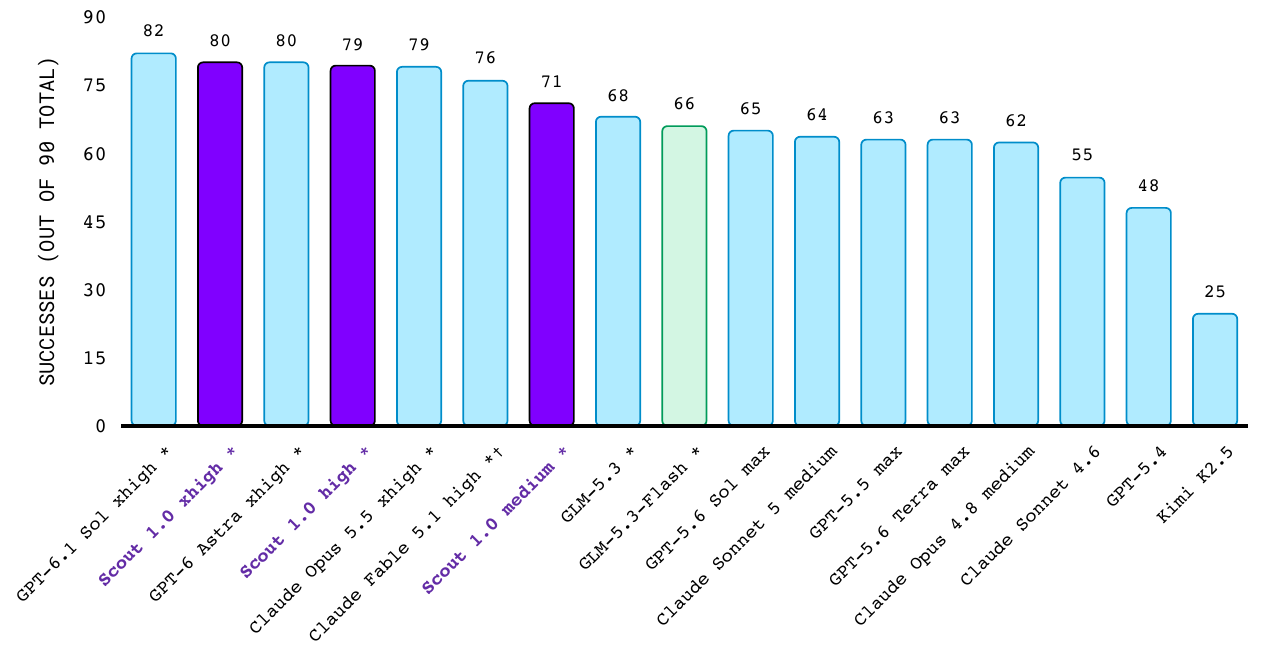
I checked the leaderboard rows against sregym.com/leaderboard, which embeds its full results. Each reproduced bar is the leaderboard's end-to-end rate times 90, rounded: GPT-5.6 Sol max 72.2% gives 65, GPT-5.5 max 70.0% gives 63, Claude Opus 4.8 medium 69.3% gives 62, GPT-5.4 53.3% gives 48, Kimi K2.5 27.4% gives 25 (measured). The transcription is faithful. Each model takes its best harness, as the footnote says, so those rows mix Codex, Copilot, Claude Code and Stratus.
The Fable row needs a footnote of its own. It is Fable 5.1 high, not xhigh, and "for some tasks, Claude Fable's safety classifier declined a request. For these, we fall back to Claude Opus 5.5 at the same effort level" (reported). So the 76 is partly an Opus score, and the report doesn't say how many tasks fell back.
Now the intervals. With one attempt per fault, each bar is a binomial count out of 90. The 95% Wilson interval at 80 of 90 is about 73 to 85; at 71 it is 62 to 77; at 66 it is 57 to 73 (reasoned). Toggle the SREGym tab:
Read with intervals, SREGym says three things (reasoned, with unpaired two-proportion tests since per-fault results aren't published; a paired test on the same 90 faults could be tighter):
- The top five (82, 80, 80, 79, 79) are not separable. Scout xhigh against GPT-6.1 Sol xhigh is 80 against 82, p = 0.62.
- Scout medium over its base, 71 against 66, is not significant on its own (p = 0.38). Scout high over the base, 79 against 66, is (p = 0.014).
- Scout high against the Fable row, 79 against 76, is a tie (p = 0.38), and that Fable row is partly Opus anyway.
That is the right shape for a generalisation check: a different harness, a different task distribution, and the post-trained model moves from the middle of the pack into the tie at the top. It is not evidence of parity with any particular frontier model, and the report's own wording, "competitive", is the accurate word.
Two cost claims attached to SREGym ("more than 4x" cheaper than GLM-5.3, "at least 2x" cheaper than all competitors, 10x cheaper than Astra and Fable) appear in prose only. Figure 2 has no cost axis, so I can't check them. There is also a small inconsistency: the report says Scout 1.0 xhigh is competitive with the best models on SREGym, the launch blog says Scout 1.0 high. On these intervals both statements are true.
What I'd take from it
The transferable parts are not the leaderboard positions. They are four engineering decisions, each argued from a failure:
- Make the injected fault the label. Simulation gives you verifiable rewards for a task whose real data has neither labels nor complete telemetry.
- Train in the production harness, then fuzz it. Exact tool names and response shapes buy performance; random tool dropout and turn budgets buy robustness to the harness changing under you.
- Don't train on your eval judge. A judge that penalises wrong claims teaches silence. A denser rubric that isn't tied to the outcome teaches rubric-gaming. The reward has to pay for evidence-gathering and for grounded claims at once.
- Fix the off-policy plumbing before tuning the loss. Importance ratios against the actual rollout policy, fp32 heads and routing replay are what make async RL on a mixture-of-experts model trainable.
For the related infrastructure on this site: Karotte is an open RL-environment framework built around the same "answer key stays hidden" principle; DeepSeek's DSec is the sandbox fleet side of agentic RL at scale; and Fireworks' distributed RL covers the weight-shipping cost behind asynchronous rollouts.
Whether Scout is as strong as Fable 5.1 in your deployment, nobody outside Datadog can check. The evidence is one internal benchmark of unstated size, with no intervals, plus a public one where the honest reading is a five-way tie.