2026-10-23 · 16 min · tpu · compilers · kernels · distributed-training · benchmarks
A 1:49 narrated explainer, drawn in code. Every number and picture in it is this article's own; the sources are below.
› transcript
Hi, I'm Grommet! TorchTPU runs ordinary PyTorch on Google's TPUs, as a real device. The idea: every op gets a TPU kernel, and a policy decides when to compile and launch. The old path recorded ops into a graph and compiled at a step boundary you marked. TorchTPU is a device in the dispatcher. Eager runs op by op; deferring is a choice. An op on a tpu tensor reaches a kernel registered under the private use key. That kernel builds a tiny StableHLO function. There are about four hundred and forty. In defer and fuse mode nothing runs. The tensor points at a deferred op. When Python reads a value, the region it needs becomes a cache key. A miss compiles once. A hit launches the cached program on the TPU. Four modes share those kernels. Strict launches each op and lets the CPU run ahead. Debug waits for every op. Defer and fuse waits for a read, then runs one fused program. Torch compile replays a whole graph through the same deferral. PyTorch and JAX both emit StableHLO. Pallas kernels enter lower, as Mosaic. Below that is one XLA compiler, down to a TPU executable. The numbers check out, with a catch. Two posts quote different efficiency for one run: one charges attention for the half a causal mask skips. Remember: the new part is when to compile, and every mode shares one lowering. A kernel per op, work deferred until read, and check how efficiency counts attention. Every source is in the full article. I'm Grommet. Bye!
Why read this
Hightop 30%Reads TorchTPU's dispatcher and DeferAndFuse from the C++, runs its no-TPU tests on CPU, and re-derives every MFU: two posts count attention differently.
- Original analysis
- Widely used
- A lasting reference
GPUs, kernels & systemsNeeds datacenter GPUsApache-2.0Practitioner tool
How this was scored
- Is it new?
- 2 of 3: A real new idea, method or capability
- Can I trust it?
- 2 of 3: Measures key facts from files, code or configs
- Can I run it?
- 1 of 3: API-only, gated or restrictive licence
- Will I understand it?
- 2 of 3: Mechanism from first principles with figures
- Can I act on it?
- 2 of 3: A concrete recipe, numbers or comparison
- Will it last?
- 2 of 3: A reference for a year or more
- Does it affect many?
- 2 of 3: A widely used model, tool or lab release
- Only here?
- 2 of 3: A teardown or measurement few others did
Score 67 of 100, ranked 175 of 607 rated articles. Each question is answered 0–3 by hand, and a 3 is rare. How articles are scored
On 21 October, at PyTorch Conference 2026, Google Cloud posted that it was "officially
open-sourcing TorchTPU—enabling native, hardware-accelerated PyTorch execution across Cloud TPUs and
custom infrastructure." The thread carried three more links: native TPU backends for vLLM and
SGLang, TorchTitan on TPU, and a developer hub. The PyTorch account followed two days later with
Introducing TorchTPU, a long engineering post
signed by the TorchTPU team at Google with Meta's PyTorch team as collaborators. The code is
google-pytorch/torch_tpu, Apache-2.0.
TPUs have run PyTorch before, through PyTorch/XLA. The questions are what is different this time, at the level of the dispatcher, and whether the numbers mean what they say.
Short answer: TorchTPU makes "tpu" an ordinary PyTorch device. It registers C++ kernels for
each ATen op under the dispatcher's PrivateUse1 key, lowers each one to a small StableHLO
function, and then decides when to compile and launch. That decision is the interesting part. The
numbers mostly hold up, with one wrinkle in how two of Google's own posts count FLOPs.
- license
- Apache-2.0
- branch
- HEAD
- tests
- 438 files
- source
- 18.0 MB
- commit date
- 2026-10-23
by size of tracked source at this commit, file counts in brackets; docs, data and vendored trees excluded
local clone, 2026-10-23 at f5c9a76 — branch, commit, commitDate, fileCount, hasTests, languages, license, licenseFile, testFileCount
What PyTorch/XLA did, and what TorchTPU does instead
PyTorch/XLA, from 2020, used lazy tensors. Ops on an xla tensor appended nodes to a graph,
which XLA compiled and ran when the user marked a step boundary or read a value. Good for a compiler
that wants whole programs; worse for users, who meet compile time mid-loop, recompile on every new
shape, and write code around the step boundary.
The TorchTPU post is blunt about it. PyTorch/XLA, it says, "required intrusive source-code
modifications to explicitly define compilable regions, suffered from severe compile-time latency,
lacked support for PyTorch's native imperative ("eager") execution mode, and lagged in supporting
emerging distributed computing primitives." That is Google on its own earlier project, so read it as
motivation. The new project's principles are the useful part: no JAX in the runtime, a real eager mode, torch.compile through Dynamo rather than
lazy tensors, and collectives at the Process Group level so DDP, FSDP and DTensor work unchanged.
The user-facing promise is one line: model.to("cuda") becomes model.to("tpu"), and
init_process_group(backend="nccl") becomes backend="tpu_dist".
Rigel's mixed-chip training run is a
recent example of the old path: one PyTorch codebase on TPUs through torch-xla, where HSDP did not
work.
A TPU is a compiler target, not an instruction set
There is no public TPU ISA. Code reaches the chip through the XLA compiler, which has two entry points: StableHLO, a functional IR of whole-tensor ops, and Mosaic, a lower IR that Pallas kernels compile to. The post calls them the TPU's equivalent of PTX. A C++ program talks to the chip through a PjRT client: compile MLIR to an executable, launch it, copy buffers.
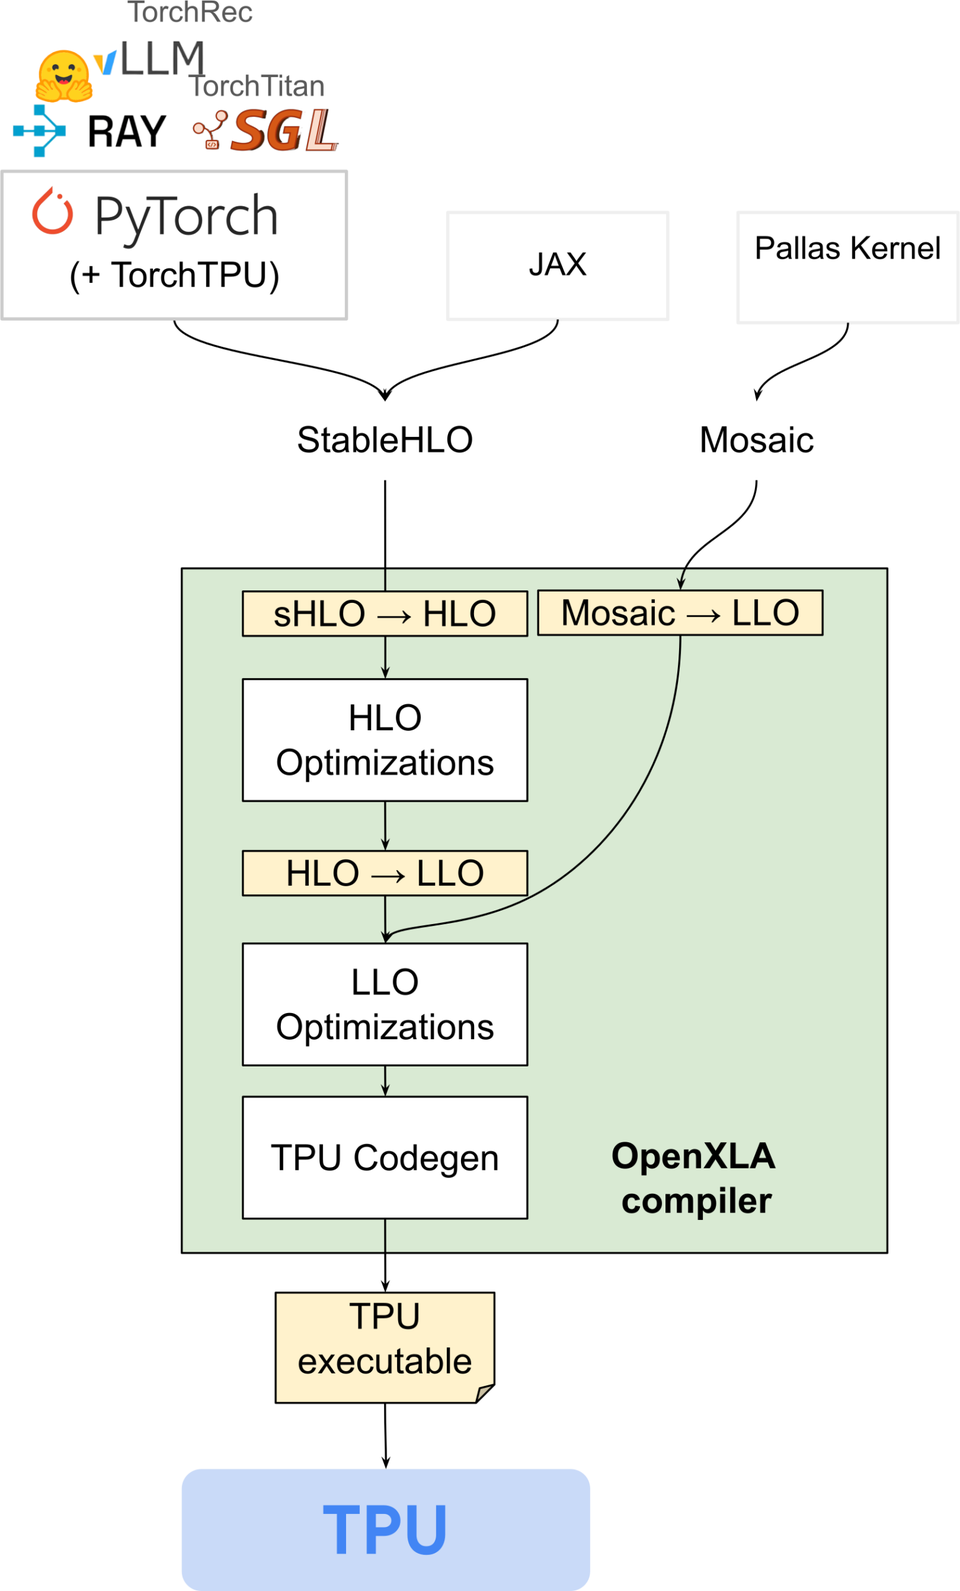
Three properties of that target shape everything TorchTPU does:
- A TensorCore is one thread. It runs one program at a time on its matrix units (MXUs) and vector unit. A GPU overlaps small kernels across its SMs; a TPU cannot, so big fused programs matter more.
- StableHLO has no pointers. Values are immutable; there are no strides and no in-place writes,
only
dynamic_update_sliceproducing a new tensor. - Shapes are static at compile time. A new shape is a new executable.
There is also a process rule: a TPU device can be opened by one user-space process. TorchTPU runs one
process per device, as PyTorch does on GPUs, where JAX runs one per host. A TPU v7 chip has two
TensorCores and shows up as two devices (measured: devices_per_chip=2 in
src/torch_tpu/_internal/utils/hardware.py).
The backend: PrivateUse1 and 438 ops
PyTorch reserves a dispatch key, PrivateUse1, for out-of-tree accelerators. TorchTPU registers
under it and renames it to tpu. The core is csrc/eager/tpu_aten_kernels.cc: a
TORCH_LIBRARY_IMPL(aten, PrivateUse1, m) block with one ImplStable<OpName::k…> line per
operator overload, each pointing at a C++ function that builds the op in StableHLO through MLIR's
builder API. csrc/ops/mm/mm.cc, for instance, emits a dot_general and converts int64 inputs to
f64 first, because XLA has no integer matmul at that width.
Counting the block at f5c9a76 (measured): 683 overload registrations, covering 438 distinct ATen
ops once add, add.out and add_ are folded together, 68 of them backward ops. The post says
~450 (reported), which matches. In the installed 0.2.0 wheel, the dispatcher itself reports 674 ATen
overloads registered for PrivateUse1 and 431 base names (measured), plus kernels in the c10d,
fsdp, ao and tpu namespaces.
An op with no TPU kernel hits a boxed fallback. By default it raises NotImplementedError with
"is not implemented for TPU. Please file a feature request". Inside
fallback_mode(FallbackMode.ALLOW_FALLBACK) it copies the inputs to the CPU, runs the CPU kernel and
copies back. That is a debugging aid on a TPU host, not a way to run without one.
Three ways to run an op
This is where TorchTPU stops looking like PyTorch/XLA. When the dispatcher calls a TPU kernel, the kernel can run the op now, defer it, or anything in between. Three modes expose that:
- Strict, the default. One op, one small StableHLO module, launched asynchronously. The CPU keeps tracing while the TPU works. This is what eager PyTorch on a GPU does.
- Debug, with
TORCH_TPU_LAUNCH_BLOCKING=1. Same, but the CPU waits for each op, likeCUDA_LAUNCH_BLOCKING, with bounds checks on. - DeferAndFuse, with
TORCH_TPU_DEFER_AND_FUSE=1. Each op returns anat::Tensorwhose storage points at a Deferred Op: a StableHLO builder plus any static parameters. Nothing runs.
A deferred region runs at a materialization point. csrc/eager/structured_log_buffer.h lists
the reasons (measured): a CPU transfer, a scalar conversion such as .item(), an explicit sync, an
autograd sync, a distributed op, compile-mode execution, debug mode, and repeated op detection.
The last is a heuristic: a stack of identical transformer blocks would otherwise defer until the
loss, so TorchTPU cuts the region when it sees the same op sequence repeat.
At that point it works out which deferred ops the requested value depends on, runs a liveness analysis to decide which other results must also be materialized (collectives always are, in order), and fingerprints the region. The key is three 64-bit fingerprints: a shapeless key for the graph's structure, a dimensions key for its sizes, and a key for compiler options plus the versions of TorchTPU, libtpu and PjRt. A hit launches a cached executable; a miss compiles on a thread pool. The cache has three tiers: in-process, shared memory across processes on the host, and an opt-in remote directory (Cloud Storage, say) that survives restarts.
Every rank must make the same liveness decision. The post argues it does, because CPython frees by reference counting, so a tensor dies at the same line on every rank.
The widget runs a toy forward step, eight ATen ops and a .item(), through each mode. Slide through
the program. Under Strict, every line is launched as Python reaches it and every intermediate lands in
HBM. Under DeferAndFuse, nothing happens until .item(); then one executable runs, the
intermediates stay inside it, and on the second step the compile is a cache hit. The counts are
illustrative, not measured. The post's own claim is that DeferAndFuse "can be 50% or more faster
than Strict Eager while reducing peak HBM memory" (reported); on the FLUX case study it took the
step from 11.49 s to 9.95 s, a 1.15x speedup (reported), well short of that ceiling.
torch.compile is the same machinery
torch.compile(model, backend="tpu") registers through Dynamo's backend registry
(src/torch_tpu/_internal/compile/__init__.py). Dynamo hands the backend an FX graph and example
inputs. The backend replays the graph as if in DeferAndFuse mode with every op deferred, which
yields one StableHLO program for the whole graph, compiles it, and returns a callable. Eager and
compiled modes share the lowerings, the cache and the materialization code. On later calls Dynamo's
guards skip per-op dispatch entirely.
One limit is stated plainly: on a TPU machine torch.compile forces dynamic=False, because
symbolic shapes need XLA's bounded dynamism (compile once for a maximum size, track the real size
at run time), which is not on by default yet. On 839 causal LLMs from their corpus, bounded dynamism
gave correct numerics on 834 (reported).
For how Dynamo hands a graph to a backend on the GPU side, see MegaBake, which stops Inductor halfway and emits one CUDA kernel. TorchTPU's backend has the easier job: XLA already turns a graph into one device program.
Views without pointers
A PyTorch tensor is a pointer, sizes and strides; x[:, 1] is free, and a write through it shows
up in x. StableHLO has none of that. TorchTPU breaks any view, as_strided included, into
primitives (slice, reshape, transpose, broadcast, pad, unfold, bitcast; one file each in
csrc/ops/view_decomposition/). A write through a view is inverted: the chain runs backwards with
dynamic_update_slice to build a new base tensor. Deferral keeps the whole chain in one program for
XLA to simplify.
Kernels: Pallas, Tokamax, Helion
Hand-written TPU kernels are Pallas. TorchTPU wraps a JAX function containing a pallas_call with
@torch.tpu.pallas.jax_op("ns::name"), which makes it a PyTorch custom op callable on tpu tensors
in eager and compiled mode. Google's Tokamax kernel library (grouped matmul, paged attention, top-k)
ships through the same API; Helion can target Pallas experimentally. A Pallas kernel can also issue
remote DMAs over the chip interconnect, with get_pallas_mesh mapping its axis to PyTorch ranks.
That is the only place JAX appears. It is not a runtime dependency (measured: the 0.2.0 wheel's
Requires-Dist has no jax, and my venv imported the backend without it); it is in the dev
extra, needed only to author or load Pallas kernels. Inferact's Kimi K3
megakernel is what a serious Pallas kernel on these chips looks
like.
Distributed: Process Groups, not GSPMD
JAX's distributed model is SPMD: write a single-device program, annotate shardings, and XLA (through
Shardy) inserts the collectives. TorchTPU does not adopt that. It subclasses c10d::Backend, so
all_reduce, all_gather and friends are intercepted at the Process Group, which is why DTensor,
FSDP2, SimpleFSDP and DDP work on top. Each collective becomes a StableHLO collective op. There is no
NCCL equivalent; XLA emits the communication.
PyTorch programs are not reliably SPMD. A rank-conditional branch, or DTensor splitting a dimension
unevenly, gives ranks different programs, and two different modules with collectives disagree on
sync-flag ids and buffer offsets: a deadlock or memory corruption, per the post. So by default each collective is compiled in its own
skinny module, identical on every rank. Safe, and slow: the post puts the cost at 30 to 40% end to
end (reported), since XLA cannot overlap that communication with compute. Two opt-outs exist: a
@spmd_safe decorator that promises a region is SPMD, and a compilation handshake
(TORCH_TPU_SPMD_HANDSHAKE_STAGE, off by default) in which ranks agree their FX graphs match before
fusing collectives in. SimpleFSDP, whose collectives are ordinary ops in the traced graph, is what
the big training runs use.
What I ran on a CPU
The task brief allowed running the package if it had a CPU path. It does not have a CPU device, but
it has tests written for hosts without a TPU. I installed torch_tpu==0.2.0 with CPU PyTorch 2.14.1
into a Python 3.12 venv and checked out the matching v0.2.0 tag (the main branch's tests already
expect APIs the wheel lacks). All measured, on the shared 4-core VM:
| What | Result |
|---|---|
tests/device/device_module_no_tpu_test.py | 1 test, OK |
src/torch_tpu/_internal/utils/hardware_test.py | 9 tests, OK (v5e, v5p, v6e, v7 topologies from faked PCI ids) |
import torch, nothing else | 12.6 s; loads TorchTPU through a torch.backends entry point |
"tpu" in Dynamo's backends | yes |
| PrivateUse1 name with no TPU present | still privateuseone; torch.ones(2, device="tpu") is rejected |
The last row is by design: the loader renames the key only if it finds a TPU PCI device. The wheel is 91 MB per Python version and carries 16 native libraries in five copies, one
each for PyTorch 2.11 to 2.15 (measured), with torch<=2.15.0 pinned. One caution for anyone
repeating this: install CPU PyTorch from its own index first. My first attempt let the resolver pick
the CUDA build, 6.3 GB on disk, which I deleted.
Checking the numbers
The post's performance claims are all reported; none are re-run here. What I can check is whether
they are internally consistent, using the chip's peak from the repository (2,307 bf16 TFLOP/s per TPU
v7 chip, TpuSpec.V7) and the model configs.
Model coverage (reported): 4,821 of 4,917 Hugging Face models ran without crashing (98%), and 638 of 657 architecture representatives matched a GPU baseline numerically (97%; perplexity within 0.10 relative for causal LMs). The percentages follow from the counts (reasoned).
Muse Glimmer 30B, pure PyTorch, no custom kernels (reported): prefill on one TPU v7 chip at
~25.7k tokens/s and 59% MFU at sequence length 5,120, ~22.4k and 51% at 10,240; training on four chips
at ~5.6k tokens/s per chip and 38% MFU, ~4.6k and 32%. The example's config is in the repo
(examples/muse_glimmer_30b/pure_pytorch_fsdp_trainloop/model_fsdp.py): 52 layers, width 6,656,
SwiGLU 19,968, 32 query heads and 2 KV heads, sliding window 2,048 on three layers in four. That is
25.16B matmul parameters outside the embeddings (measured from the config). Counting 2 FLOPs per
parameter, causal attention with the windows, and no LM head, I get 57.8% and 51.1% for prefill and
37.8% and 31.5% for training (reasoned). Within a point or two of every claim. The repo's own case
study says 2,400 to 2,800 tokens/s per rank, 4,800 to 5,600 per chip, so 5.6k is the top of its
range.
Qwen3 235B on up to 8,192 chips (reported): the PyTorch post gives a weak-scaling table from one slice of 1,024 chips to eight, 2,236 tokens/s per TensorCore at 28.8% MFU down to 2,104 at 27.1%, step time 29.3 s to 31.2 s. Recomputing from the Hugging Face config (21.57B active matmul parameters with the untied LM head, 6 FLOPs each, plus causal attention at 4,096 tokens), all four MFUs come out to the decimal, and so do the step times from batch and throughput (reasoned). Per-TensorCore throughput keeps 94.1% from one slice to eight (reasoned). Against JAX on 64 chips: 1,828 tokens/s against 1,937 for MaxText (reported), 94.4% (reasoned).
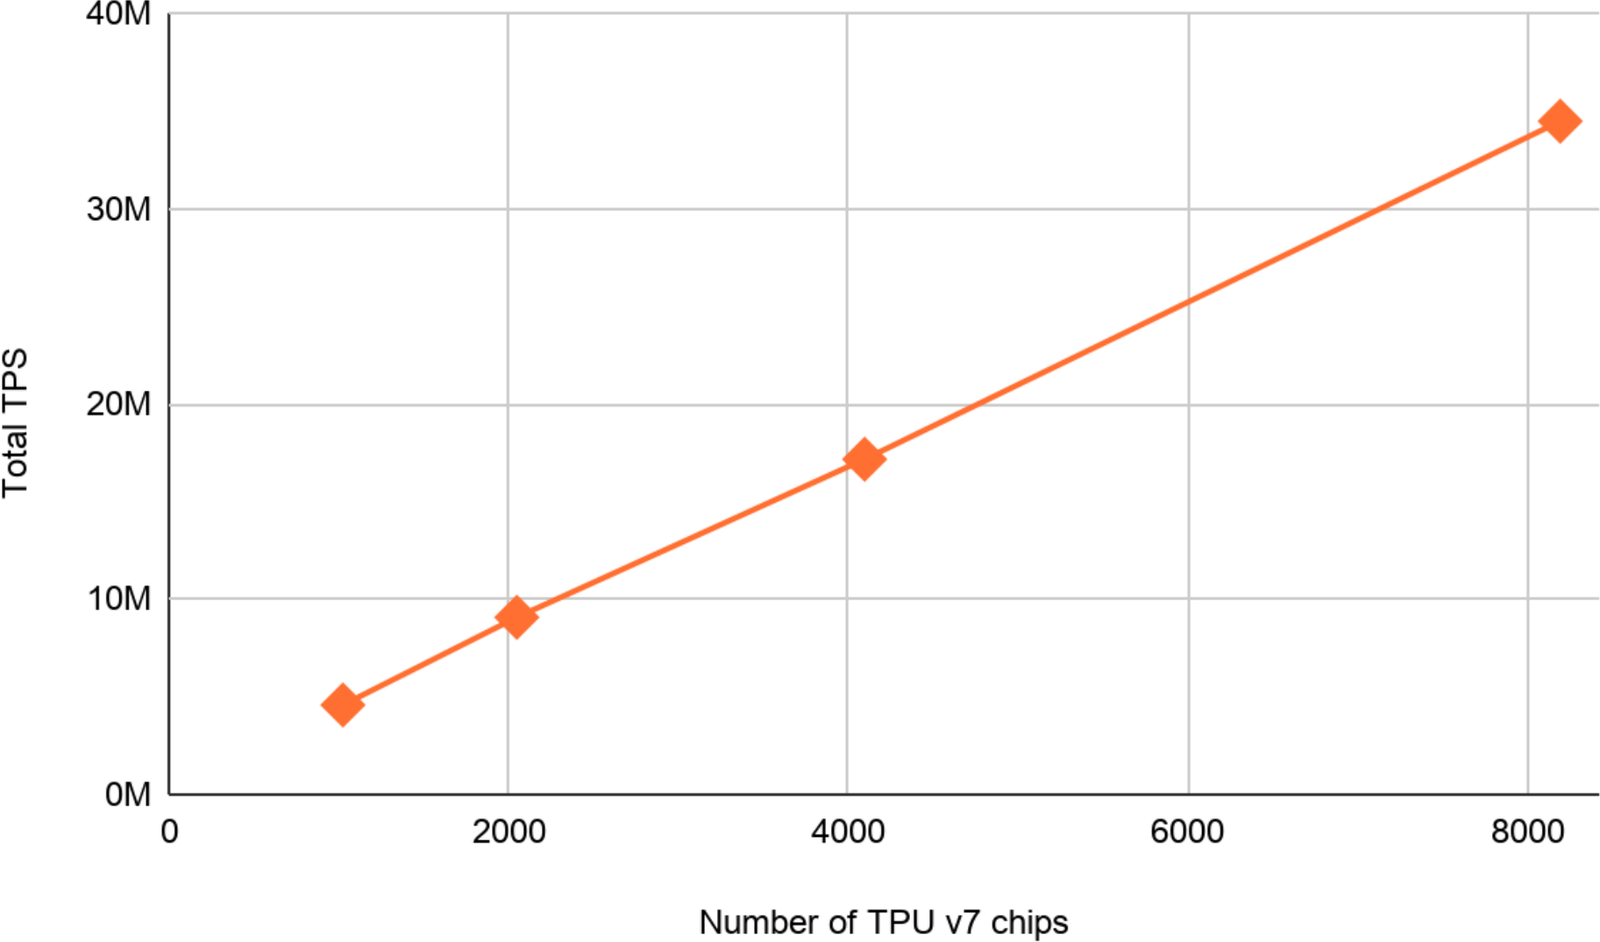
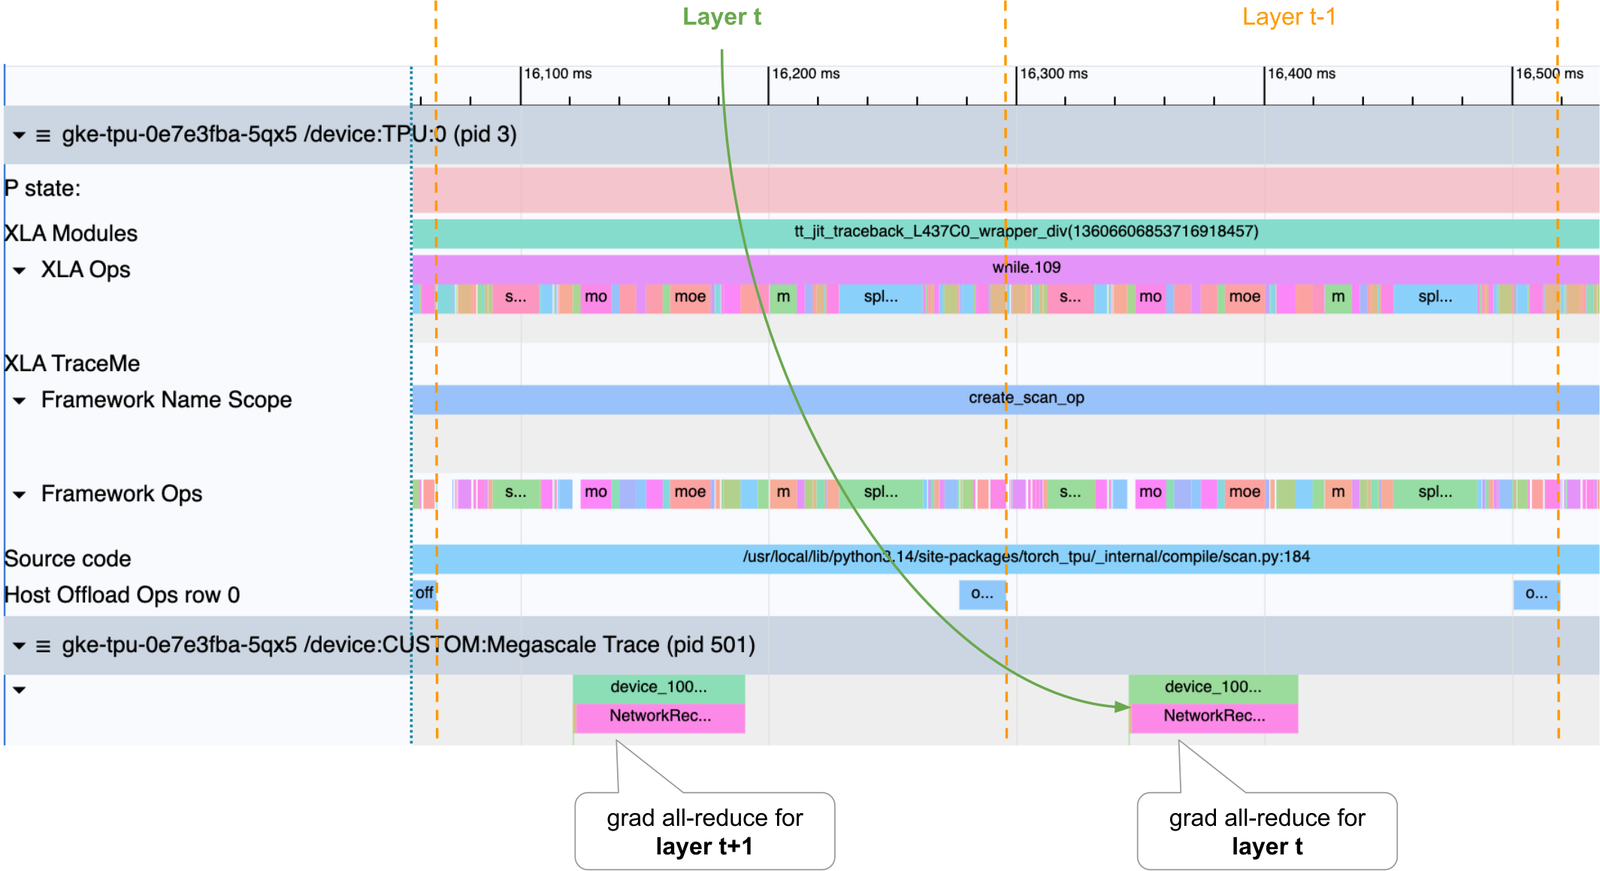
It holds because the only cross-slice traffic is a per-layer gradient all-reduce, which XLA overlaps with the next layer's backward compute.
Here is the wrinkle. Google's companion TorchTitan on TPU post reports the same model at 32.42% MFU on a 1,024-chip slice and 30.51% on 8,192 chips, and gives 4,208 tokens/s per chip at 8,192 (reported), the same as the PyTorch post's 2,104 per TensorCore. Same throughput, MFU three and a half points higher. Charge every query for the whole 4,096-token attention matrix instead of the causal half and the formula gives 32.4% and 30.5% (reasoned). The two posts count FLOPs differently. Neither is wrong, but only the causal count is work the chip does. The same accounting probably explains Llama 3 405B, "50+%" in the PyTorch post and "about 57%" in the TorchTitan one at 500 tokens/s per chip: I get 54.7% causal and 56.9% non-causal from the published config (reasoned).
Pick a claim and toggle the two accounting choices. With causal attention and no LM head, every PyTorch-post figure lands within two points; the TorchTitan figures need the non-causal count.
Inference and recommendation (reported, unchecked): 2.01 cents per million tokens for Qwen 3.5 on vLLM-TorchTPU in SemiAnalysis's InferenceX, and DLRM v2 on 32 v7 chips matching JAX at 18.3 ms a step. Both depend on prices or stacks outside this repo.
What "custom infrastructure" means
The phrase is the tweet's; neither post defines it. The Google Cloud post says "on Google Cloud or
in your own infrastructure" and lists vLLM, SGLang, llm-d, TorchTitan, Ray, TorchRec and Hugging Face.
The repository's FAQ says in-house serving stacks can call TorchTPU through the normal PyTorch APIs.
What the code needs is a TPU: the loader looks for Google TPU PCI devices, and the device runtime is
libtpu. Nothing in the repo targets other hardware. My reading is that "custom infrastructure"
means your own orchestration and serving code on TPU machines, not TPUs outside Google's offerings.
That is a reading, not something I could verify.
Supported chips, per the FAQ and feature table: v5e, v5p, v6e (Trillium) and v7 (Ironwood) are
validated; v8i and v8t are in progress, though hardware.py already has specs for them (measured).
What it costs
- Skinny collectives by default. The safe path costs 30 to 40% end to end (reported). Getting it
back means SimpleFSDP plus
@spmd_safe, which is a promise the framework cannot check. - Static shapes under
torch.compile.dynamic=Falseis forced until bounded dynamism ships. - Not every PyTorch program. FlexAttention is unsupported (the TorchTitan Muse Glimmer port
swapped in
scaled_dot_product_attention); FSDPv2 and MPMD are listed as "low perf". - One process per device. RL colocation, a trainer and a sampler sharing a chip, does not work out of the box.
The take
TorchTPU is the design PyTorch/XLA could not be in 2020: a backend that lives in the dispatcher,
where every other accelerator lives, instead of a parallel tensor type that records a graph. The
clever part is not the StableHLO lowering, which is a long list of builders, but the choice to make
when to compile a policy. Strict gives you GPU-style eager; DeferAndFuse buys back most of the fusion
of a compiled graph without asking the user to mark one; torch.compile reuses the same deferral to
emit a whole program. The performance claims are self-consistent once you know which FLOP count each
post uses. Before quoting a TPU MFU, check whether it charges a causal mask for the half it skips.