2026-10-13 · 26 min · reinforcement-learning · agents · agentic-coding · qwen · training · distributed-training · infrastructure · long-horizon
Why read this
Solidtop 85%Recomputes QwenGyre's tables, splits its speedup into streaming, a standalone pool and elastic cells, and simulates when elastic scheduling stops paying.
- Original analysis
- A lasting reference
- Concrete numbers to act on
Training & RLNeeds datacenter GPUsResearch paper
How this was scored
- Is it new?
- 1 of 3: An incremental tweak
- Can I trust it?
- 2 of 3: Measures key facts from files, code or configs
- Can I run it?
- 0 of 3: Closed, nothing to run
- Will I understand it?
- 2 of 3: Mechanism from first principles with figures
- Can I act on it?
- 2 of 3: A concrete recipe, numbers or comparison
- Will it last?
- 2 of 3: A reference for a year or more
- Does it affect many?
- 1 of 3: A specialist community
- Only here?
- 2 of 3: A teardown or measurement few others did
Score 55 of 100, ranked 359 of 513 rated articles. Each question is answered 0–3 by hand, and a 3 is rare. How articles are scored
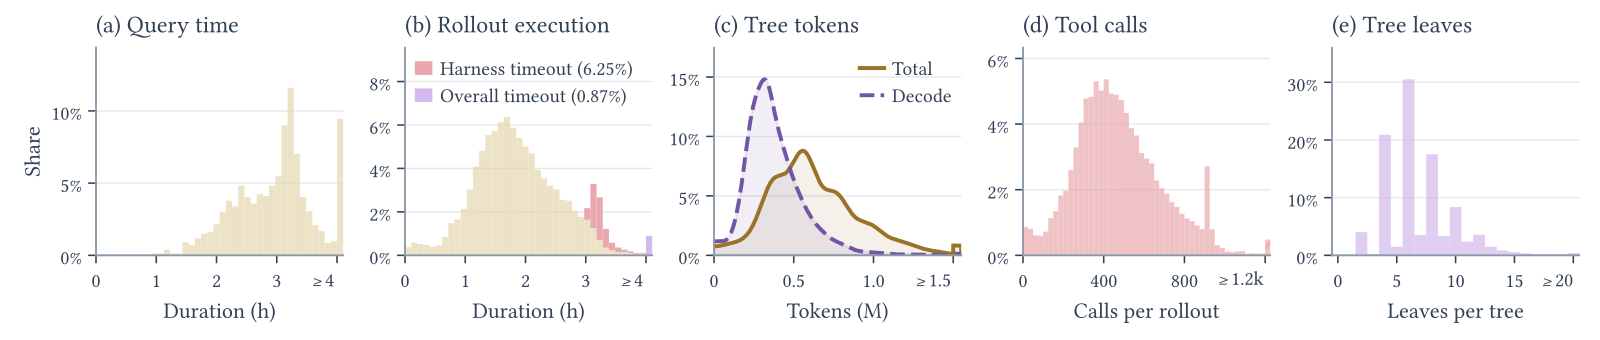
A single rollout in the run this paper cares about lasts about two hours. The training step that consumes it waits for sixteen of them, and it can't start until the slowest one is done. On Alibaba's NL2RepoBench workload the mean rollout execution takes 1.93 hours, and the mean query, which is the slowest of its sixteen, takes 2.96 hours. That gap, about one and a half times, is the cost of waiting for a straggler, and it is paid on every training step.
QwenGyre (Weiqi Wang, Yuxin Zhou, Mouxiang Chen and nine others at Alibaba Token Hub, with USTC and Tsinghua) is the framework Qwen built to stop paying for it. The announcement on X leads with two speedups: "up to 1.85× speedup over Colocate, 1.78× over Async". I went to the paper wanting to know which experiment produced each of those, because a scheduler's speedup is only meaningful against a named baseline on a named workload. They come from different experiments, and the more interesting result is in the ablation table the post doesn't mention.
There is no code. I checked the obvious GitHub and Hugging Face names and found nothing, and the paper never promises a release. Everything below is from the paper, its figures, and arithmetic on its tables, plus a toy simulator I wrote to see the scheduling rules move.
Why hours-long rollouts break both standard layouts
The RL loop is group-relative, in the GRPO family. For each task the policy runs independent attempts (16 here), a reward model or test suite scores each, and every attempt's advantage is its reward relative to its group. A training step consumes groups (32 for NL2RepoBench). The group is the unit, and a group isn't ready until all sixteen of its attempts have a reward. One slow attempt holds back fifteen finished ones.
The attempts are long. In the paper's 122B experiments a rollout makes around four hundred tool calls (Figure 5 peaks there), and the trajectory tree for one rollout carries about half a million tokens with shared prefixes counted once. The tail is the trouble. On the 122B model 9.51% of queries take four hours or more. On the 2.4T model the tail becomes the bulk: 61.1% of queries take at least four hours, and in 38.2% of those the slowest attempt is killed by the overall timeout.
Online RL frameworks place rollout and training on GPUs in one of two ways, and both waste hardware here.
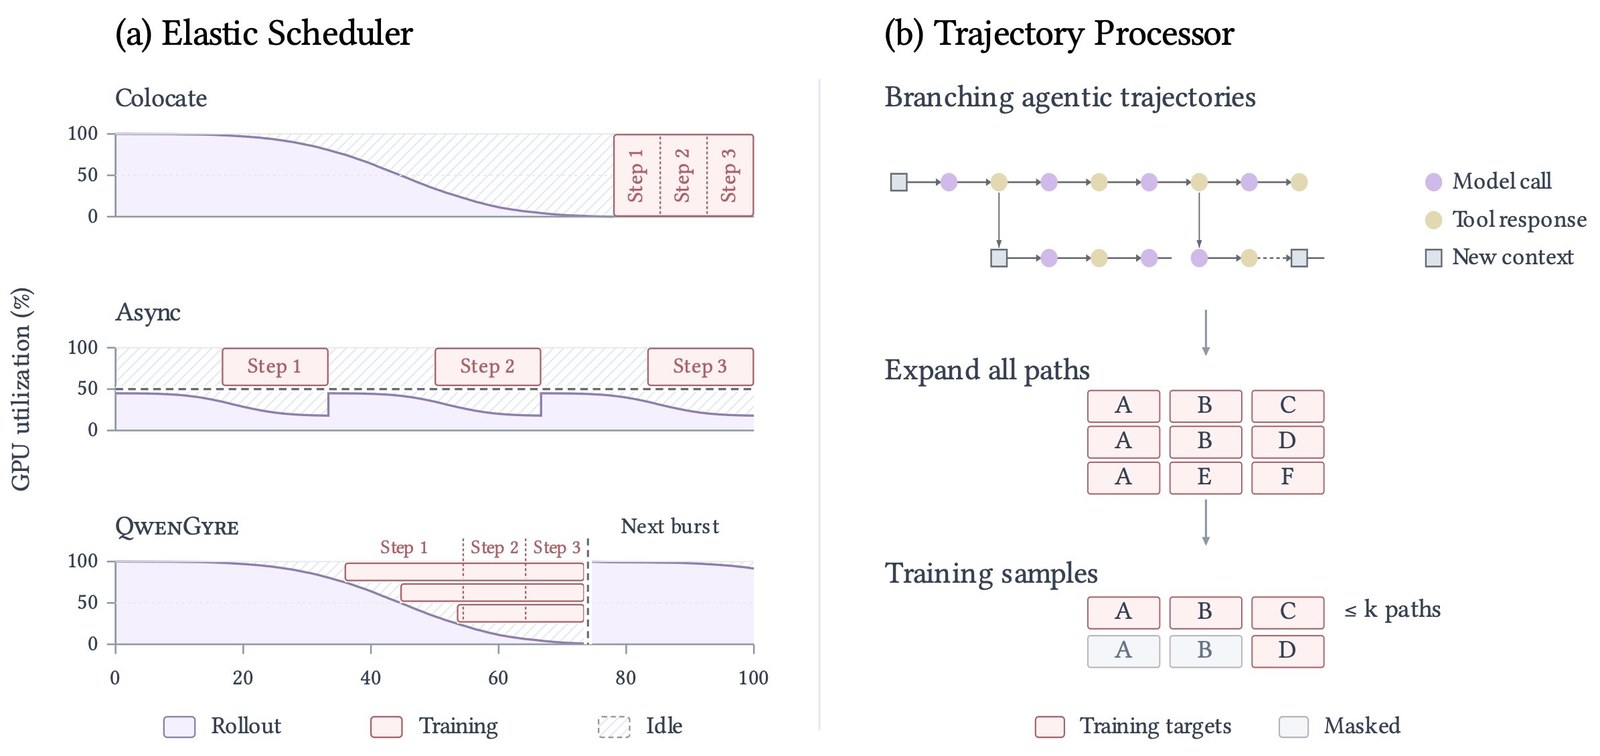
Colocate, the HybridFlow and ReaL layout that veRL popularised, time-shares one pool. Everyone generates, then everyone trains. With hour-scale attempts the pool spends a long stretch with most GPUs serving three or four stragglers. You can't preempt the stragglers either. The harness is a black box, Claude Code 2.1.220 in a container, and it has no checkpoint-and-resume, so killing a live attempt changes its outcome for reasons that have nothing to do with the policy. The paper treats "never interrupt a live execution" as a hard constraint, and that one rule shapes most of the design.
Async splits the GPUs into a fixed rollout pool and a fixed training pool and lets them overlap. Now the training pool idles whenever a full batch isn't ready, which at these durations is most of the time, and the rollout pool can't borrow those idle trainers when the tail is long.
SWE-1.7's async loop and Fireworks' cross-region RL both live on the Async side of this. QwenGyre's argument is that the right split changes minute by minute inside one burst, so it should be computed rather than chosen.
Making the comparison fair: count staleness
A faster scheduler is easy to build if you let it train on older data. Dispatch more work ahead and the trainer never waits, but the groups it trains on were sampled from a policy several versions old. The paper pins this down before measuring anything, and I think this is the most careful part of the paper.
Two knobs control it. is the number of training steps per burst, the stretch between weight publications. is the extra dispatch, how many batches of groups beyond the current burst are allowed in flight. Under boundary dispatch, where new groups enter only right after a publication, the target queue depth is , and Appendix A proves the mean scheduling staleness is
where is the version gap between the policy that sampled a group and the trainer that consumes it. The term is the average position of a step inside a burst. The proof is a counting argument: each surviving group ages by one per update, replacements enter at age zero, and in steady state the outstanding age doesn't drift.
Every comparison then holds fixed. At , Async runs , Colocate runs because it can't dispatch extra work without interrupting a harness, and QwenGyre runs . I checked all three against the formula, and the rows in Table 2 too: they agree. Figure 7 also plots the largest log-probability gap between the current and the recorded rollout policy per step, and QwenGyre's is if anything lower than the baselines'. So the speedups aren't bought with stale data, at least by this measure.
One caveat the appendix states itself: this is group-weighted mean staleness. It says nothing about the worst case, or about how far behind any one token is.
Cells, a waterlevel and a core
QwenGyre splits the GPUs into cells. Each cell can hold a whole training replica (tensor, pipeline, expert and context parallel groups all stay inside it), or it can run SGLang and serve rollouts. On the 122B model that is eight cells of four nodes; on the 2.4T model, four cells of 48 nodes. Cells have a fixed order. Cell 0 is the core, the only one that holds optimizer state and the authoritative weights. The rest are satellites.
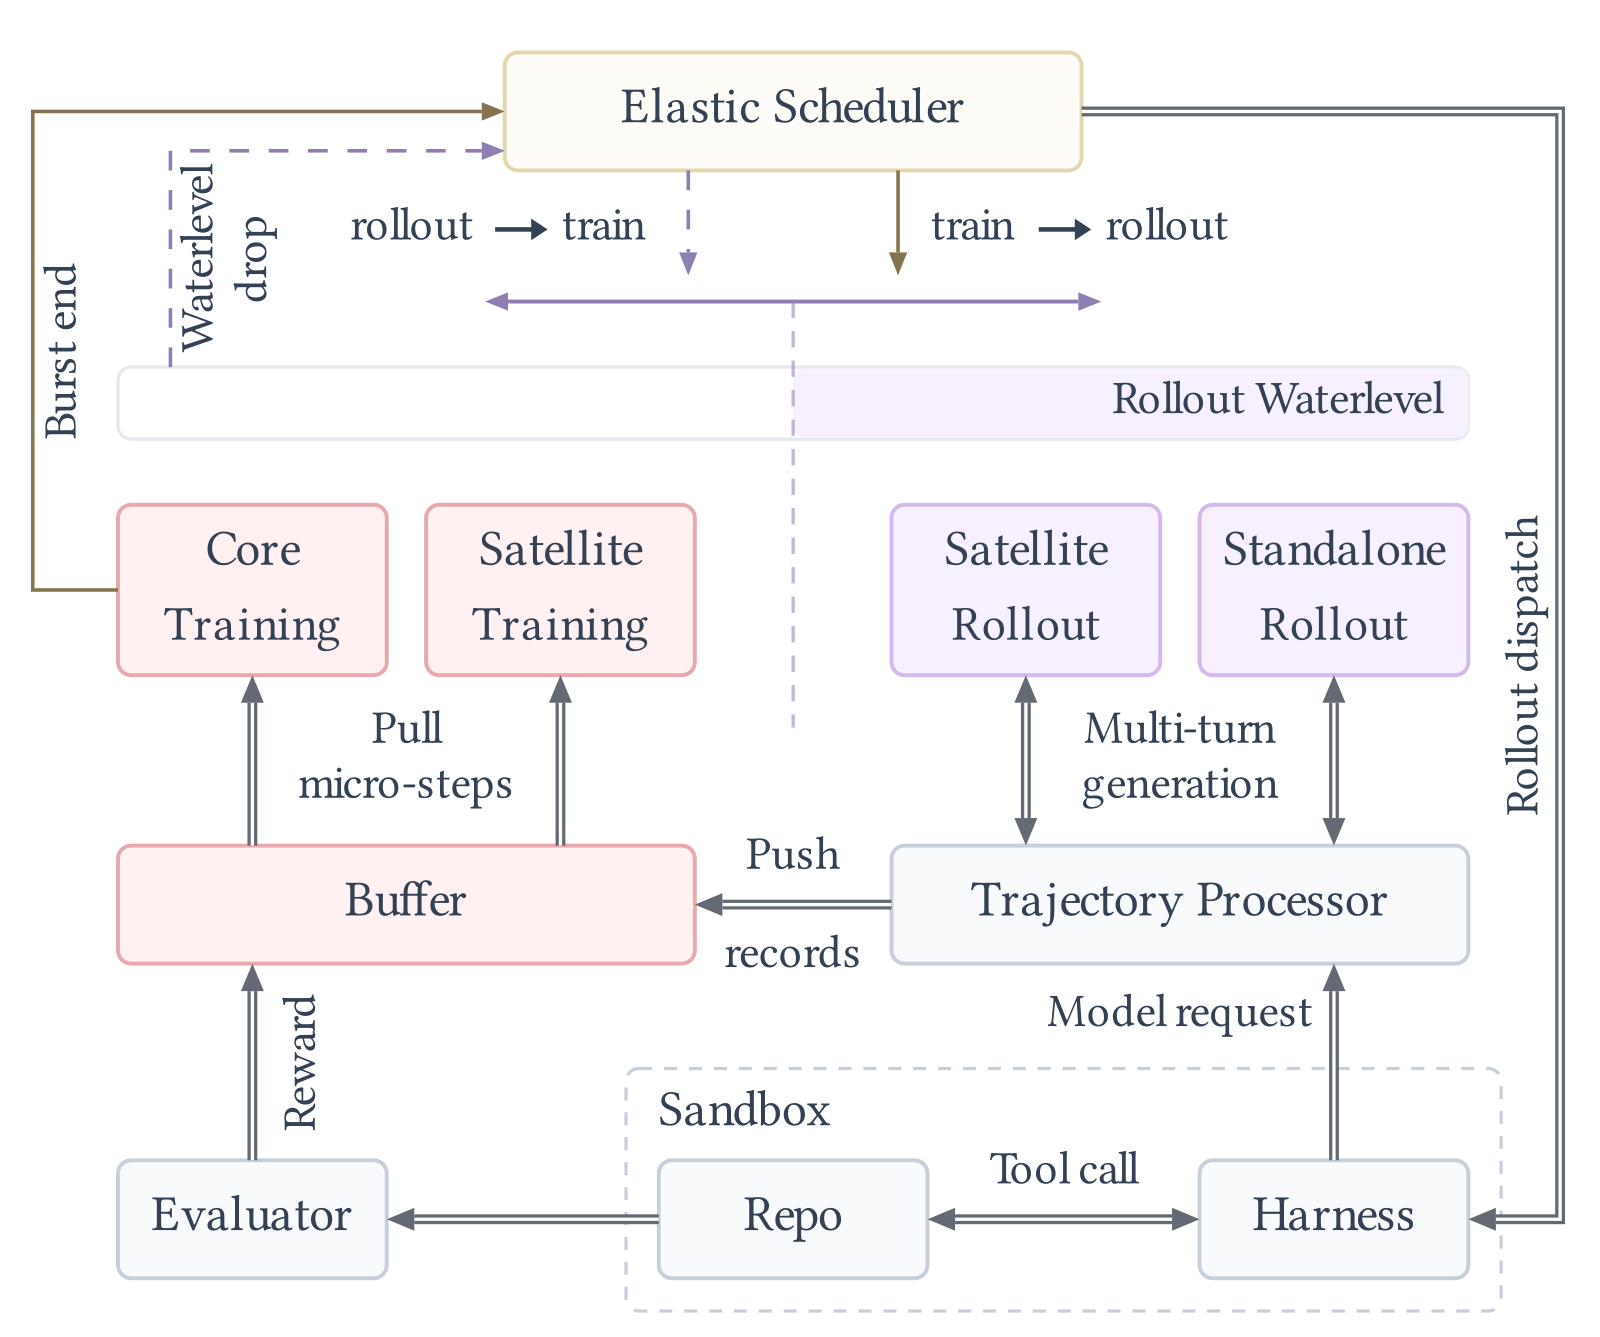
The scheduler tracks three counters: executions dispatched, launched and finished. The waterlevel is dispatched minus finished, the rollout work still outstanding. It can only fall during a burst, because new work enters only at burst boundaries. With cells training, rollout capacity in concurrent executions is
where is one cell's concurrency (144 executions per cell on the 122B runs) and is an optional standalone rollout pool. The rule that makes this safe is one inequality. The next cell may leave rollout only if
which says that after this cell goes, the capacity left still covers every execution that is queued or running. No live harness ever loses its model. A supply check gates it too: at least a fraction of the batch's groups must be ready and unclaimed, continuously, for a hold time , so a cell doesn't switch to training only to sit there. Cells move one at a time, core first, and once in training they stay for the rest of the burst.
The neat part is what happens at the burst boundary. After the final optimizer step, the satellites go back to rollout and the core publishes weights to every rollout engine. The core stays in training only if the next batch already has ready groups and
meaning the rollout side can absorb the outstanding work plus the whole next dispatch without it. Otherwise it reshards into a local SGLang and serves rollouts too.
Moving a cell is plumbing, and the paper treats it as plumbing. The proxy stops sending the cell new requests, reserves capacity elsewhere, cancels the in-flight requests and retries them on the new engine, which the harness sees as one slow model call. KV cache blocks can be pinned and pulled over RDMA so the destination doesn't recompute a long prefix. The cell then drops its rollout weights and KV cache and loads training state; the processes and communication groups stay alive. Measured switching times are 8.52 s into training and 3.46 s back, against rollouts measured in hours.
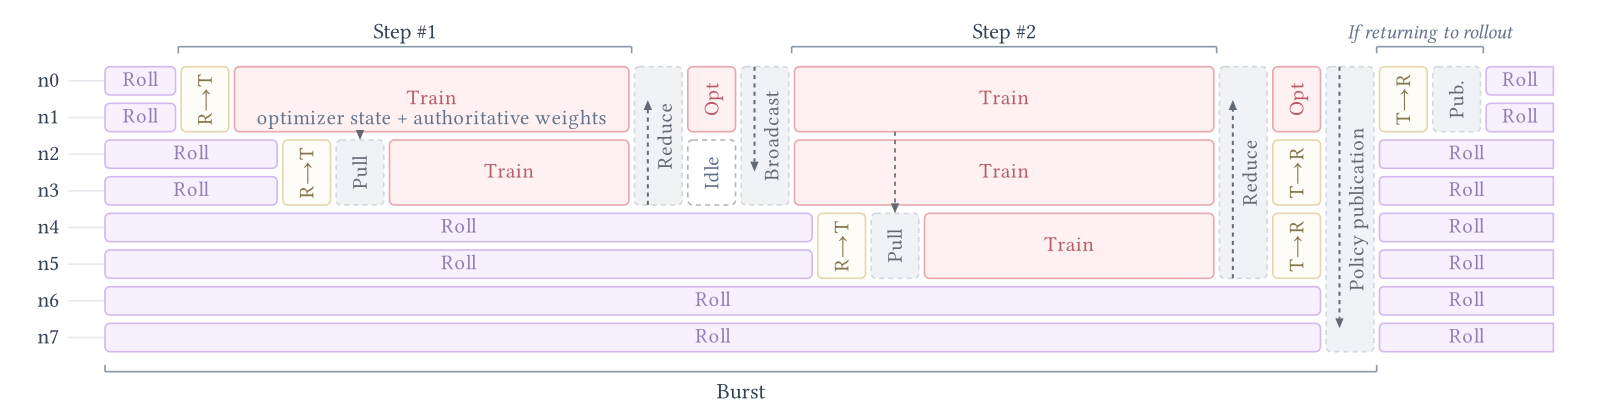
Letting a satellite join a step that has already started is the second trick, and it is what makes small cells worth having. The core exposes its weights through Mooncake's Transfer Engine; a joining satellite pulls them by RDMA and starts on the same batch. The weights don't change during gradient accumulation, so every joiner reads a consistent snapshot. When the batch is done the core reduces gradients from everyone who took part, clips, and steps once. For that collective the system prebuilds sets of communication groups, one for each prefix of 2 to cells, which works only because cells join in a fixed order.
Streaming feeds them. A packing buffer pulls ready groups (oldest policy version first) and cuts them into small micro-steps; cells claim micro-steps from a shared queue as they have capacity, so a cell that joined late or runs fast simply takes more. Each cell runs a continuous 1F1B pipeline that pauses at a clean point when the queue is empty and drains once at the end of the batch.
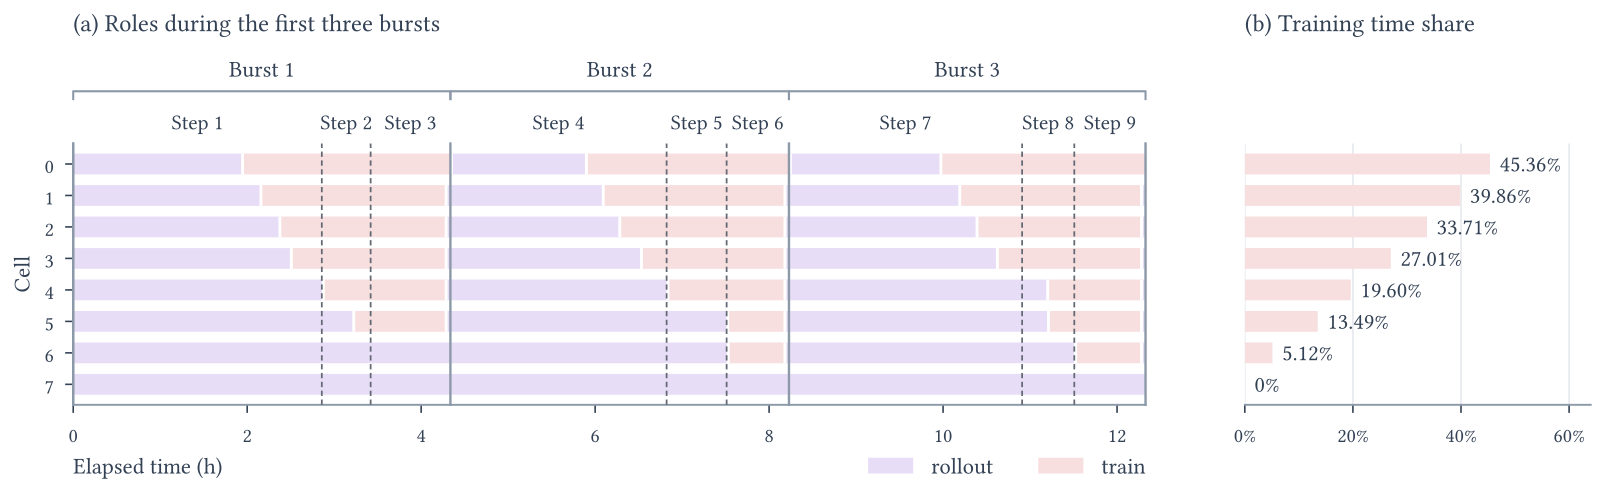
That figure says something the text doesn't. Average the eight training shares and you get 23.0%. In other words, even with training overlapped as tightly as the system can manage, three quarters of the cluster's time in this window goes to generating rollouts. The scheduler's job is mostly to keep training off the critical path, and on these runs training is the smaller job.
A toy version you can push around
I wanted to see where the rules help and where they don't, so I wrote a minute-by-minute simulator of the three placements with the paper's rules: boundary dispatch, the pairs that hold staleness at 1.5, the waterlevel inequality, the supply check, in-order joining, streaming, and the core-retention test. Eight cells, eight executions per cell, four groups of four attempts per step, twelve steps. Durations are lognormal around 1.5 hours with a per-query factor, capped at a 4.5-hour timeout. Every policy sees the same draw of durations, so the only difference between the three panels is the scheduler.
At the default settings Elastic finishes the twelve steps in 13.5 hours, Colocate in 18.1 and Async in 22.1, which puts the toy's speedups (about 1.3x and 1.6x) in the same range as the paper's 122B NL2RepoBench results. Don't read more into the agreement than that. It is a toy, the durations are made up, and real rollout throughput doesn't scale linearly with occupancy.
Three things in it are worth trying.
Tick "let Async stream groups into training". Async drops from 22.1 to 18.5 hours without any elasticity. Training the moment a group lands is a large share of the win, and the paper's own ablation agrees, as the next section shows.
Push the tail to 0.75 and the training cost down to 0.25 h. Colocate catches Elastic, and on four of the first five draws it wins. When almost every query runs into the timeout, every burst ends at the timeout no matter how cleverly the cells move, and Colocate's four steps per burst against Elastic's three start to count. The paper sees the same thing at full scale: on the 2.4T model, where 61.1% of queries run four hours or more, the gain over Colocate shrinks to 1.21x.
Pull the tail down to 0.2 instead. Attempts now finish close together, there is little tail to reclaim, and Elastic's lead over Colocate falls to about 1.1x. Its lead over Async barely moves, staying near 1.5x, because the four fixed training cells still sit waiting for whole batches whatever the durations do.
The execution is a tree
The second half of the paper is about what to train on, and it matters as much as the scheduling once a harness does real context management. Claude Code compacts its history when the context fills, delegates to sub-agents with their own contexts, and retries. One execution stops being one conversation. If you concatenate everything into a single sequence, some responses end up conditioned on text they never saw when they were generated.
The proxy records every model call token-in, token-out: the exact input and output token ids and the behaviour log-probabilities, the same capture idea as Hugging Face's multi-harness proxy. It also caches original tool-call payloads by call id and restores them before matching, because harnesses reformat tool calls and that would otherwise break prefix matching. Each new request is matched against existing paths; only the new suffix becomes a node, and a request whose context diverges starts a branch. The result is a prefix tree per execution in which every output keeps its original context, even after the harness compacted that context away.
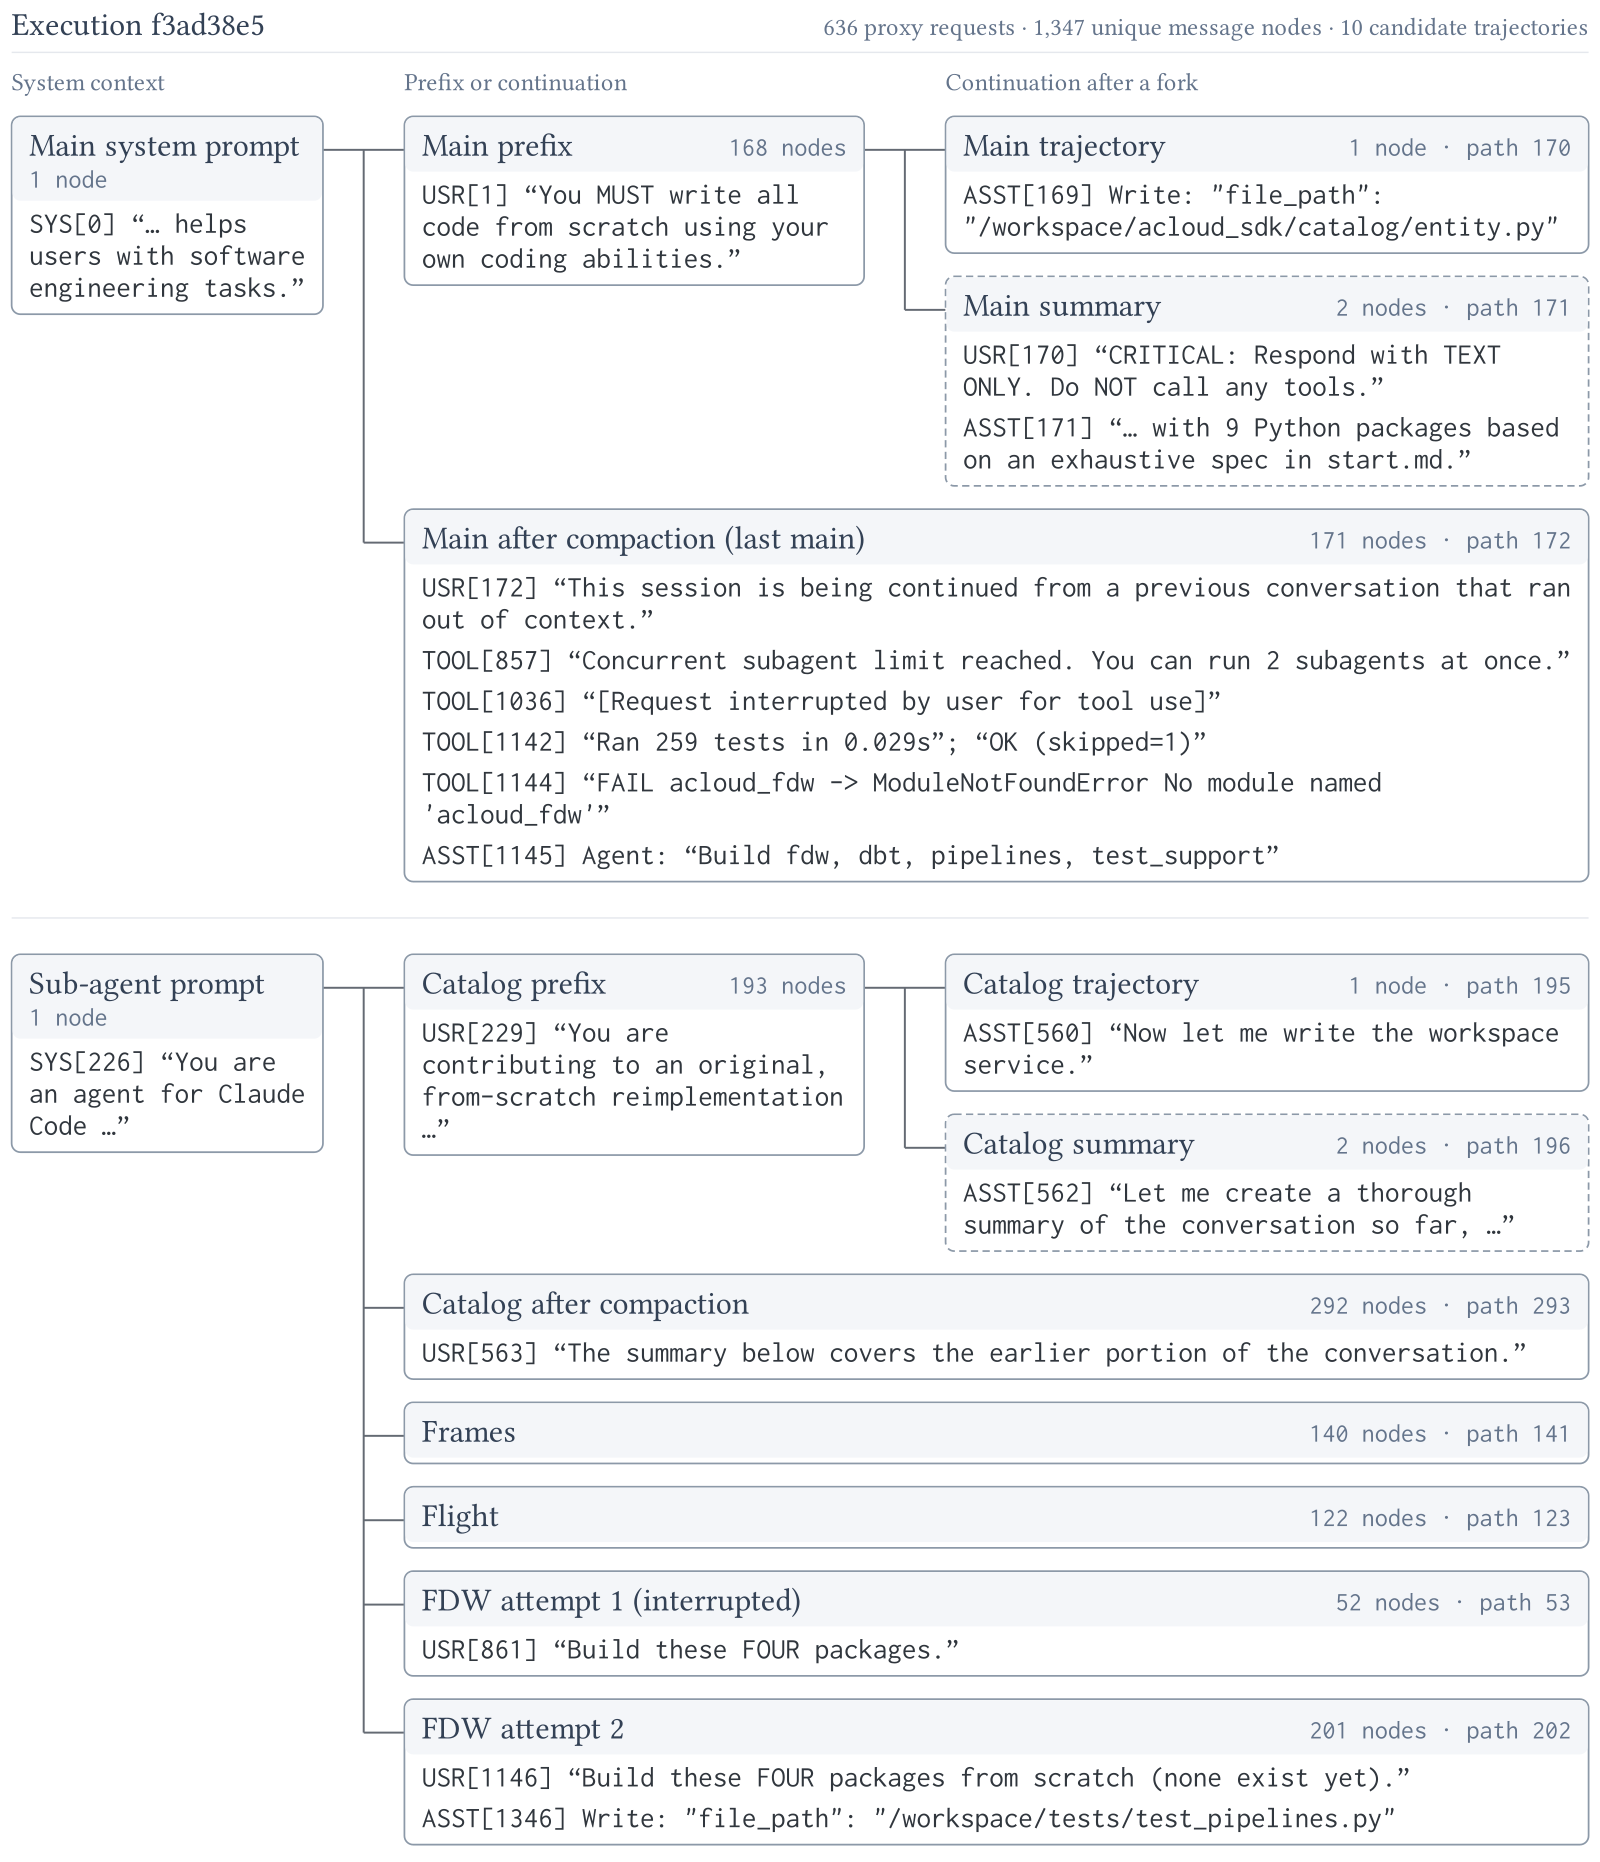
That trace has 636 proxy requests and 1,347 unique message nodes. Expanding its ten paths independently gives 1,716 node occurrences, 369 more than the tree, and each of those 369 is a repeated prefix that a naive pipeline would train on twice.
Admission works like this. Only tokens the policy itself sampled can be targets; system prompts, tool output, and assistant-role text the harness injected are context only. A summary is a target where the policy generated it and plain context where the harness pastes it back into the next user message, and the token-level record is what tells the two apart. Leaves are ranked by role, main over main-summary over sub-agent over sub-agent-summary, on the reasoning that the task reward credits the main agent's turns most directly. Then the processor draws leaves one at a time from the highest class that still has unmasked trainable tokens, with probability proportional to that count, fixes the drawn path's targets to whatever is still unmasked, and masks the whole root-to-leaf path. It stops when nothing trainable remains or after paths.
The widget uses the case study's shape and message counts. The split between policy tokens and context inside each segment is mine, and the paper says itself that message counts can't give the token probabilities. With the cap at 4 it admits both main paths, the main summary and one sub-agent path, which is the outcome the paper's Appendix C walks through for . With the cap at 3, the summary's shared prefix is already trained on the first main path, so it contributes only its own few tokens.
The loss normalization is where this pays off. Every admitted path inherits its execution's group-relative advantage, and token losses are averaged over the execution's disjoint target set:
So an execution that compacted five times and spawned six sub-agents carries the same total weight as one that ran straight through. A flat mean over trajectories would hand the branchy execution more say just for branching. Toggle the flat-mean view in the widget to see a 3-token summary path get the same weight as a 43-token main path. The objective itself is GSPO with token-level importance weights capped at 5 and a sequence-level clip of applied per execution; Qwen's first-order view of RL objectives is the background for why that ratio needs to stay so close to one.
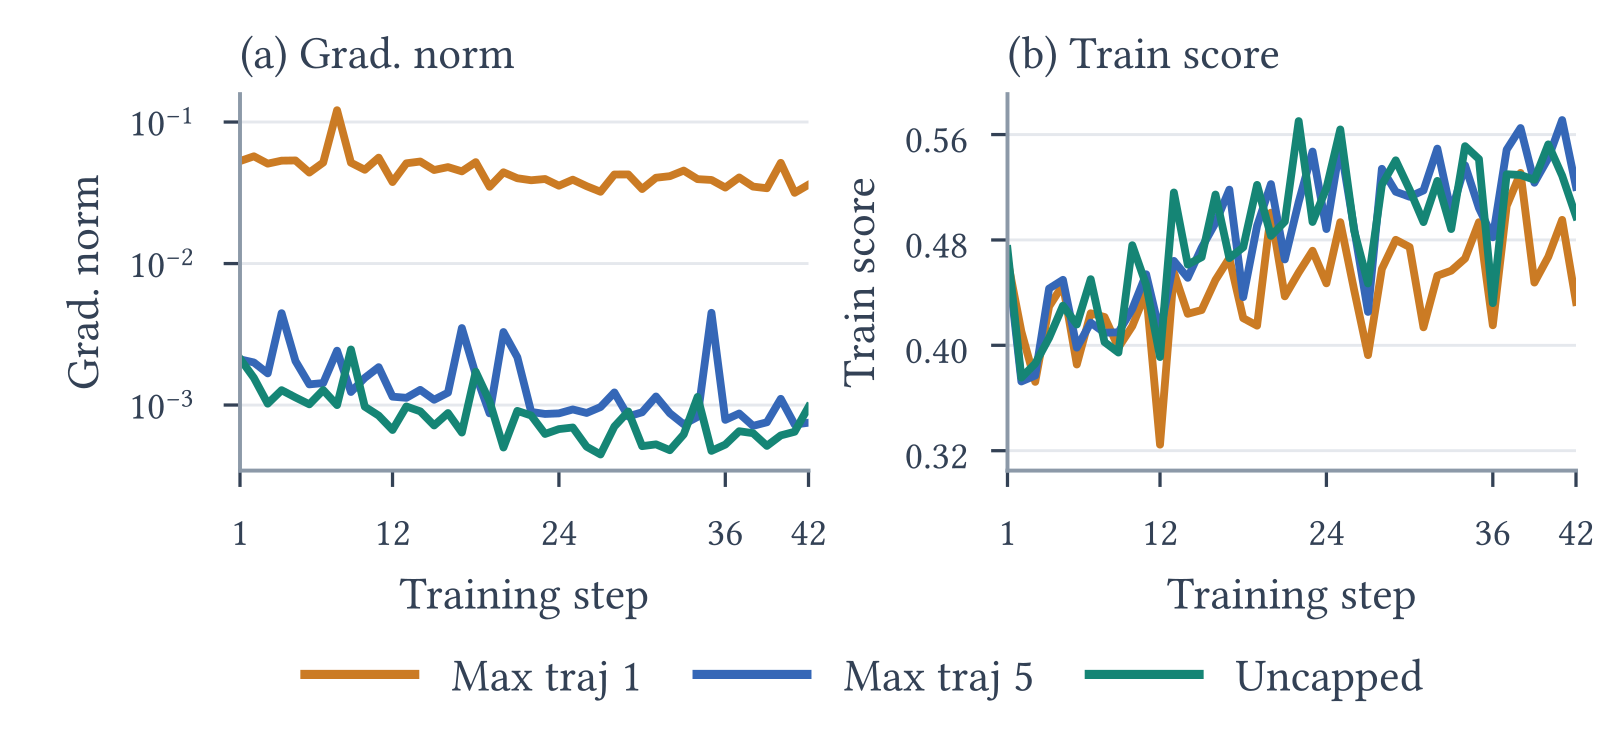
The cap is measured. With , main trajectory only, training scores lag and gradient norms run more than an order of magnitude higher. With the scores match training on every leaf, and forward-backward time per step is 74.8% of uncapped, 25.2% saved.
Partial scoring is the part the replies on X liked best, and it is simple. When an execution hits the harness timeout, its workspace is preserved and scored under the task's normal rule: on NL2RepoBench, a separate Qwen 3.7-Max evaluator runs independently written tests against whatever code exists. The reward never comes from elapsed time or termination status. A missing assessment, where the evaluator crashed or the overall budget ran out, is kept distinct from a valid zero and the execution is dropped. On the 2.4T run that split is 9.37% harness timeouts, scored and trained on, against 4.63% overall timeouts, discarded.
I couldn't find an ablation of partial scoring itself. One reply under the post asked how much of the six-point gain came from runs that would have scored zero before. The paper doesn't say.
Checking the numbers
I recomputed every derived number in Table 1 from its hour column. All of them reproduce: 1.556 for original Async against QwenGyre, 7.7% slower when Async's training pool shrinks to 8 nodes, 29.9% slower with three-step bursts, 11.6% faster with streaming, 2.9% and 14.8% for the two Colocate steps, 7.6% slower with the bigger standalone pool, and 1.19x, 1.24x, 1.08x and 2.2% for the E rows. The 2.4T totals check too: 134.55 h for Async, 91.47 h for Colocate and 75.42 h for QwenGyre give 1.784x and 1.213x, and the post's "~44% vs Async" is 1 minus 75.42 over 134.55.
Then I lined the headline numbers up with their experiments.
| claim | where it comes from |
|---|---|
| 1.85x over Colocate | TerminalBench, Qwen 3.6 122B, staleness 1.5, 24 steps (Table 2 prints 1.849) |
| 1.78x over Async | NL2RepoBench, Qwen 3.8 2.4T, 48 steps |
| 52.5% to 58.5% | the same 2.4T run's evaluation curve |
The intro gives the full ranges: 1.38 to 1.78 over Async and 1.21 to 1.85 over Colocate. The weakest result against Colocate is the flagship run. Nothing in the paper is wrong here, and the abstract's "up to" is accurate. But the post invites you to read 1.85 and 1.78 as one system on one workload, and they aren't.
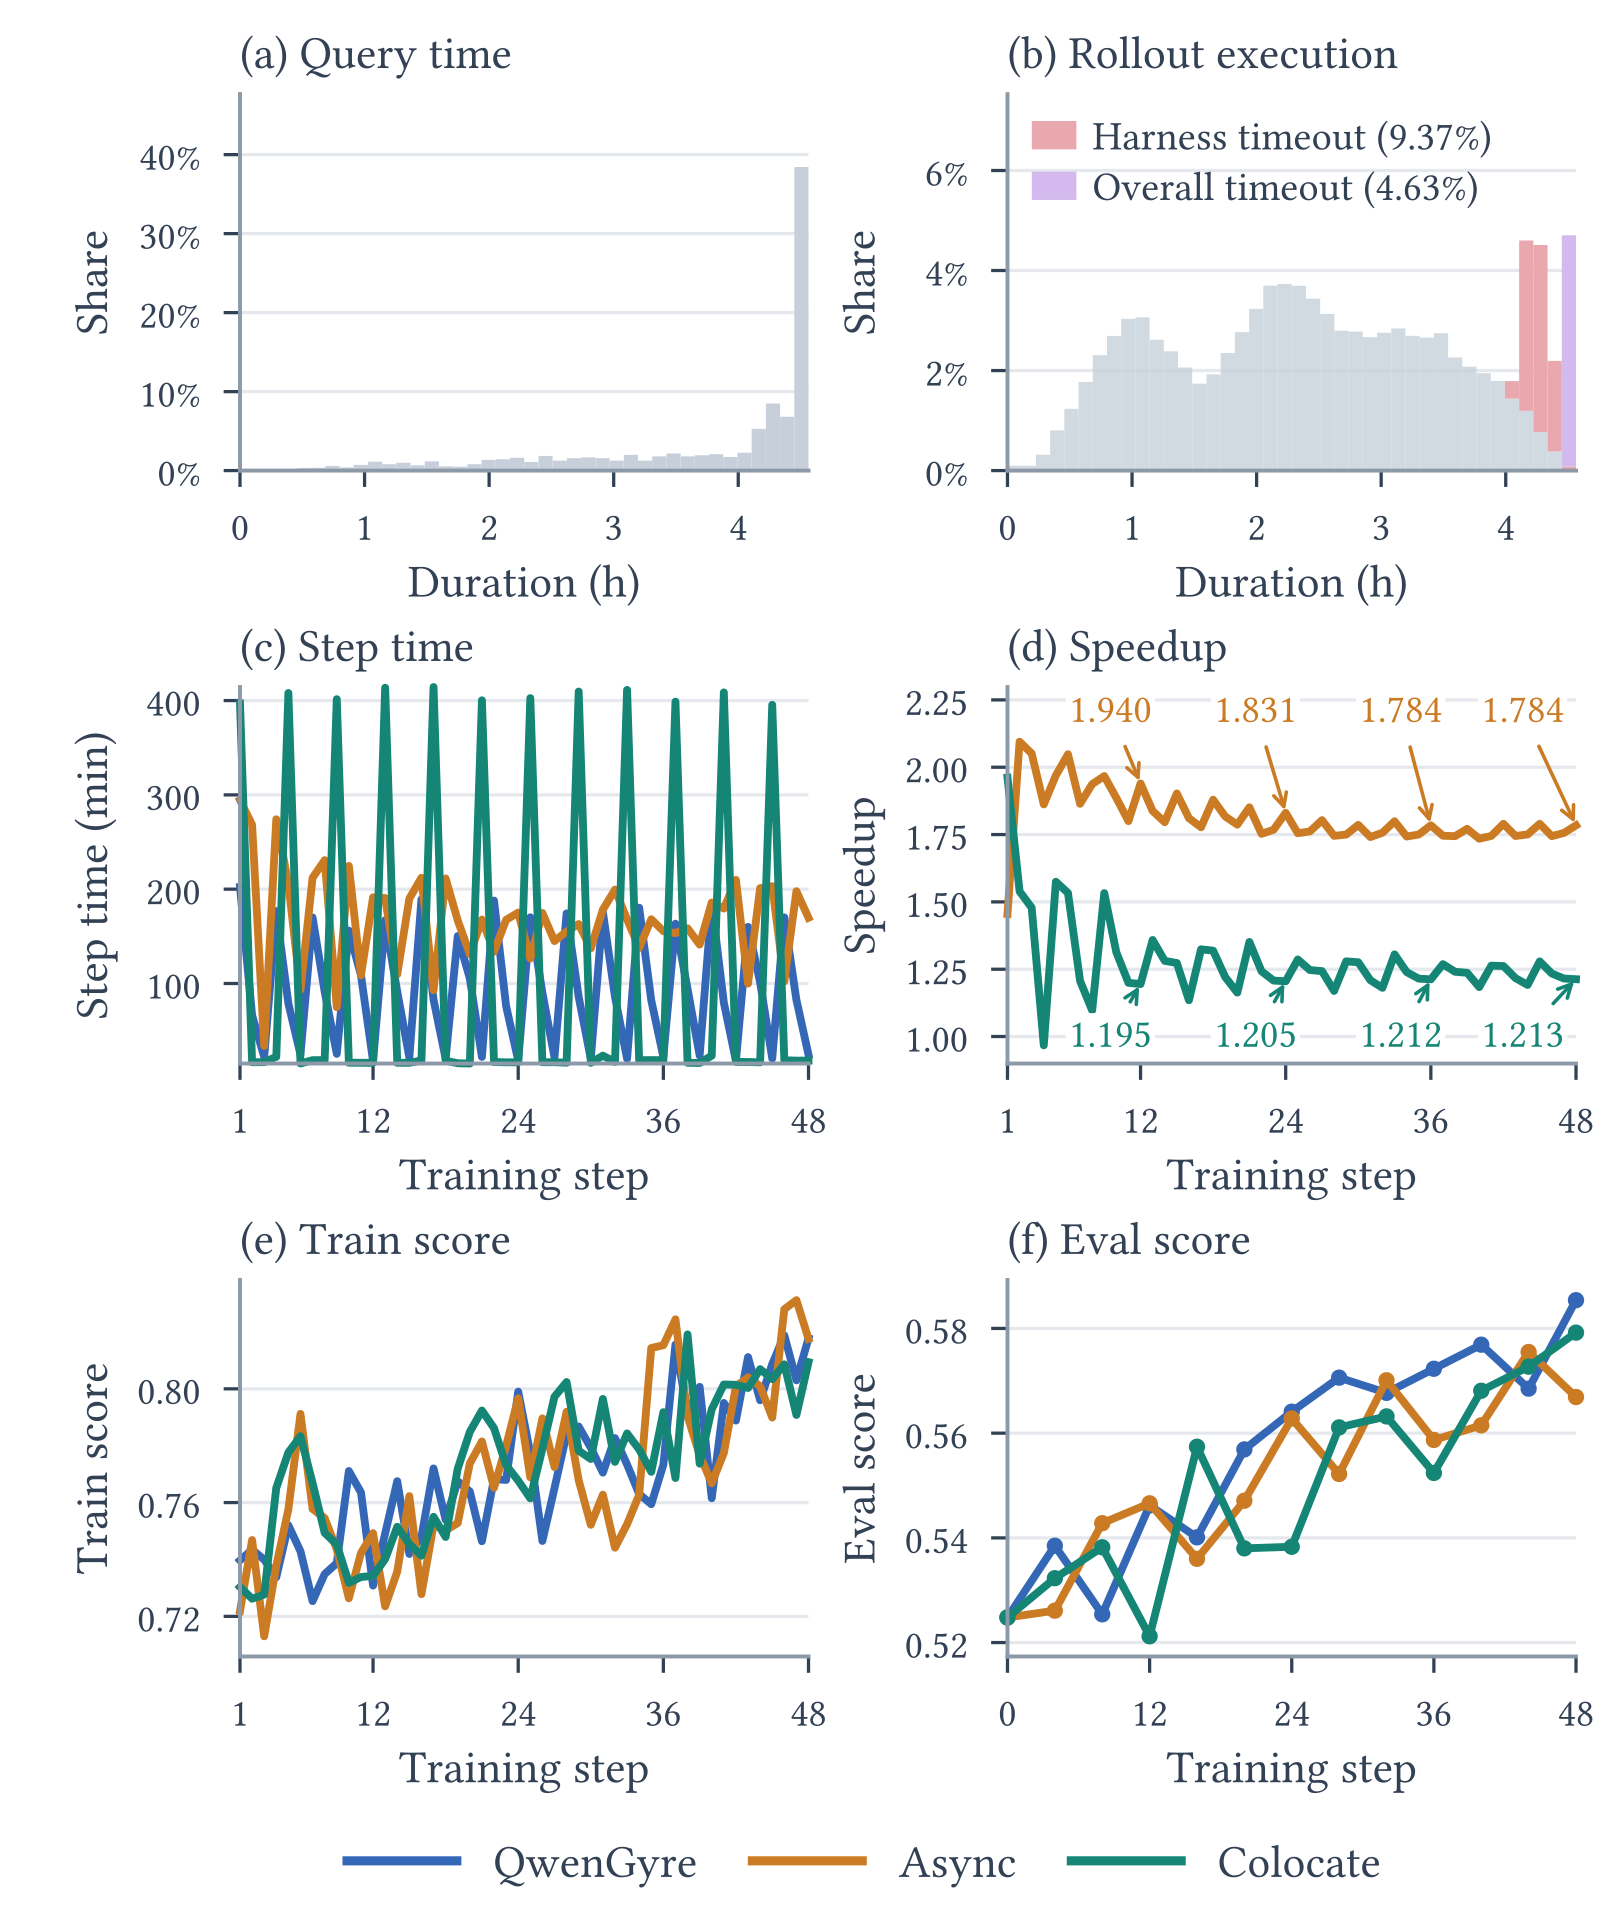
The evaluation panel of that figure matters more than the speedup panel. All three runs start at 0.525. Reading the chart, Colocate ends near 0.58 and Async near 0.57, against QwenGyre's 0.585. A scheduler should change wall-clock time and leave learning alone, and the paper argues exactly that, so the near-tie is expected. It also means the abstract's "QwenGyre yields a 6.0% absolute gain" credits the framework with what 48 steps of RL did. The gain is real. A run on Colocate gets most of it, about 16 hours later. For scale, the released Qwen3.8-Max reports 55.9 on NL2Repo-Bench in its launch table, so this run's 58.54 is an internal checkpoint under the paper's evaluation, not the shipped model's score.
The ablation table is the part I'd read twice.
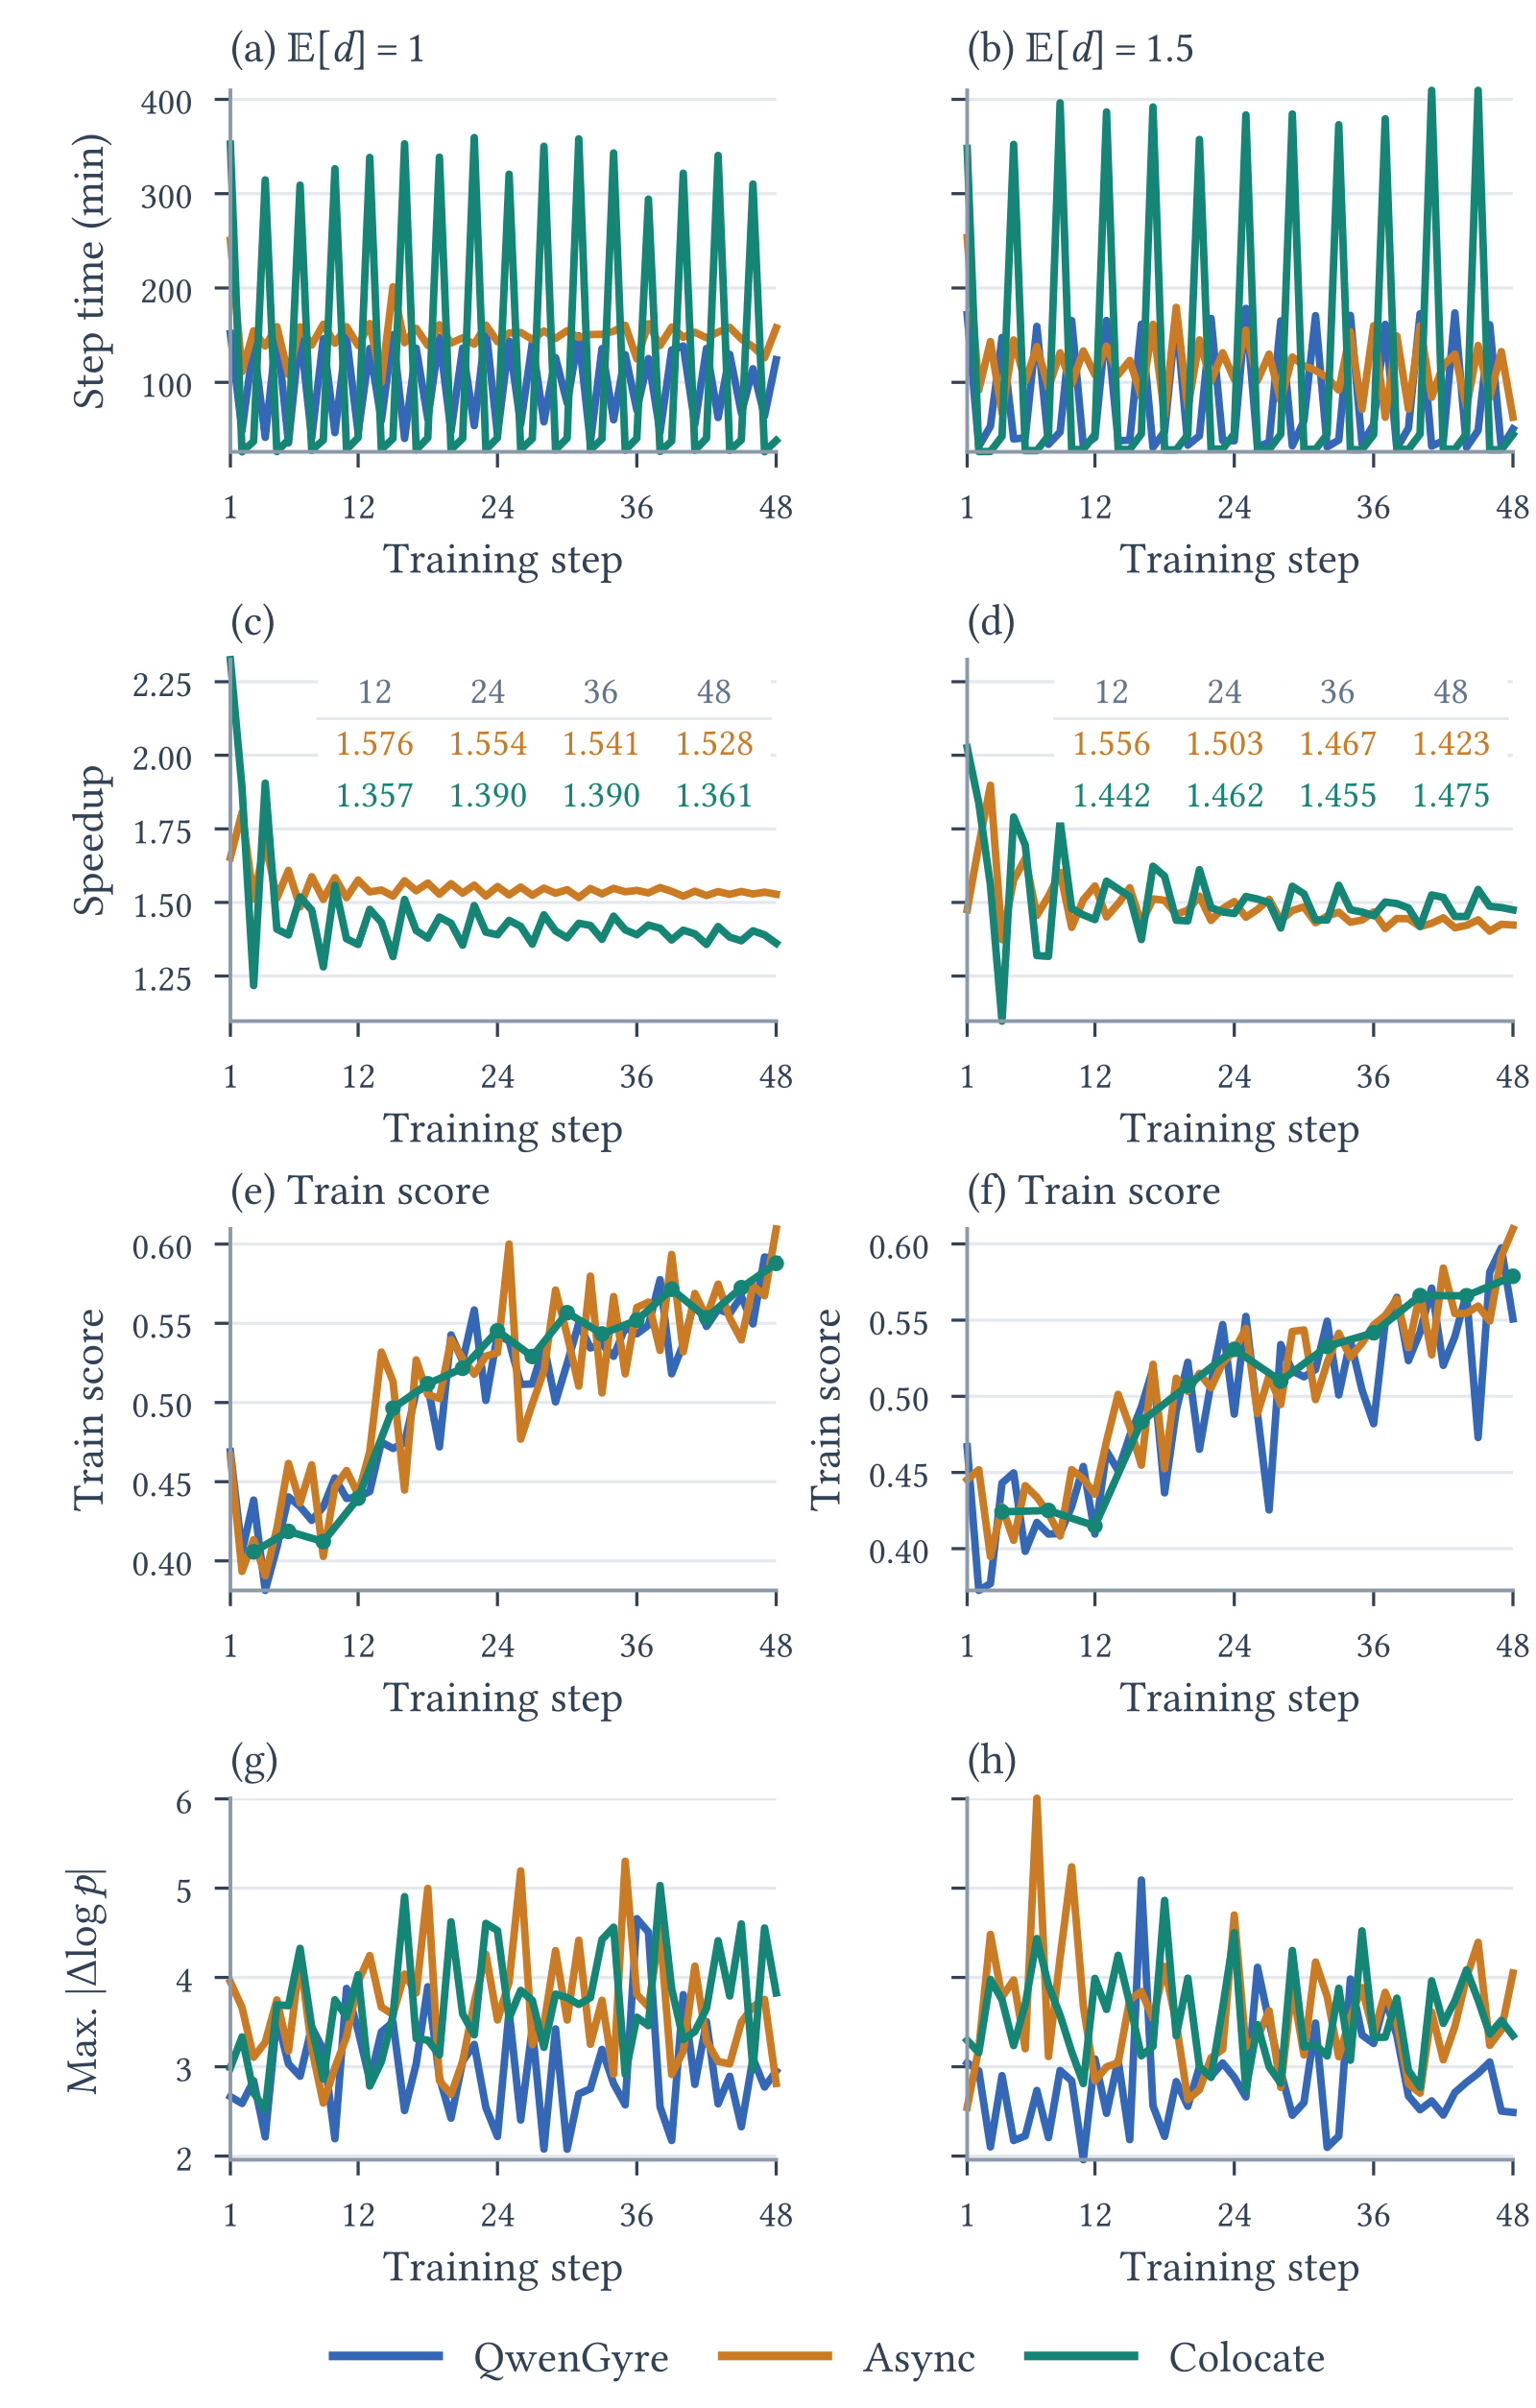
Table 1 walks from each baseline to QwenGyre over the first 12 steps on 32 nodes:
| run | what changes | hours | vs QwenGyre |
|---|---|---|---|
| A0 | original Async, 16 training / 16 rollout nodes | 25.08 | 1.556 |
| A3 | A0 plus streaming | 22.18 | 1.376 |
| C0 | original Colocate, all 32 nodes switch together | 23.23 | 1.442 |
| C1 | C0 with 4 standalone rollout nodes | 22.56 | 1.400 |
| C2 | C1 plus streaming | 19.23 | 1.193 |
| E0 | QwenGyre: eight 4-node cells switching independently | 16.12 | 1.000 |
| E2 | E0 regrouped as four 8-node cells | 16.47 | 1.022 |
Measure each step against the gap it closes. Colocate starts 7.11 hours behind QwenGyre. A standalone pool and streaming, C0 to C2, remove 4.00 of those hours, 56%, before any cell switches on its own. Async starts 8.96 hours behind, and streaming alone removes 2.90, about a third. Fine-grained elastic cells, the headline mechanism, are worth 1.19x on top of the best non-elastic configuration in the table. Still a solid result, but a team already running a colocated veRL-style stack would get most of the way with streaming and a small dedicated rollout pool, both of which are much less work than a scheduler that reroutes live harnesses.
E2 says the same thing from the other side: halving the number of cells costs 2.2%. The paper explains that E0 has 20.85% slack left, with training entirely hidden behind rollout, so coarser cells only expose a little training on the critical path. You don't need many cells. You need more than one.
Some things I couldn't check. Every configuration is a single run, so there are no error bars on any speedup, and with hour-scale durations drawn fresh each run, the noise could be a few percent. The Async split for the 2.4T run isn't stated; Table 1 shows that split alone moves Async by 7.7% on the smaller model, and the 1.78x is the comparison most sensitive to it. Hardware isn't named beyond node counts; the flagship comparison alone is 192 nodes for 301 hours across three runs. And the post's "Qwen3.8-2.4T-A95B" active-parameter count isn't in the paper; it matches what Alibaba published for Qwen3.8-Max.
What I'd take from it
For almost everyone the transferable parts are the cheap ones.
Count staleness the paper's way before comparing schedulers. is one line, it is exact under boundary dispatch, and it stops a fast async setup from quietly winning by training on stale groups.
Stream training at group granularity. Both the paper's ablation and my toy say this is the largest single lever, and it fits into Async or Colocate unchanged.
If you build anything elastic, borrow the waterlevel rule. "Leave rollout only when what remains covers everything outstanding" is the whole safety argument for not killing live harnesses, and it is a single comparison.
Normalize per execution, not per trajectory. Any harness that compacts or delegates will otherwise reward branching, and nothing on the learning-curve plots would tell you it was happening.
The elastic scheduler itself, with RDMA weight pulls, prefix-ordered communicator sets and live KV migration, is for teams running RL across a hundred-plus nodes on rollouts measured in hours. Several systems in the paper's related work already move GPUs between rollout and training (DynaResize, Libra, BiDiRL, TideRL), and Libra's satellites joining as data-parallel replicas is close to this. What QwenGyre adds is doing it under an unmodified harness that can't be paused, plus the evidence that it holds at 2.4T. The paper is also honest that streaming with several steps per burst gives up a global shuffle within the burst, and that the effect of that ordering on learning hasn't been isolated.
Related reading on this site: Rollout Routing Replay on why MoE RL needs the rollout-time routing recorded, LongStraw on fitting million-token RL steps into memory, DeepSeek's DSec on the sandbox side of the same loop, and SGLang, the rollout engine every cell here runs.
How I checked
I read the arXiv HTML of 2609.33848v1 in full, including Appendices A to C, and took the figures from it; the paper's Figure 1 is missing from the HTML build, so it comes from the image in Qwen's second post in the thread, which is the same figure. The announcement thread and its replies came through the fxtwitter mirror. I recomputed every ratio and percentage in Tables 1 and 2 and the 2.4T totals from the printed hours, and the staleness pairs from Equation 2. The 23.0% mean training share is the average of the eight values printed in Figure 6. The end-of-run evaluation scores for Colocate and Async are read off Figure 8's chart and are approximate. I probed QwenLM/QwenGyre and similar names on GitHub and searched Hugging Face for the name; neither exists. The simulator and the tree widget are mine, built from the paper's stated rules; their hours and token counts illustrate the mechanism and are not the paper's measurements.