PortSimEnv: real Barcelona berths, a proven optimum, and a 3D port that never touches the score
mdjsonmcp2026-10-06 · 27 min · reinforcement-learning · rl-environments · reward-design · benchmarks · agents
Why read this
Hightop 30%Re-implements PortSimEnv's floor and reward to match every stored score, and shows from 98 transcripts that open models hit the 32k cap, not the turn limit.
- Original, source-checked analysis
- Interactive explanations
- Runs on a laptop CPU
Training & RLMixed licencesPractitioner tool
How this was scored
- Is it new?
- 1 of 3: An incremental tweak
- Can I trust it?
- 3 of 3: Reproduces the headline result, or shows from primary files it is wrong
- Can I run it?
- 2 of 3: Open code or weights with real limits
- Will I understand it?
- 3 of 3: Mechanism carried by interactives built from real code or data
- Can I act on it?
- 2 of 3: A concrete recipe, numbers or comparison
- Will it last?
- 1 of 3: Relevant for months
- Does it affect many?
- 1 of 3: A specialist community
- Only here?
- 3 of 3: The only place this analysis exists
Score 72 of 100, ranked 70 of 445 rated articles. Each question is answered 0–3 by hand, and a 3 is rare. How articles are scored
I have read a lot of RL environments on this site this year, and nearly all of them are code, terminals, puzzles or a game. So when Adithya Kolavi posted "a RL simulation environment for port logistics", built "using real world port data", I wanted to know which part was real and which part was simulated. His own earlier post had set the bar: "Take real shipping data, turn real logistics problems into verifiable tasks, and let models learn to optimize routes, schedules, inventory, and the entire network."
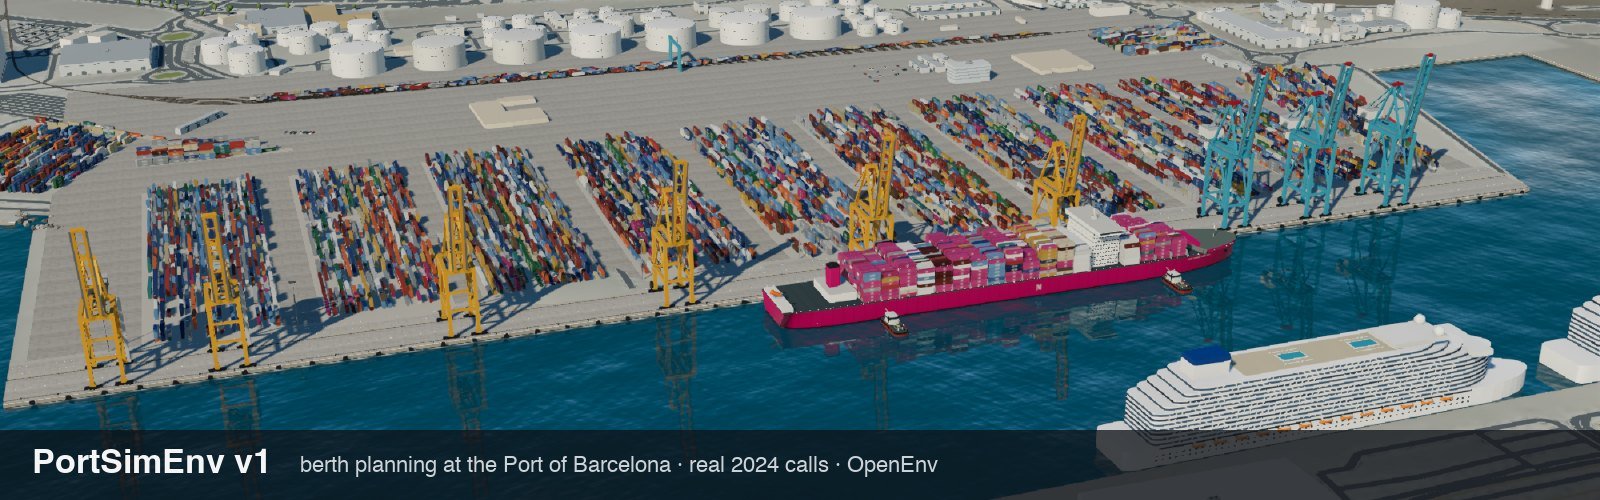
The answer turned out to be more interesting than either "it's a digital twin" or "it's a toy". PortSimEnv is a berth allocation problem, a scheduling puzzle that operations research has studied for decades, built on one port's real 2024 records, perturbed with realistic trouble, and graded against an answer key a constraint solver proved optimal. The 3D port that makes the demo video look like a game is a faithful replay of whatever plan the agent submits. It never changes a single digit of the reward.
I don't mean that as a complaint. It is the right design for a v1, and the grader is one of the more carefully built I have read. But it is a different thing from what "simulation" usually means in RL, and it changes what a model trained here would learn.
| Environment | FineEnvs/PortSimEnv (OpenEnv, Docker Space) |
| Tasks and rollouts | datasets/FineEnvs/PortSimEnv, CC BY-SA 4.0 |
| Write-up | Simulation RL Environments, part 1 |
| Code | adithya-s-k/FineEnvs, 07-simulation-environments/portsim-v1, Apache-2.0 |
| Packs | dock-v1: 1,050 train, 50 eval |
What the port actually wrote down
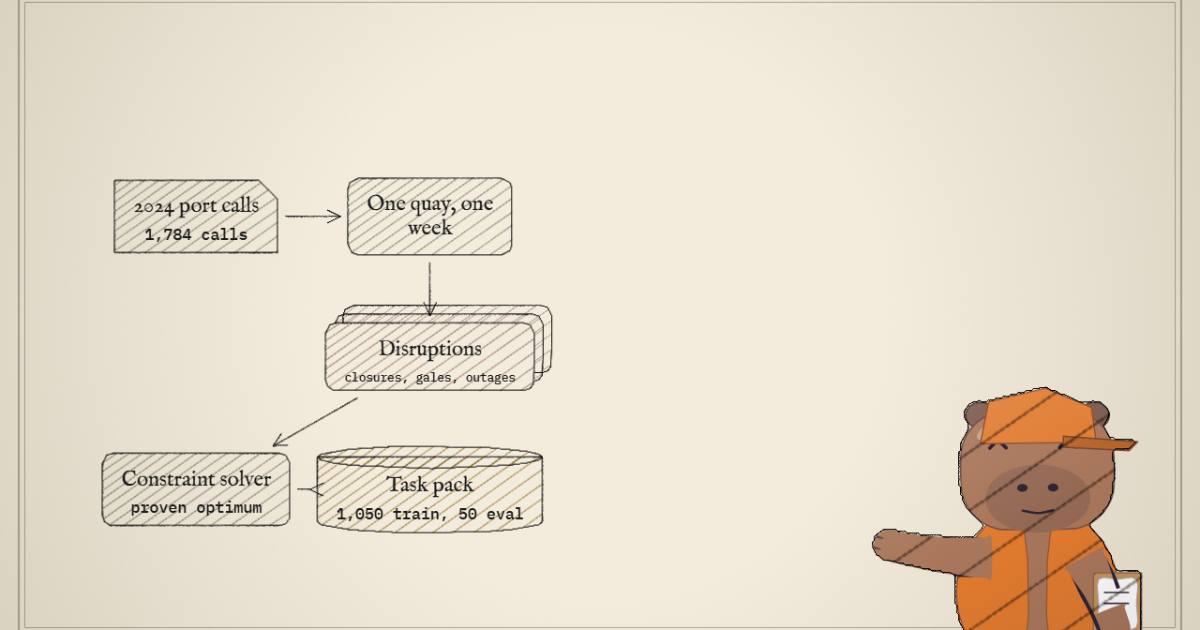
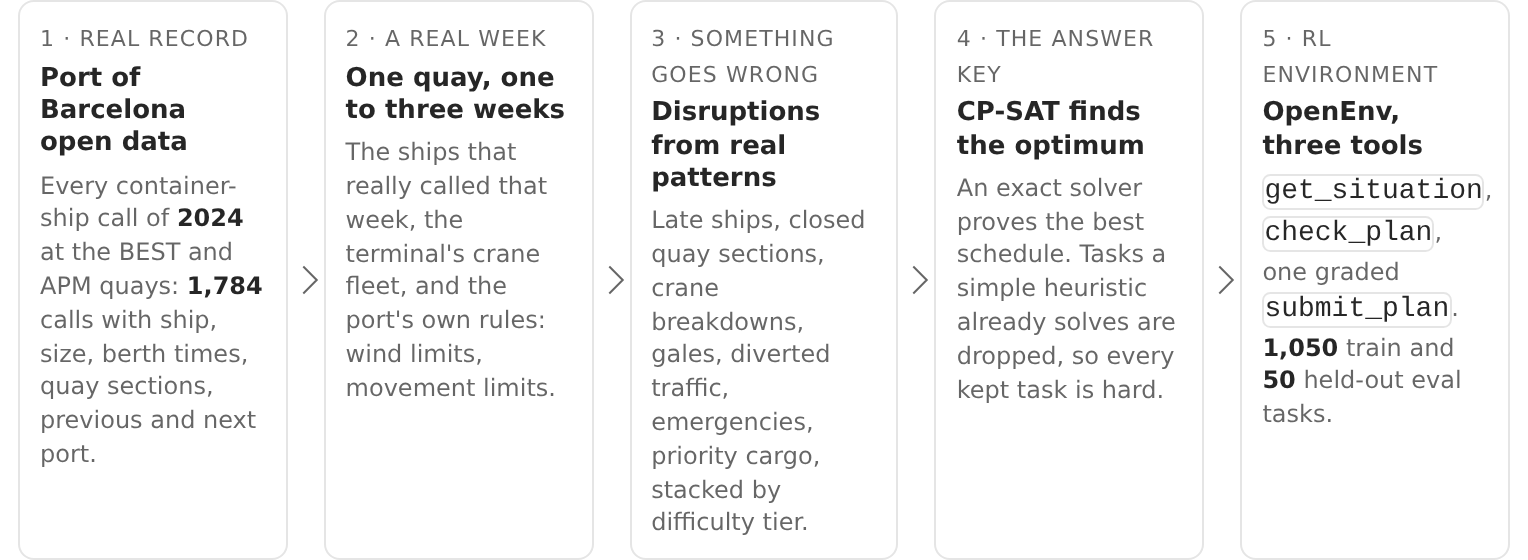
Everything starts from one CSV: data/barcelona/container_calls_2024.csv, 1,784 rows, one per completed container-ship call at the two container quays, 1,146 at quay 36A (Terminal Catalunya, operated by BEST) and 638 at quay 24B (APM Terminals). Each row has the ship's name, IMO number, length, beam and draught, the quay sections the port assigned, an ETA and ETD in UTC, and the previous and next port. Valencia is the most common previous port by a wide margin, 456 of the calls.
The data came from the Port de Barcelona open data portal, by way of a 2024 snapshot in Alberto Santini's berth-allocation-problems repository, which already turns those same two quays into benchmark instances for the classic problem. The licence is CC BY-SA 4.0, and the task pack inherits it.
The single most important sentence in the whole project is in data/barcelona/SOURCE.md:
ETA/ETD are effectively berthing and unberthing times (the 2024 record has only 21 overlapping pairs, all 1-hour or 1-section noise), so the record is the plan the port executed. It has no crane counts, moves or waiting times at anchorage.
I checked the 21. I counted pairs of calls at the same quay whose time windows and section ranges intersect, and got exactly 21. So the record is a finished, conflict-free berth plan. That tells you two things at once. First, there is no optimisation problem in the raw data: the port already solved every week. Second, "arrival" in a task is the hour the ship actually came alongside, not the hour it reached the anchorage. Someone in the replies asked where the vessel arrival times come from. They come from the berthing records, and the time a ship really spent waiting outside is invisible.
So every task has to break the week before there is anything to plan.
Filling the gaps, and which numbers are invented
A real week gives you ships, lengths, quay sections and how long each ship stayed. To make cranes a decision, the generator has to invent a workload, and the way it does that is worth knowing because it bounds everything downstream.
crane_class in generate.py:221 assigns each ship a standard crane count by length: 1 below 180 m, 2 below 260 m, 3 below 330 m, 4 above. The maximum is one crane per 50 m of hull, capped at 7, and the minimum is 2 for ships of 330 m or more. Then generate.py:232 sets the workload:
# berth_core/generate.py:228-235
def _with_cranes(ships, blocks):
    for s in ships:
        lo, hi, std = crane_class(s.length_m)
        s.min_cranes, s.max_cranes, s.std_cranes = lo, hi, std
        s.workload = s.handling * std
    for b in blocks:
        if b.kind == "alongside":
            b.cranes = 2  # a ship part-way through its call: assume two cranes until it leaves
So a ship's crane-hours are its recorded stay times the standard count for its length. Give it more cranes and it leaves sooner, ceil(workload / cranes). The "28 container moves per crane-hour" in the prompt only changes the units: the table shows workload × 28 as moves, and the rule divides by 28 × cranes, so the 28 cancels. The decision a model faces is crane-hours divided by cranes, which is a clean, fair abstraction, as long as you don't read "moves" as a container manifest.
The fleets are real-ish. BEST gets 13 cranes; quay 24B gets 9, which the code comments explain as APM's 14 cranes prorated to the 24B share of a 1,515 m quay. Wind rules come from the port's 2023 traffic ordinance: ships of 300 m or more may not berth or leave above 25 knots, nobody moves above 30, and a ship that finishes inside a gale waits alongside, still occupying its sections.
One documented number didn't match the data. The design notes say at most 3 movements per hour at 36A and 2 at 24B. The code sets max(BASE_MOVES_PER_HOUR[quay], peak_moves), the larger of that base and the peak of the published plan, so a busy week lifts its own limit. In the eval pack, 10 of the 23 tasks at 24B run with a limit of 3. It's a reasonable choice, since a limit the real plan broke would make the real plan infeasible on day one, but the documented number is only the floor.
Then the disruptions, drawn per difficulty tier and seed in dock.py. I counted each type's share of tasks myself and they match the article's table to within a point:
- closures of 5 to 9 sections for 18 to 48 hours, in every task;
- late ships, 4 to 24 hours behind their slot, in every task;
- crane outages of 2 or 3 cranes, in 88% of training tasks;
- priority cargo (lateness counts triple) in 86%, emergencies (dock by a deadline or pay 10 per section per hour) in 76%;
- unscheduled calls in 62%, gales in 62%, bunched arrivals in 45%;
- diverted traffic from the other terminal, 36A only, in 16%.
Every one of those is a fact in the opening message. Nothing arrives mid-episode. The module docstring of dock.py says it plainly: "All information is given up front; the difficulty is the size and the coupling of the problem."
The task, from the model's side
This is the top of a real eval task, dock-24B-w06x1-busy-0, exactly as the environment sends it. I picked it because it is the one in the project's demo video, and I will follow it through to the grade.
# APM Terminals Barcelona, Port of Barcelona - quay 24B, week 6 of 2024
Hour 0 is Monday 05 February 2024 00:00 UTC. Times are whole hours from then.
The quay is sections 2-22 (about 42 m each). ...

## Notices
- Unscheduled call: ship 16 FOS EXPRESS (294 m, 7 sections) arrives at hour 69,
  has 1344 moves and asks to sail by hour 91. ...
- Sections 9-14 are closed from hour 164 to hour 207 (quay crane rail repair).
- Sections 14-22 are closed from hour 104 to hour 126 (dredging along the berth).
- Ship 5 NANTO was delayed leaving Alicante: it now arrives at hour 74
  (planned slot hour 54). Its planned departure stays hour 67.
- 2 of the terminal's 9 quay cranes are out of service from hour 49 to hour 83 ...
- Priority: ship 2 CMA CGM DALILA carries transshipment cargo ...

| id | ship           | length m | sections | arrives | workload (moves) | cranes min-max | planned berth          | planned departure |
| 2  | CMA CGM DALILA | 334      | 8        | 24      | 2352             | 2-6            | 24 @ 7, 4 cranes       | 45                |
| 9  | NAGOYA EXPRESS | 335      | 8        | 111     | 2128             | 2-6            | 111 @ 15, 4 cranes     | 130               |
...
Seventeen ships, nine cranes, two closures, a late ship, an outage, a priority ship, an unscheduled call. Notice NANTO: it now arrives at hour 74 and is due out at hour 67. Some lateness is already locked in before the agent does anything, and that fact turns out to shape the whole reward.
The agent answers with one entry per ship:
[{"ship": 0, "berth_hour": 0, "section": 4, "cranes": 1},
 {"ship": 1, "berth_hour": 7, "section": 9, "cranes": 3}, ...]
The rules are the ones a berth planner lives by. Dock at or after arrival and never inside a wind window that applies to you. Keep your consecutive sections on the quay. Never share a section-hour with another ship, a ship already alongside, or a closure. Stay inside your crane range, keep the cranes working in every hour within the pool minus any outage, and keep berthings plus departures per hour within the movement limit. The cost is the sum over ships of sections × hours late × weight, plus the emergency penalty, plus 5 for each scheduled ship moved off its planned first section.
The toy below has the same rules on a ten-section quay with four made-up ships, small enough to reason about by hand. Start from the published plan, which breaks two rules, then try to beat the "CORAL waits" plan.
- BALEAR: berths at hour 0 but cannot arrive before hour 4
- CORAL: overlaps closed sections 1-4 during hours 6-14
check.py and reward.py. Dashed ticks are each ship’s due hour. The optimum (24) and floor (16) came from an exhaustive search over this toy. Wind windows and the movements-per-hour limit are left out.The interesting move in the toy is the one the real tasks are full of. CORAL's planned berth is closed, so it can wait for the closure to end on its own sections, which costs 72 because it is priority cargo, or it can move to the other end of the quay right after BALEAR leaves and take three cranes instead of two, which costs a 5-point move penalty and nothing else. The crane outage in hours 10 to 16 leaves exactly the three cranes CORAL then needs, so nobody else can be worked beside it until it leaves. Moving one ship changes the crane budget of another. That coupling, at 15 to 59 ships per task instead of four, is the difficulty.
How the grader works
The grader is berth_core/check.py, about 190 lines of pure Python with no solver dependency, so the server can grade without OR-Tools installed. evaluate() builds a rectangle in time × sections for each ship, collects every rule break per ship with a readable message, and returns a cost only if there are none. The messages are worth reading because they are the whole feedback channel. These are the real ones GLM-5.3 got back from its first check_plan on the week-6 task:
ship 8: gets 4 cranes but can be worked by 1-3
ship 8: overlaps ship 9 (NAGOYA EXPRESS) in sections 8-9 during hours 116-128
ship 8: cranes over the pool at hours 116-127 (e.g. hour 121: 12 in use, 9 available)
ship 13: overlaps closed sections 9-14 during hours 164-207
Then the reward, reward.py:74:
def score_v3(cost, feasible, clean_fraction, optimum, gap_k, unavoidable=0):
    if not feasible or cost is None:
        return INFEASIBLE_CAP * clean_fraction, 0.0          # 0.2 x clean ships
    g = max(0, cost - optimum) / (max(0, optimum - unavoidable) + gap_k)
    quality = math.exp(-g / GAP_TAU)                          # GAP_TAU = 0.5
    return INFEASIBLE_CAP + (1.0 - INFEASIBLE_CAP) * quality, quality
In math, with the plan's cost, the CP-SAT optimum and the floor:
Two design choices in that line carry the whole thing.
The first is the hard cliff at 0.2. Any rule break caps the reward at 0.2 times the share of ships with no violation, so a feasible plan, however late, always beats an infeasible one. Malformed entries (unknown ship ids, duplicates, non-integer hours) count as extra unclean units in the denominator, which keeps a garbage plan strictly below the feasible floor. An episode with no submission scores 0. For RL this ordering is what you want: every group of rollouts gets sorted feasibility first, quality second.
The second is the floor , check.unavoidable_cost at check.py:172. For each ship on its own, it takes the earliest legal berthing hour and the most cranes the ship can use, and charges whatever lateness is still left. No plan can do better for that ship, so the sum is a hard lower bound on any plan. The gap is measured against , the part of the cost a planner actually controls, plus 100 so small tasks don't become knife-edged.
I re-implemented the floor and the reward from reading the code, without running any of the project's. On the week-6 task my floor is 48 and the optimum is 87. Claude Sonnet 5.5's plan cost 92, which gives and a reward of 0.944468, the exact value stored in the rollout. GLM-5.3's plan cost 87, made of 72 in weighted delay and three moved ships at 5 each, which is the optimum and scores 1.0. Sonnet's plan had the same delay and one more moved ship. One unnecessary move, five cost points, about five and a half points of reward.
How much of a typical optimum is unavoidable? I ran my floor over all 1,100 tasks: the median floor is 78% of the optimum in eval and 74% in train. The design notes say "about three quarters", and the data agrees. That ratio explains why the floor exists at all.
The reward went through three versions, and all three are still in the file
reward.py keeps its history. score is v1, score_v2 is v2 and score_v3 is v3, and a task's rules.reward picks one. Every dock-v1 task carries reward: 3, so only v3 is live. But the other two are a small lesson in reward design, so they are worth a look.
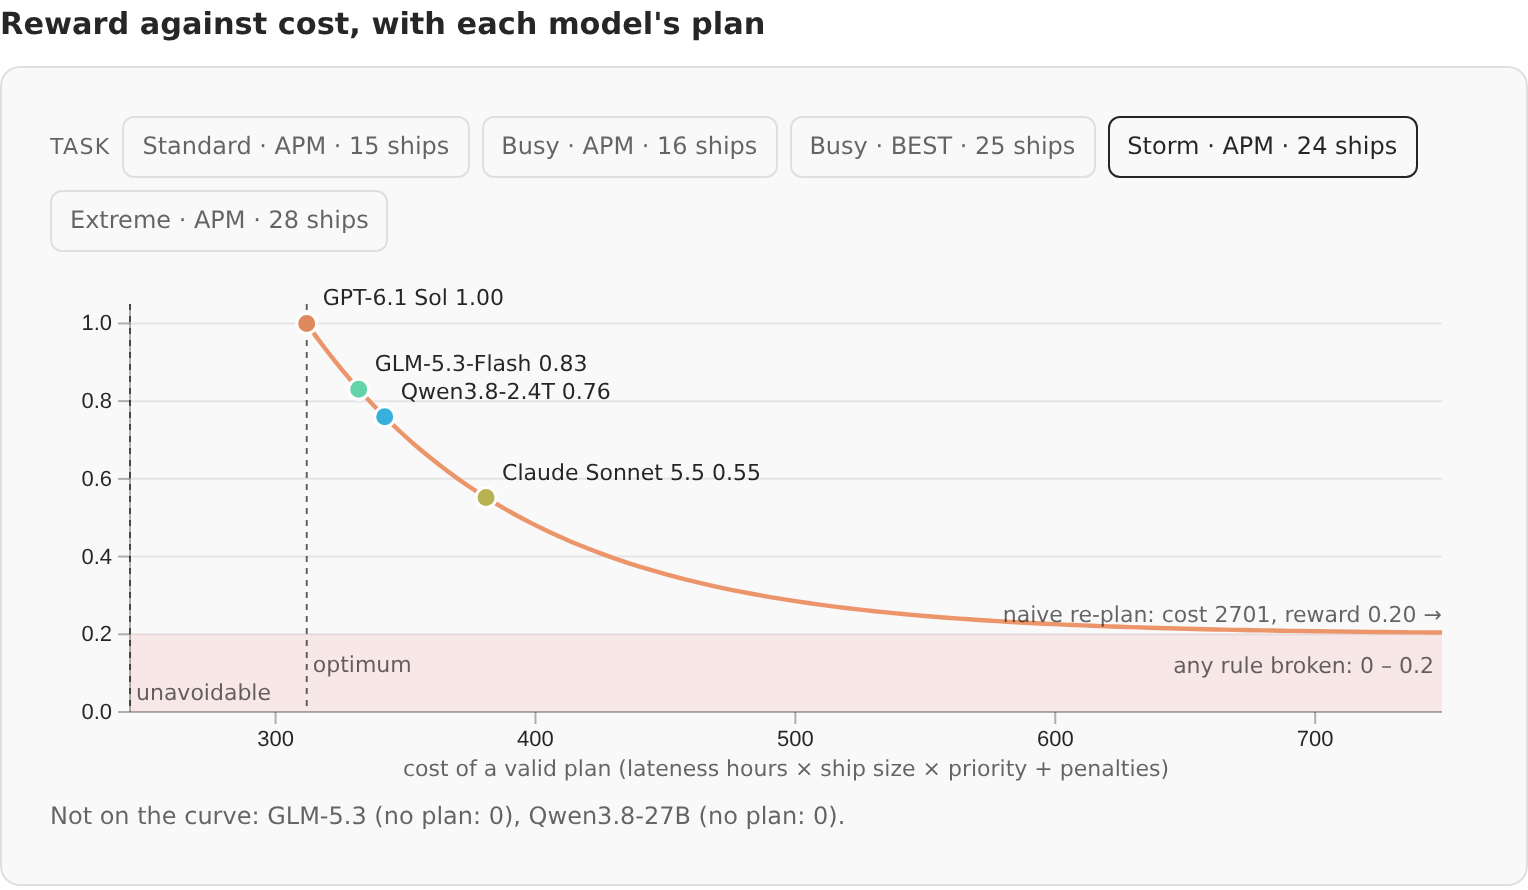
v1 anchored the scale on the naive re-plan, the quick fix that keeps slots that still work and pushes the rest to the next free hour: 0.6 at naive cost, 1.0 at the optimum, linear in between. The trouble is that the naive plan is often terrible. On the storm task in the source article, naive costs 2,701 against an optimum of 312. Anything better than a disaster lands high on that scale. The design notes say a plan three times the optimum scored 0.93 on a big task under v1. I found a sharper case. On dock-36A-w06x1-busy-0 the optimum is 40 and the naive plan is 824, so a plan at three times the optimum, 120, would get 0.959 under v1. v3 gives it 0.455.
v2 swapped the linear band for an exponential, but still divided by naive minus optimum, so it inherited the same problem in a softer form. v3 drops the naive plan from the formula entirely and divides by the avoidable cost. Pick a task and drag the cost:
unavoidable_cost rule; dots are the feasible eval plans on the live v3 curve. Only v3 grades dock-v1.The steepness is the point and the risk. On the storm task, Sonnet's plan at 381 is 69 above the optimum and scores 0.552. On the BEST busy week, Sonnet is 20 above the optimum at 60 and scores 0.801. Near the optimum v3 separates good plans from great ones, which is what a GRPO-style group needs once a policy is mostly feasible. A policy that is mostly infeasible will spend its early training learning the cliff, and v3 says nothing to it about cost at all.
There is one piece of drift. The module docstring at the top of reward.py, and the docstring of openenv/berth_openenv/rubric.py, still describe the v1 bands, with 0.6 at the naive plan, and a cost_quality child that is "0 at the naive re-plan's cost". The code does not do that on dock-v1. cost_quality is the exponential term of v3. Anyone who reads the rubric's docstring to understand what they are training against will get the wrong curve.
The answer key
Every reward depends on , so the solver is the part I most wanted to check. solve.py:77 builds an OR-Tools CP-SAT model that reads almost like the rules written out:
# berth_core/solve.py, condensed
for s in task.ships:
    t = md.NewIntVar(s.arrival, horizon, f"t{s.id}")                       # berthing hour
    m = md.NewIntVar(task.first_section, task.last_section - s.sections + 1, f"m{s.id}")
    for k in range(s.min_cranes, s.max_cranes + 1):                       # one optional interval
        p = md.NewBoolVar(f"p{s.id}_{k}")                                 # per crane count
        crane_iv.append(md.NewOptionalIntervalVar(t, s.handling_for(k), t + s.handling_for(k), p, ...))
        crane_dem.append(k)
    ...
md.AddNoOverlap2D(xs, ys)                                   # ships and closures as time x quay rectangles
md.AddCumulative(crane_iv, crane_dem, crane_pool)           # outages enter as fixed intervals
md.AddCumulative(move_iv, [1] * len(move_iv), cap)          # 1-hour intervals at berthing and departure
md.Minimize(sum(terms))                                     # weighted lateness + deadlines + moves
The gale rule is the fiddly part. A ship whose work finishes inside a no-movement window departs at the end of the window, which the model encodes with a reified boolean per window. The naive plan is passed in as a solver hint. A candidate task is kept only if the solver gets within 1% of its own bound, the naive re-plan scores at most 0.6, a greedy heuristic at most 0.85, and the week has at least 12 ships (dock.py:287).
I checked what came out. Every one of the 1,100 tasks has proven_optimal: true, so the 1% tolerance never had to be used on a kept task. My re-implemented reward puts the naive re-plan at no more than 0.444 and the greedy heuristic at no more than 0.816 across all 1,100, the same 0.44 and 0.82 the project reports.
The greedy number surprised me more than the cap did. Its median reward is 0.21 on training tasks, barely above the feasible floor. The greedy policy in baselines.py takes ships in arrival order and gives each the most cranes it can get, which sounds sensible and is ruinous: the first ships hog the pool, and everything behind them waits. Being greedy with cranes is the classic local mistake in this problem, and the environment punishes it hard.
The tests (core/tests/, which the design notes count at 331 parametrised cases) include an independent checker that builds an hour-by-section occupancy grid instead of rectangles and must agree with evaluate() on feasibility, cost and which ships break rules over hundreds of perturbed plans. Hostile plans with NaN, booleans, huge numbers, 50× repeated entries and text inside the JSON must neither crash the grader nor pass it. I read the tests; I did not run them.
An episode, end to end
The environment is an OpenEnv MCPEnvironment with three tools. get_situation() returns the text above. check_plan(plan) returns violations, per-ship departures and delays, and the plan's cost, but never a score and never the optimum, and you get 10 of them. submit_plan(plan) ends the episode and is graded once. A hard cap of 24 tool calls ends an episode with reward 0. From the README:
from openenv.core.env_server.mcp_types import CallToolAction
from openenv.core.mcp_client import MCPToolClient

env = MCPToolClient("https://fineenvs-portsimenv.hf.space").sync()
obs = env.reset(task_id="dock-24B-w07x1-busy-0")        # or reset(split="train", index=0)
rules = obs.observation.metadata["instructions"]          # the system prompt
situation = env.step(CallToolAction(tool_name="get_situation", arguments={}))
plan = [{"ship": 0, "berth_hour": 0, "section": 9, "cranes": 3}]
print(env.step(CallToolAction(tool_name="check_plan", arguments={"plan": plan})).observation)
check_plan is the clever part of the interface. Giving the agent its own cost is like giving it a compiler. It can hill-climb on the number in front of it, but it never learns how far it is from the best. GLM-5.3's week-6 episode is a clean example. Its three drafts came back with 9, 5 and then 0 rule breaks. The second draft still gave NAGOYA EXPRESS 8 cranes, two over its limit of 6, and overlapped CMA CGM MONTREAL. The fix brought NAGOYA down to six cranes and moved MONTREAL from hour 131 to 133, and the third check reported a feasible plan at cost 87. It submitted and got 1.0. GPT-6.1 Sol reached the same 87 with one check and 4,154 output tokens.
So the episode is a single action with a verifier in the loop. In RL terms it is close to a contextual bandit: one decision, one terminal reward, with up to ten free looks at the cost function on the way. That matches how the project frames it. The v1 card on its roadmap reads "one quay, one plan, graded once", and the next card is "live simulation".
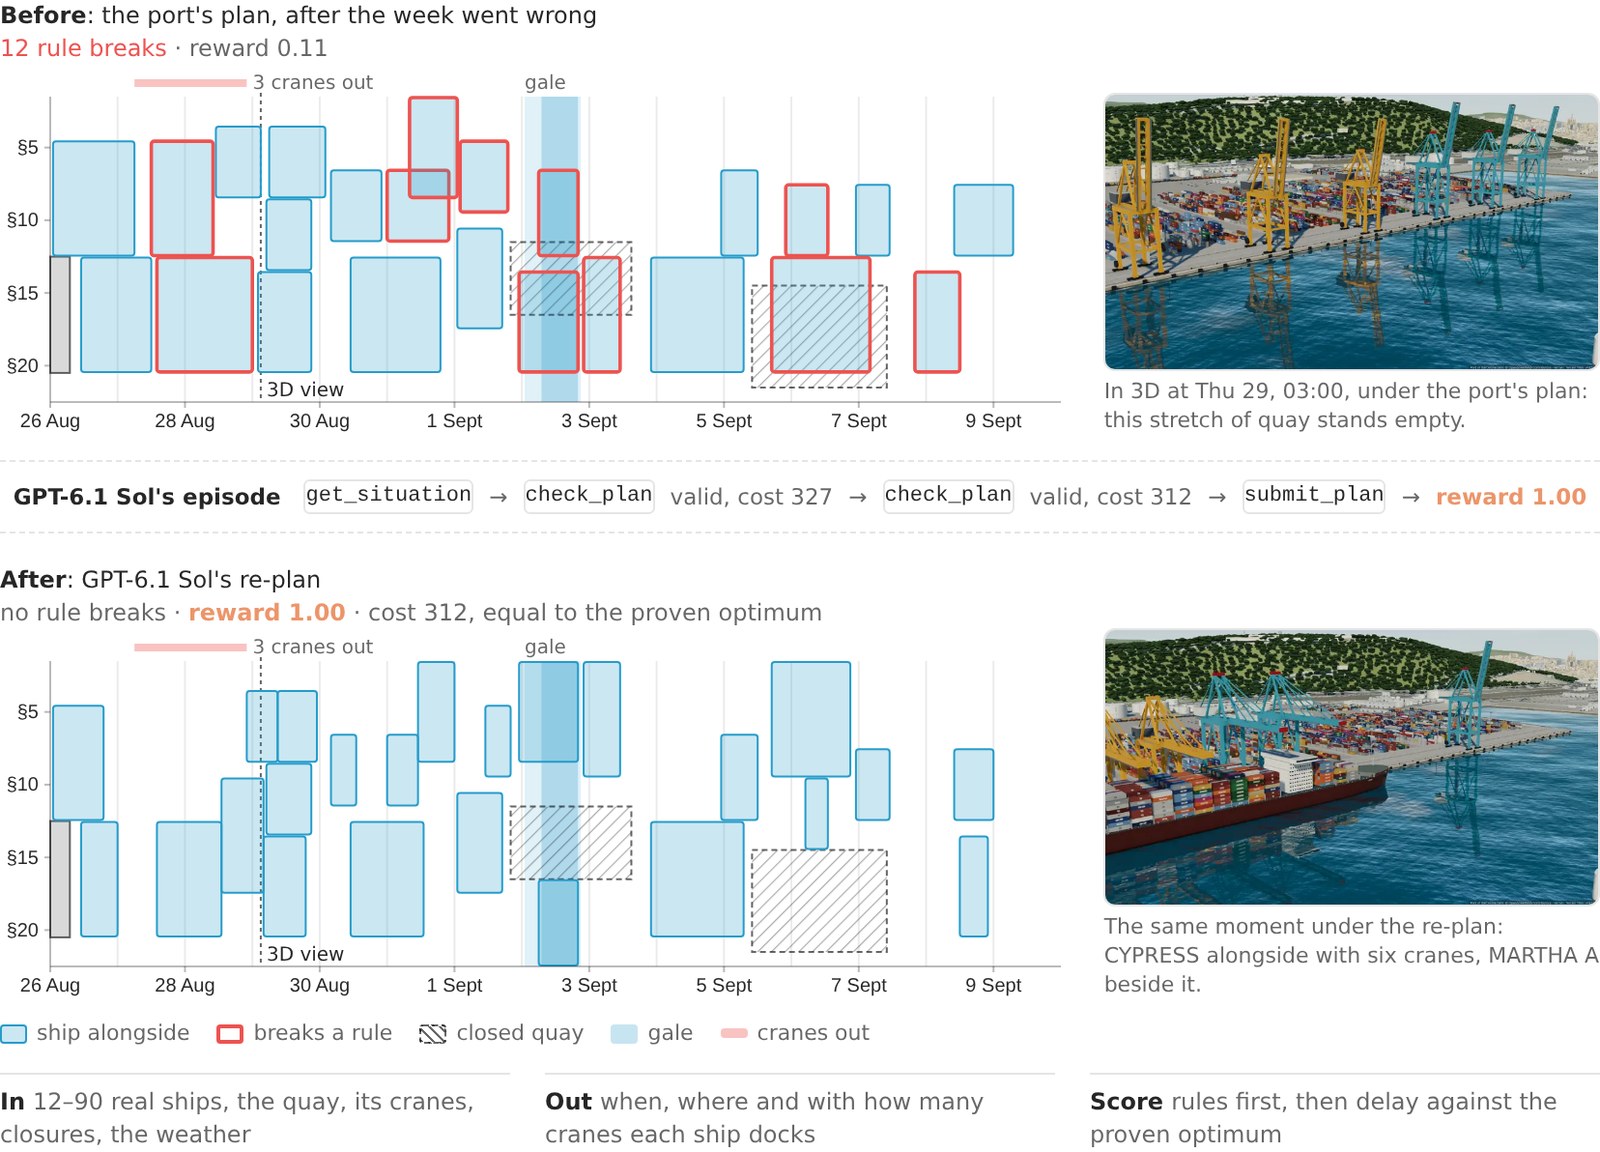
The 3D port is a replay
The twin is a lot of work. The design notes list 46,913 building footprints from OpenStreetMap, terrain tiles for Montjuïc, each quay at its real bearing and length, BEST's automated stacking blocks and APM's straddle-carrier yard, ships in their lines' liveries, tugs, separated anchorage slots, a kinematic controller that checks hull envelopes against the shoreline, and cranes that move specific containers to reserved yard slots. A set of Node regression tests replays all 50 optimal eval plans through it and checks separations.
And then the same document says: "The 3D replay is a visualisation of the submitted schedule and never changes the cost or the reward." If a tug path is blocked, the controller holds the ship at anchor "with a reason" on screen, and the reward does not hear about it. The cargo is "representative handling, not a container manifest."
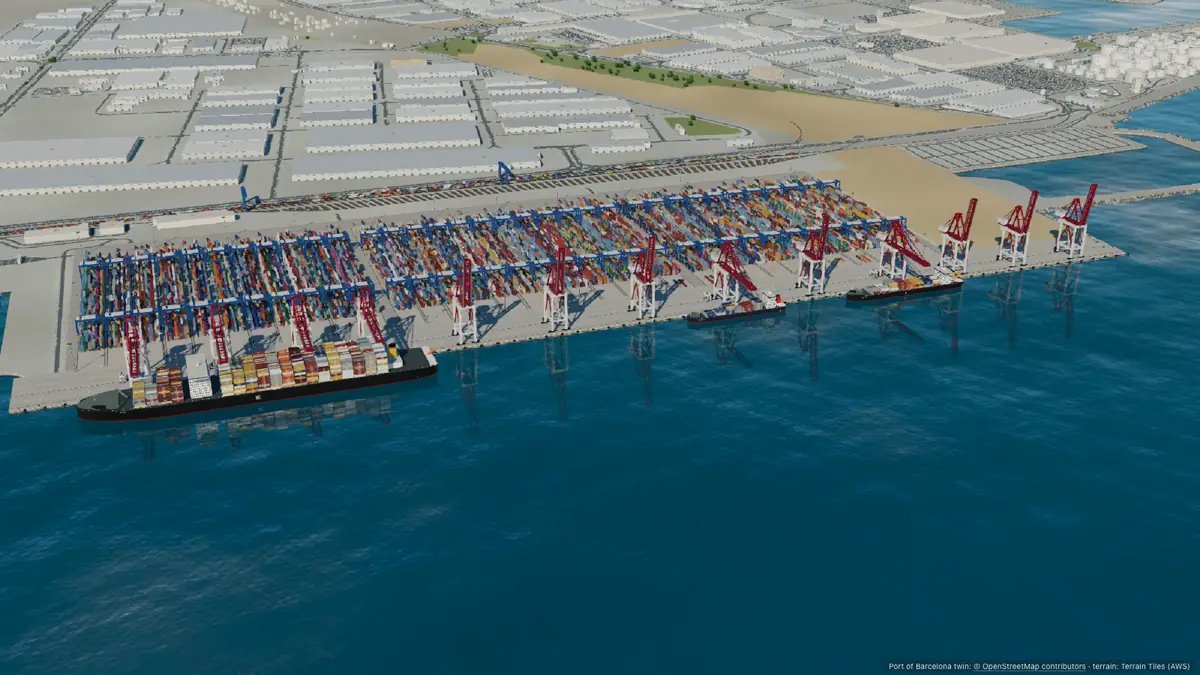
I think keeping the twin out of the reward was right. A kinematic tug model that can veto a plan would make the reward depend on code nobody can prove anything about, and the whole value of this environment is that its answer key is proven. But it means the word "simulation" is doing two jobs. One reply asked whether this "in essence just test[s] how good the model is in discrete optimisation". For v1, yes. The simulation is the costume and the replay. The environment is the optimisation.
What the eval measured
Six models ran the 50 held-out tasks once each, with 12 turns and 32k output tokens per turn. The 50 eval tasks come from 25 distinct quay-week windows inside ten held-out ISO weeks, and no week appears in training. The headline:
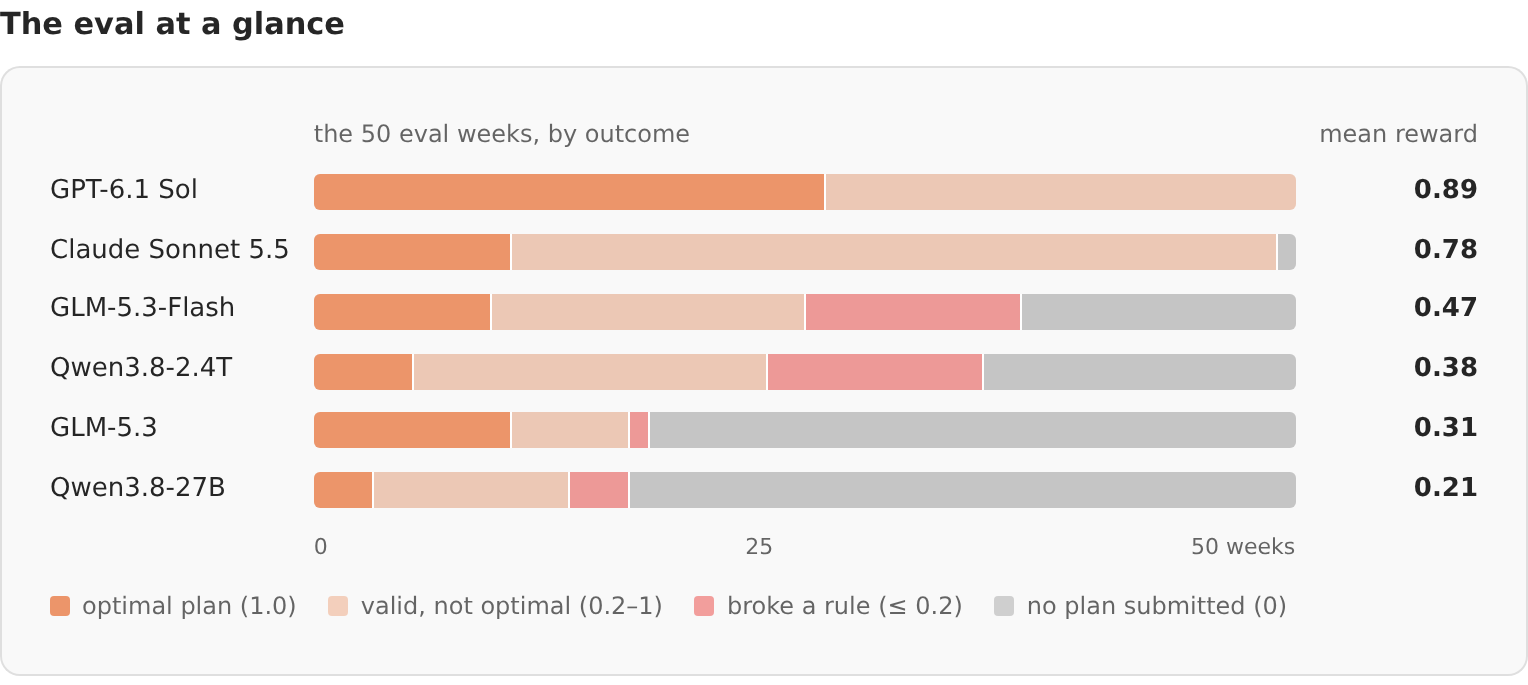
I recounted every number in the README table from results/rollouts/dock-eval50/index.json and they hold: GPT-6.1 Sol 0.888 with 50 valid plans and 26 at the optimum, Claude Sonnet 5.5 0.782 with 49 and 10, then GLM-5.3-Flash 0.470, Qwen3.8-2.4T 0.380, GLM-5.3 0.313 and Qwen3.8-27B 0.211.
The README's explanation of the bottom four is the part that doesn't hold. It says the open models "spend their output budget reasoning and run out of turns". I pulled the transcripts from the dataset's rollouts config and looked at how each of the 98 episodes without a submission ended. Every one of them, including Sonnet's single miss, ended on the harness rule at agent.py:376: two turns in a row without a tool call end the episode. And in all 98, both of those turns stopped on the output-length limit. 79 of the 98 ended after exactly two turns. They did not run out of twelve turns. They ran out of 32k tokens in one turn, got a nudge with the tail of their reasoning, ran out again, and were cut.
That changes what the bottom of the table measures. GLM-5.3 submitted 17 times; 16 of those plans were valid, 10 were optimal, and its mean reward on the valid ones was 0.966, higher than GPT-6.1 Sol's 0.888. Qwen3.8-27B's 13 valid plans averaged 0.790. The project's article makes the same point more gently ("getting them to submit is the first thing to train"). I'd put it more strongly. For four of the six models, this eval mostly measures whether a model can finish thinking about a 28-ship table in one 32k-token turn. GPT-6.1 Sol's median episode used 5,480 output tokens and Sonnet's 24,264. For GLM-5.3, GLM-5.3-Flash and Qwen3.8-27B the median is 64,000: two capped turns.
Size is the other axis. I split the eval by ship count. On the 20 tasks with 25 ships or fewer, GPT-6.1 Sol averages 0.99 and Sonnet 0.92. On the 15 tasks with more than 35 ships, they fall to 0.75 and 0.63. The extreme tier is not hard because of exotic disruptions so much as because it is two or three weeks long.
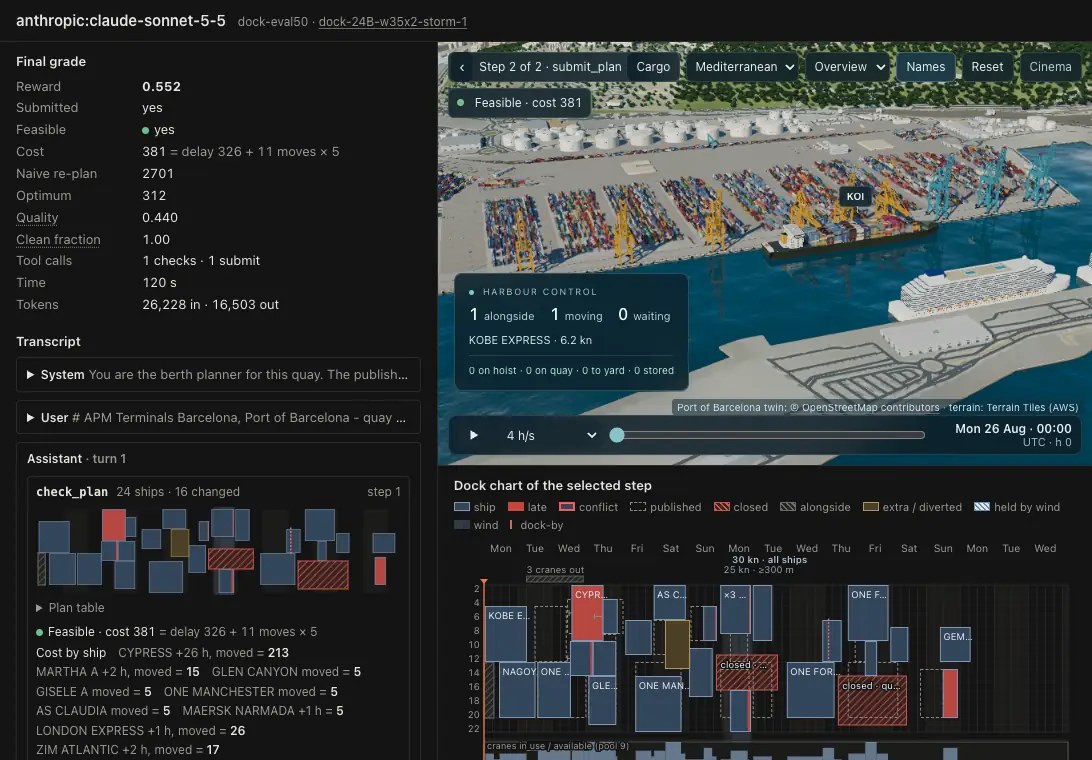
Where it sits among RL environments
Set next to the other environments this site has taken apart, PortSimEnv's distinctive property is the answer key. Code environments like the ones in MiMo's release or Prime Intellect's catalogue grade with tests, which are binary and can have false negatives. Skill2Env adds a rubric channel and finds that it fights the tests. Adithya's own GeoGuessr environment has a continuous reward from distance, but no notion of "best possible". Here, every task carries a provably optimal cost and a provable floor, so the reward is continuous, calibrated per task, and has a known ceiling of 1.0 that a model can actually reach. GPT-6.1 Sol reaches it on 26 of 50.
The interface is the familiar OpenEnv shape, the same one the multi-harness RL guide plugs coding agents into. Three tools, MCP, a rubric object that only scores submit_plan. Nothing special, which is a compliment: it should drop into a TRL GRPO loop the way the GeoGuessr one did.
Against the operations-research literature it is a modest problem. Santini's repository frames the 2024 Barcelona instances as hyb|dyn|fix|max(comp) in Bierwirth and Meisel's taxonomy of berth allocation problems: hybrid quay, dynamic arrivals, fixed handling times. PortSimEnv makes handling time depend on cranes and adds a crane pool, outages, a movement limit and weighted lateness, which moves it into berth allocation with crane assignment. CP-SAT proved every kept task optimal inside the build's 300-second limit on eight workers. So nobody needs an LLM to plan Barcelona's week. The question the environment asks is narrower: can a language model, with no code tool, do constrained combinatorial planning from a long table and a verifier? The environment gives no code tool, which is what makes that a fair question. A model allowed to write Python would call OR-Tools and the task would collapse.
A few things would make me cautious training on it. The 1,050 training tasks come from 132 quay-week windows, about eight disruption seeds per real week, so a policy sees the same real ship lists many times. Both quays are in one port; one reply predicted that "a policy that learned on the port with the cleanest data is going to have a rough first day at any other port", and v1 gives no way to test that. The workloads are derived from recorded stays, the ships already alongside always hold 2 cranes, and the 3D layer is a replay. None of that is hidden. The README calls it work in progress, and the roadmap's next step, a live simulation where delays and breakdowns arrive during the episode, is the step that would make "simulation" literal.
What I would use it for today is something narrower and still useful: a dense, exact, cheap-to-grade reward for structured planning under hard constraints, with a verifier tool that teaches a model to check its own work before committing. The eval already shows that the first thing it teaches is to stop thinking and submit.
How I checked
I read the environment Space (FineEnvs/PortSimEnv, commit fddf26c) and the GitHub copy in adithya-s-k/FineEnvs (b0f4c2f); the berth_core and berth_openenv sources are identical between them. I read model.py, check.py, reward.py, solve.py, generate.py, dock.py, baselines.py, prompts.py, environment.py, rubric.py, agent.py and the four core test files, plus DESIGN.md, SOURCE.md, both READMEs, the dataset card and the source article's chapters. I ran none of the project's code. I wrote my own Python to recompute the floor (unavoidable_cost) and the v1 and v3 rewards from the task JSON; it reproduces the stored rollout rewards I compared, including 0.944468 on the week-6 task. From tasks.jsonl (eval) and tasks.jsonl.gz (train) I counted ship counts, proven-optimal flags, disruption shares, movement limits, distinct week windows and the naive and greedy rewards. I counted the 21 overlapping call pairs in the CSV. The per-model figures come from results/rollouts/dock-eval50/index.json, and the stop reasons from the messages column of the dataset's rollouts/eval.parquet. The toy quay's optimum and floor came from an exhaustive search I wrote. The test count of 331 is the design notes' figure; I did not run the tests. The figures are screenshots and images from the project's own article and Spaces, served from this site.