2026-08-23 · 14 min · on-device · quantization · c · tool-calling
Why read this
Notabletop 60%How a 45M model runs from flash on a $5 ESP32 via the Hadamard identity, and a row-by-row account of 20.8 points lost in the decode loop.
- Original analysis
- Runs on a phone
- A lasting reference
Inference & servingPractitioner tool
How this was scored
- Is it new?
- 2 of 3: A real new idea, method or capability
- Can I trust it?
- 2 of 3: Measures key facts from files, code or configs
- Can I run it?
- 2 of 3: Open code or weights with real limits
- Will I understand it?
- 2 of 3: Mechanism from first principles with figures
- Can I act on it?
- 2 of 3: A concrete recipe, numbers or comparison
- Will it last?
- 2 of 3: A reference for a year or more
- Does it affect many?
- 1 of 3: A specialist community
- Only here?
- 2 of 3: A teardown or measurement few others did
Score 66 of 100, ranked 211 of 577 rated articles. Each question is answered 0–3 by hand, and a 3 is rare. How articles are scored
MimiModel runs a 45M-parameter tool-calling language model on a $5 microcontroller. No Linux, no Python, no network. One C99 file, libm as its only dependency, and 13.7 MB of weights that are never loaded into RAM — because the chip has 512 KB of it.
| Model | Cactus Needle 2 — 45M params, 2-bit CQ, 13.7 MB |
| Hardware | ESP32-S3, 240 MHz Xtensa LX7, 16 MB flash, 8 MB PSRAM |
| Engine | one C99 file, libm only |
| Speed | 2.11 tok/s prefill · 1.73 decode · 14.9 s warm, 32.8 s cold |
| Accuracy | 69.6% on google/mobile-actions, strict — the official engine gets 69.2% on identical inputs |
That last row is the interesting one, and it is not interesting for the reason it looks.
Two things this repository is
The first is a port, and ports are usually only interesting to the people doing them. The second is an accuracy investigation that happens to be one of the cleanest pieces of experimental attribution I have read this year. It is worth separating them, because the port is charming and the investigation is useful.
Start with why the port had to exist. Cactus publishes both an engine and the model, and ESP32-S3 is listed as a supported target — so cross-compiling should have been the whole job. It isn't, for two reasons that are worth knowing if you ever plan to port anything:
- The compute core ships as a binary. The open engine has
ModelType::NEEDLEand the prompt formatting, but searching it forengram— a core part of the architecture — returns no implementation. The layers live in prebuilt platform libraries distributed through Hugging Face. - The open kernels are ARM-only. All 15 kernel files include
arm_neon.h, using roughly 125 NEON intrinsics with no scalar fallback, plus_Float16/__fp16about 770 times. Xtensa GCC does not provide those types on this path.
So "supported target" meant supported for targets that are ARM and have the binary. What made an independent engine possible anyway is that the model repository is open enough: export.py documents the .cact format at byte level, and the exported file carries its own architecture geometry. The spec was public even though the implementation wasn't.
How 13.7 MB fits in 512 KB
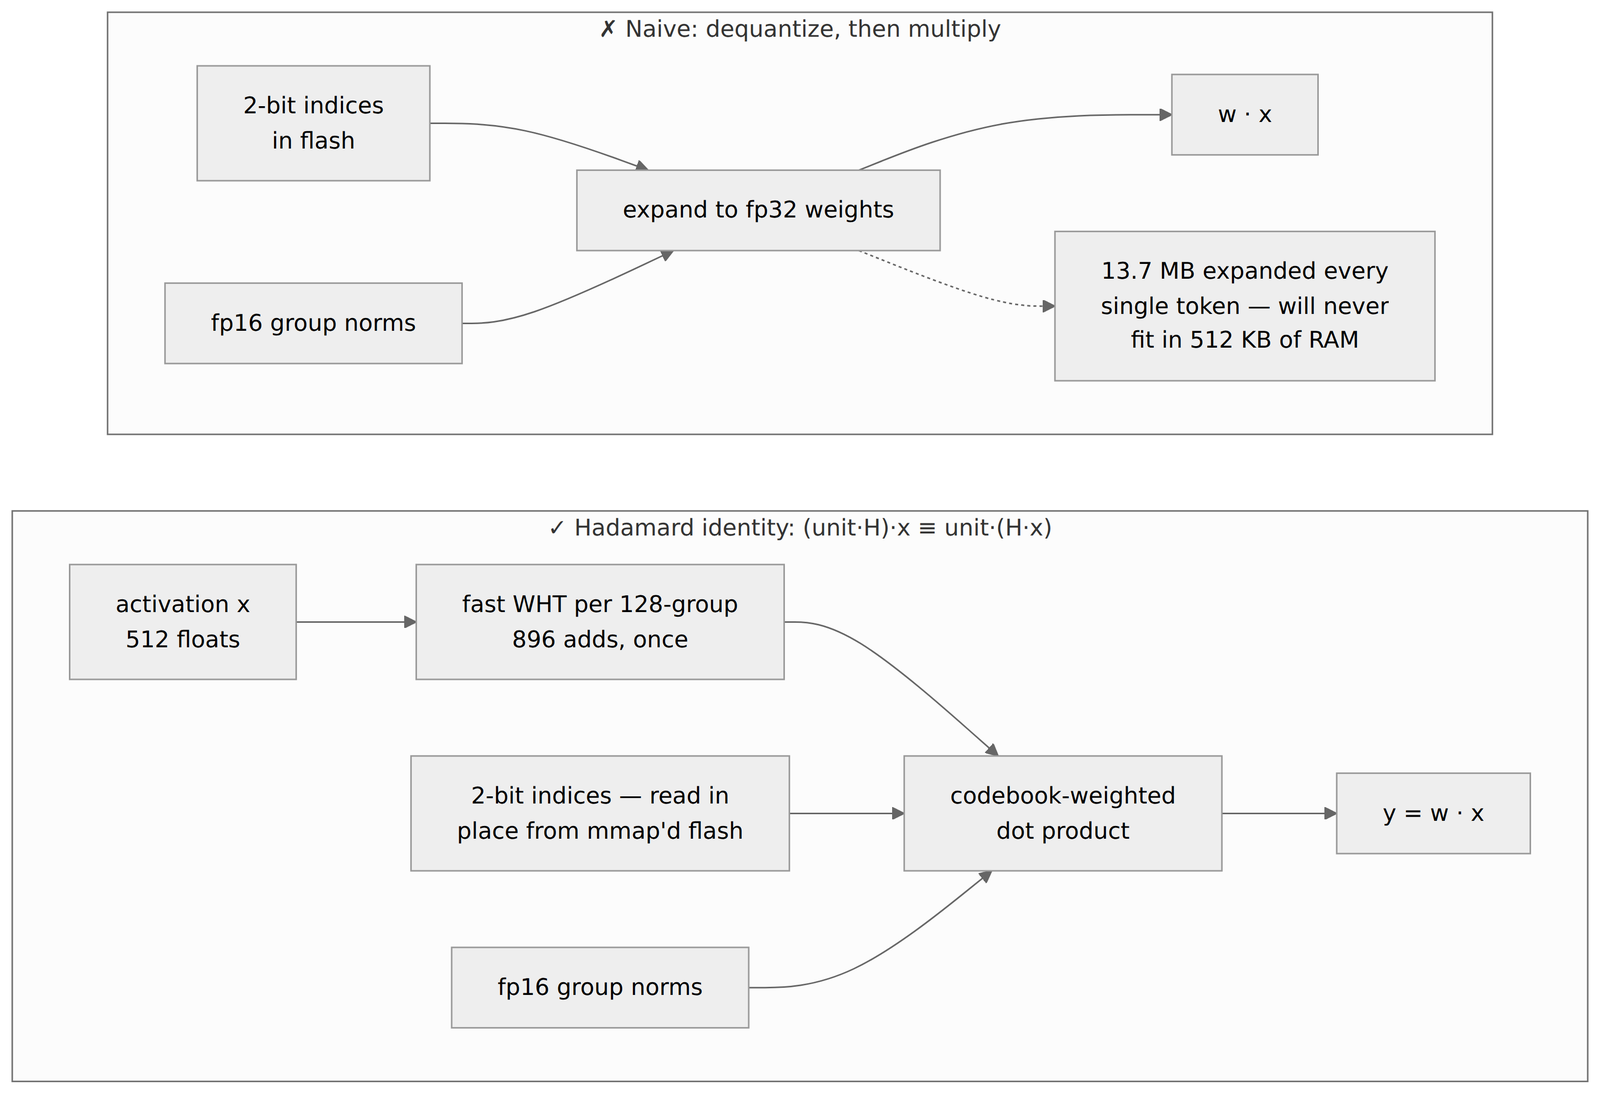
A CQ-quantized matrix stores 2-bit codebook indices plus one fp16 L2 norm per 128-element group. Reconstruction is w_group = (codebook[idx] * norm) @ H, where H is a normalized Walsh–Hadamard matrix.
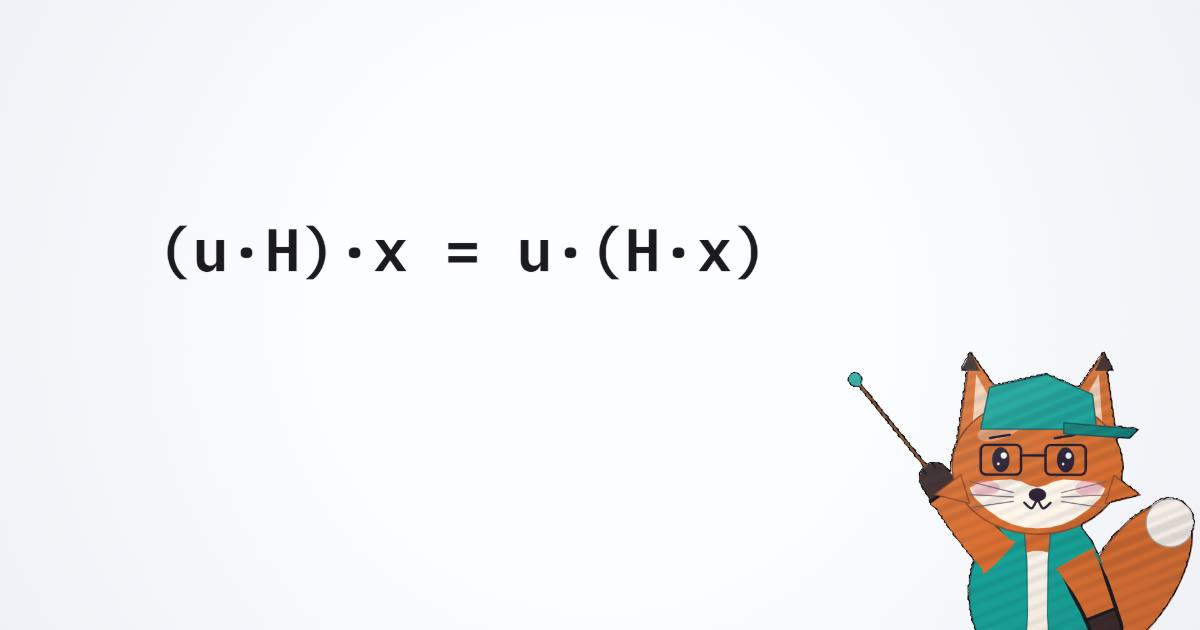
Doing that literally means expanding 13.7 MB of weights on every single token, which is not a thing this chip can do. But H is symmetric and orthogonal, so:
The transform can move off the weights and onto the activation. And the activation is shared by every output row.
That sharing is the whole game, and the interactive makes the shape of it visible: the saving is exactly the number of output rows, because a weight-side transform must be redone per row while an activation-side one is computed once. For the engine's 512×512 matvec that is 512×; for the 8192×512 logits head, 8192×.
The consequence is physical. Nothing is ever reconstructed, so the dot product reads the packed 2-bit bytes straight out of memory-mapped flash via esp_partition_mmap. The model is never loaded at all — startup is 48 ms — and "13.7 MB of weights" and "512 KB of RAM" stop being contradictory statements.
I checked the fast transform against the source. fwht() is a textbook in-place butterfly, and the README's "896 adds" is exactly — the cost of one 128-wide group.
Where every byte lives
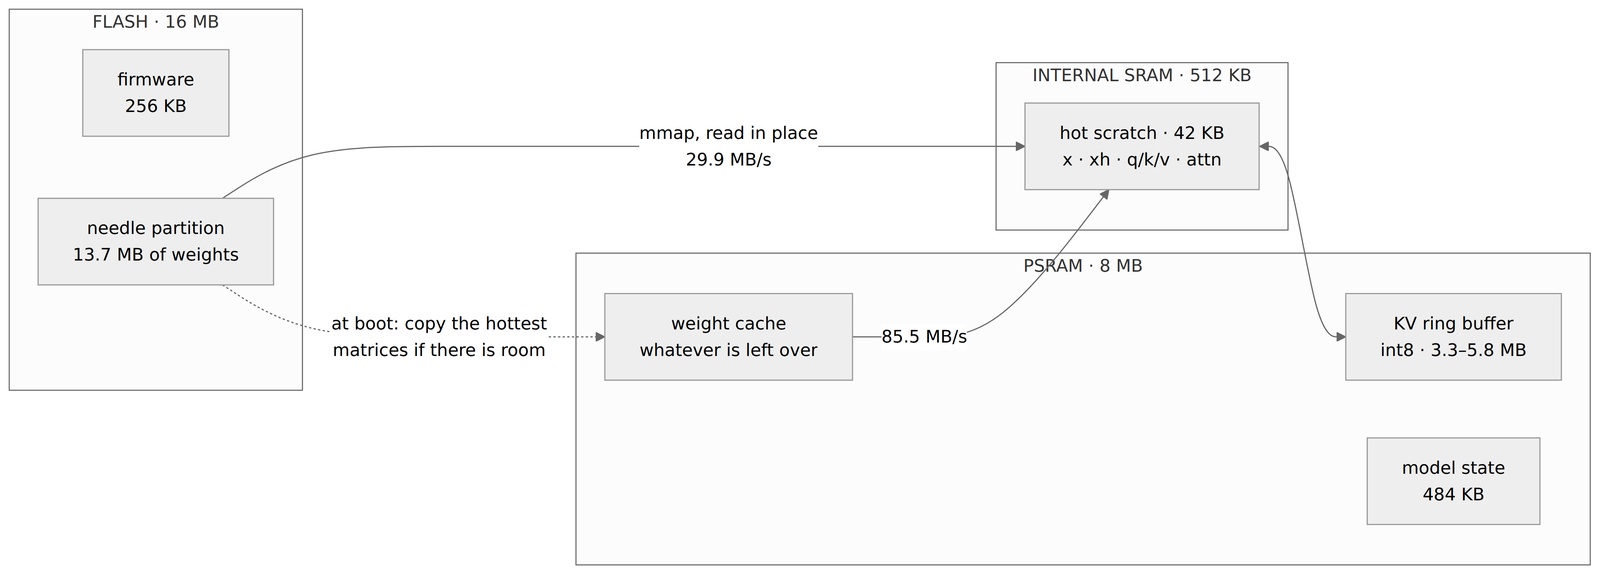
The number I would point at is 416. Needle attends over a 256-token recent window; the engine protects the first 160 prompt tokens as an attention sink beside it. 160 + 256 = 416 physical KV rows — exactly the allocation the previous pure-ring design used. The sink was not added by growing the budget. It was added by spending the same budget differently.
That matters because of what the old ring was throwing away, which brings us to the actual result.
The part that generalizes
Here is the fact the whole report rests on. The official Cactus dylib's embedded weights and this repository's needle2.cact are the same 13,737,807 bytes with the same SHA-256. Not equivalent, not re-exported — identical.
So when the engine scored 48.8% against the official engine's 69.2% on the same 961 rows with the same scorer, none of that 20.4-point gap could be the model. All of it was the code around the model. And rather than chase it with intuition, the repository closed it with paired ablations that name which decision bought which rows:
- Reasoning cap 90 → 256: +44 rows. The old loop gave the model 90 tokens of reasoning and then forced its JSON decoder open whether or not
<tool_call>had appeared. With the full prefix present, 139 of 961 rows had not opened the marker by token 90. At 256, 960 do. It costs nothing in the median case, because generation stops the moment the marker appears — this is a bug wearing a hyperparameter's clothes. - Protecting the prompt prefix: +63 rows. The sliding window was evicting the system instructions during decode. On one row both engines see the same 333 input token IDs — a 230-token prefix and a 103-token turn — and the old implementation discarded the first 77 at the end of prefill, including the date-bearing system instruction. The model was being asked about a date it could no longer see.
- One continuous byte grammar: +96 rows. The largest single win. The old path forced JSON fragments separately, decoded names through a trie, decoded each key/value in another loop, and used a hand-tuned logit margin to decide whether to append a call. Tokens that naturally cross JSON boundaries got split into a different token history — producing swapped contact fields and unstable call counts even with correct attention context. The new decoder validates every byte of every candidate token against one grammar compiled from the active schemas, and forces nothing.
469 + 44 + 63 + 96 − 3 = 669. The three subtracted rows are what the 160-token sink costs against an unbounded prefix, which would have needed up to 522 rows and about 1.56 MB more PSRAM. Every number in that sentence is in the report, and the sum lands on the published 69.6% exactly.
There is also a cross-check in the table that I want to single out, because it is the mark of someone being careful with their own conclusions: they ran the context fix without the reasoning fix, in isolation. It buys 47 rows. Applied after the reasoning fix, context buys 63. The two interventions are not the same intervention, and you cannot know that from a ladder that only ever runs in one order.
20.8 points of function-calling accuracy that lived in the decode loop. Not in the weights, not in the quantization, not in the architecture. In the reasoning budget, the attention sink, and whether you teacher-force JSON.
What is actually still broken
The honest reading of the headline is the one the repository itself gives: strict accuracy is now marginally above the official engine, and the two engines do not make the same mistakes.
Tool-name accuracy is 90.8% against 98.1%. There are 69 under-calls against 9. MimiModel wins more argument rows under this exact scorer, which is what tips strict accuracy over — but "slightly ahead on one metric while well behind on another" is not the same as better, and the report says so before anyone else can.
It then does the thing that makes the difference between a benchmark table and an investigation: it works out why the residual is what it is. The native BM25 retrieval retains every expected tool in 914 of 961 rows. Of the 137 baseline under-call rows, only 36 had a retrieval miss — 101 had full recall and under-called anyway. Handing both engines the same top-2 candidates moves the gap from 196 rows to 172, so retrieval explained about 24 rows, not the majority.
After the decoder fixes, the 69 remaining under-calls split 33 retrieval misses to 36 with full recall. The decoder work collapsed that second bucket from 101 to 36 — and in doing so made retrieval the dominant remaining cause. The official package documents a learned top-5 retrieval head. So the next point of name accuracy is a retrieval problem, and the report knows it is looking at a retrieval problem rather than reaching for another grammar tweak.
The optimization log, including the failures
Baseline scalar C did 0.64 tok/s prefill. The shipped default does 2.11. The route there is unremarkable in the good way — dual-core split, skip the logits head during prefill, byte-LUT decode with a quad-row kernel, hot scratch into SRAM, TIE728 vector loads.
The failures are the better half, and I wish more repositories published them.
The dense int16 PIE path is the one to remember. Hand-written Xtensa assembly, ee.vmulas.s16.accx doing eight multiply-accumulates per instruction, a full int16 activation path, verified numerically correct to a relative error of 5.5e-5. It runs at 0.32× the speed of the C it replaced — three times slower. The reason is that unpacking 2-bit weights into int16 lanes dominates the loop, and PIE has no 2-bit unpack instruction. The SIMD accelerated the half of the kernel that was never the bottleneck. Nothing about that is visible from the instruction set manual; you find it by building the thing and measuring.
Two smaller ones in the same spirit: int16 arithmetic on the host is 2.3× slower than float, because the compiler auto-vectorizes the float loops. And linear-space Sinkhorn is mathematically equivalent to the log-space version and underflows to NaN.
There is also a genuinely counterintuitive win. The KV prefix cache costs about 20% of raw throughput — it buys a larger ring at the expense of local speed — and wins 8.2× end to end anyway, because in a tool-calling agent the <tools> block is byte-identical on every call and is 288 of 300 prompt tokens. Optimizing throughput would have told you to remove it.
The split point is chosen with more care than it first appears: the cache splits at the </tools> marker, and because markers are atomic tokens, the prefix's tokenization is provably a prefix of the whole prompt's. That is the kind of detail that separates a cache that works from a cache that works until it silently doesn't.
Why I believe the numbers

The numpy reference was diffed per position and per logit against the official JAX decode loop — max difference 3e-4. The C was diffed against the numpy the same way. On device, the firmware self-tests its SIMD kernel against the scalar one at boot, with a reported max absolute error of 8.583e-06.
Two bugs were found only because that chain exists, and both are the kind that hide: the mHC a_pre/a_post/a_res tensors are per-layer scalars, which numpy's broadcasting silently accepted and C read out of bounds; and the engram taps use a per-channel (4, 512) layout that the original implementation read as four scalars.
What it does not establish
The repository's own limitations section is more candid than most, and it belongs in any summary of this project.
It is slow. The controlled one-tool workload takes 14.9 s warm and 32.8 s cold. Real mobile-actions rows take minutes — a 252-token row completed in 158 s, a 333-token two-call row in 414 s. On an M4 host this engine does 191/141 prefill/decode tok/s against the official engine's 1204/702. A cloud API is not in the same universe. What you get instead is a model that works with the network cable pulled out, at zero marginal cost, with the data never leaving the device.
It will not decline. Ask it to tell a joke and it emits a tool call. Any production use needs a confidence gate and a text pre-filter in front of it — and the confidence head, whose weights are present in the .cact file, is not implemented yet.
It does not speak Chinese. Chinese device commands score 0/5 — with identical failures in the official engine, which correctly places the limitation in the model rather than the engine.
And there is a lovely piece of applied honesty in the limitations: gpio_write(pin, state) gets state wrong about half the time, because boolean and semantic arguments are unreliable. Splitting it into gpio_on(pin) and gpio_off(pin) — matching what the model is actually good at, which is name selection and integer extraction — takes write accuracy from 1/5 to 5/6. The fix was not a better prompt. It was designing the tool surface around the model's real shape.
Two small things I would flag. The README says the engine is "~2,000 lines"; needle.c is 3,111 lines, about 2,689 excluding comments and blanks. And the device-level accuracy figures are parity checks — a handful of rows matching the host byte-for-byte — not an accuracy estimate on hardware; the repository says so, and the one sampled run it does report (5/12 strict, 95% Wilson interval 19.3–68.0%) is correctly labelled as not a population estimate.
The thing worth taking away
The engineering that gets a language model onto a $5 chip is delightful, and it is also the part that generalizes least — most people are not writing Xtensa kernels.
What generalizes is the middle section. Identical weights. Same benchmark, same scorer, same 961 rows. A 20.4-point gap that was entirely attributable to a reasoning cutoff, an attention window, and a JSON decoding strategy — each measured in isolation, each in both orders, each accounted for down to the row.
Every one of those three is a decision someone makes in an afternoon and never revisits. If you run a model in production behind a harness you wrote, that section is a list of the places your own 20 points might be hiding.
Related on this site: Kimi K3 in C does the single-file thing at the opposite end of the scale, and how LLM inference works covers the prefill/decode split this engine spends its whole optimization log on.