2026-10-16 · 24 min · calibration · benchmarks · multimodal · liquid-ai
A 1:44 narrated explainer, drawn in code. Every number and picture in it is this article's own; the sources are below.
› transcript
Hi, I'm Kelvin! Liquid's new decision model says that when it is ninety percent sure, it is right. Let's see what that number is, and where it holds. A decision model scores every option and returns probabilities. If they are calibrated, a threshold can decide what runs without a person. The state and a question go in. Each question is its own prompt, and it is billed as one. One scoring pass reads a score for every option. A softmax turns them into probabilities. Nothing is generated. Take the probability of the chosen option and compare it with a threshold. Above it, the decision runs on its own. Below it, a person looks. Calibration has a number. Sort answers into bins by confidence. In each bin, compare how often it was right with how sure it said it was. Weight each gap by the share of answers in that bin, and add them up. Pool four benchmarks into one curve, and errors that point in opposite directions cancel. Split them, and d1-ultra is cautious on tool calls and safety, and sure of itself on exam questions it gets wrong. On the pooled curve, d1-ultra's error is three point six, a third of the next model's. Per benchmark, it ranks fourth. Its index score recomputes to sixty five point two five. Most of the lead comes from saying I don't know when it does not. A threshold is only as good as the calibration on your own task. Measure it per task, never pooled. Score the options, trust a threshold only where it is calibrated, and never pool. Every source is in the full article. I'm Kelvin. Bye!
Why read this
Notabletop 60%Recomputes d1-ultra's index score and calibration from AA's own bins: the pooled curve hides opposite errors per benchmark, HLE included.
- Original analysis
- Widely used
- A lasting reference
LLM architectureAPI onlyProprietaryPractitioner model
How this was scored
- Is it new?
- 1 of 3: An incremental tweak
- Can I trust it?
- 2 of 3: Measures key facts from files, code or configs
- Can I run it?
- 1 of 3: API-only, gated or restrictive licence
- Will I understand it?
- 2 of 3: Mechanism from first principles with figures
- Can I act on it?
- 2 of 3: A concrete recipe, numbers or comparison
- Will it last?
- 2 of 3: A reference for a year or more
- Does it affect many?
- 2 of 3: A widely used model, tool or lab release
- Only here?
- 2 of 3: A teardown or measurement few others did
Score 63 of 100, ranked 262 of 577 rated articles. Each question is answered 0–3 by hand, and a 3 is rare. How articles are scored
Nine days after Open d1, Liquid AI shipped the other end of the family. d1-ultra is hosted only. The launch thread makes four claims I can do something with: it is "#1 on the @ArtificialAnlys Decision Index (65)", it "leads all eight categories of our 112-evaluation suite", "when d1-ultra says 90%, it's right at least 90% of the time", and it costs "$0.042 / 1M input tokens" with "no output tokens".
There are no weights to read this time: the ten d1 repositories under LiquidAI on Hugging Face are all d1-3B and d1-omni-600M, and the replies under the post are mostly people asking whether it will be open. What I could read is Artificial Analysis's index page. Its page data carries every model's sub-scores, cost, latency and calibration bins, per benchmark. Everything below that says measured is my arithmetic on that file. Everything Liquid says about its own suite is reported, because nothing of that suite is public.
The short version: the 65 is real and independently run. The calibration claim survives on the chart AA draws, but that chart pools four benchmarks, and the pooling hides most of what is interesting about d1-ultra's confidence.
What a decision model returns, and why there are no output tokens
A decision model takes a state (text, images, or both) and typed questions about it, and returns a probability for every allowed answer. The blog puts it in one line: it "reads this input in one forward pass and returns the probabilities, without generating any tokens." The question types are the three this site has taken apart before: noul (yes or no, returns P(yes)), choice (one label of several) and score (a position on an ordered scale).
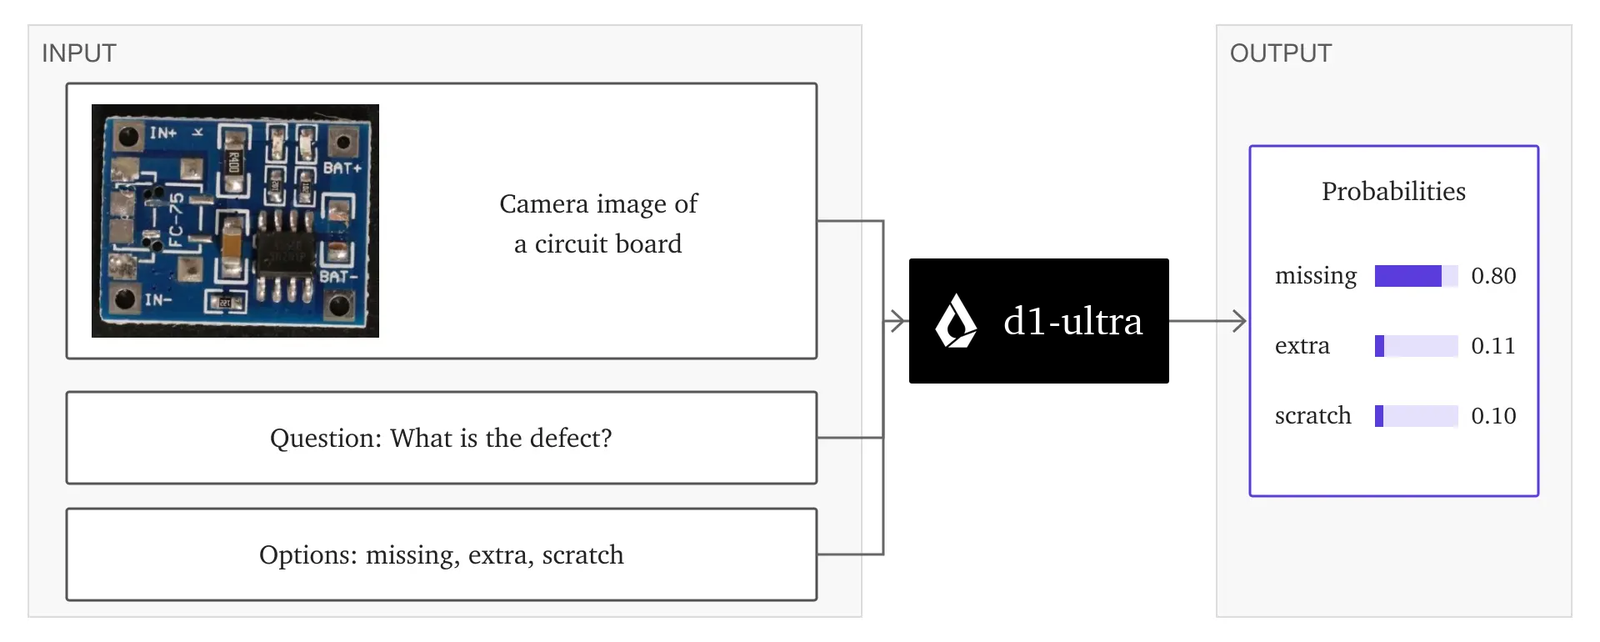
"No output tokens" is not a pricing trick. It falls out of how the number is read. In the llama.cpp piece I built /v1/systemone and traced it: a letter-readout model reads the vocabulary logits at the last prompt position, only at the rows of its option codes, and softmaxes them; a head model reads one hidden state per option marker. Either way the forward pass over the prompt ends in a score per option, and nothing is sampled. Open d1 showed both inside Liquid's own family. d1-3B answers through the LM head it inherited from LFM2.5-VL-3B, at the option letters. d1-omni-600M grew a 26M-parameter head that scores one mask marker per option. An LLM generating {"defect": "missing"} pays for prefill and then for every decoded token. A decision model pays for prefill only. Prefill is what input pricing has always charged for.
The llama.cpp piece also measured the catch in "one forward pass": it is one pass per prompt, and each question is its own prompt. d1-ultra's billing says so: "Each question is billed as its own prompt, including its text and all images." So five questions about a 2,000-token ticket bill about 10,000 tokens of state, plus the questions (reasoned). Whether Liquid's servers share the state across questions the way d1-3B's tree does, I cannot tell from outside. The bill does not share it.
What sits inside d1-ultra is not disclosed. The blog says only that "we based d1-ultra on a larger open-weight model with a series of Liquid-specific heavy customizations"; the docs call it "built on a larger open-weight model". No parameter count, no base model, no context length. A reply's guess of LFM2.5-24B-A2B is unconfirmed. It takes text and images, not audio.
Calibration, from the definition
A model is calibrated when, of all the answers it gives with confidence near , a fraction is right. Take every decision, look at the probability it put on the option it chose, and whether that option was correct, . Sort the decisions into bins by ; ten bins of width 0.1 is the convention. For bin :
A reliability diagram plots against per bin. Perfect calibration is the diagonal. Below it, the model is overconfident: it says 90% and is right 80% of the time. Above it, underconfident. The expected calibration error is the gap averaged over bins, weighted by how many decisions fall in each:
Two properties of ECE matter later. It is unsigned, so an underconfident bin and an overconfident bin cost the same, although they do very different things to you in production. And it is computed after binning, so if you pool two datasets whose errors point in opposite directions in the same bin, the errors cancel before the absolute value is taken. Liquid's chart labels its metric "mean |confidence − accuracy|" and does not say how bins are weighted.
Why calibration is what makes a threshold work
The thread's pitch is the right one: "set a threshold, automate everything above it, and send the rest to a person." Here is why that needs calibration and not accuracy. Automate every decision with . If the model is calibrated, the error rate of the automated slice is one minus the mean confidence inside it, which is at most . You can pick from a spreadsheet: "I can live with 2% errors unreviewed, so automate above 0.98." If the model is overconfident, the automated slice is wrong more often than its numbers say, and the threshold you picked on paper ships errors you did not budget for. If it is underconfident, the slice is safer than promised, but you route work to people that the model would have got right.
The widget below is illustrative. It is 4,000 synthetic decisions with the same underlying accuracy (82.6%), whose reported confidence is bent by one knob on the logit scale. At a 0.9 threshold, an honest model automates 47.8% of decisions with a 2.98% error rate in that slice, against 2.92% its confidences imply. Bend it overconfident (k = 2) and it automates 68.9% with 6.93% errors while its confidences imply 1.47%: nearly five times the errors it claims. Bend it underconfident (k = 0.6) and it automates 27.9% with 0.81% errors: safe, and it sends 72% of the work to people. The ECE is about the same for the two bent models, 6.72% and 6.95%. The consequences are opposite.
So "right at least 90% of the time" is a claim about direction, not just size: the error is on the safe side. That is the part worth checking.
What Liquid publishes
Liquid publishes one calibration chart and one table. The chart is a gap plot: accuracy minus confidence, per bin of confidence on the chosen option, with a calibration error per model on the right.
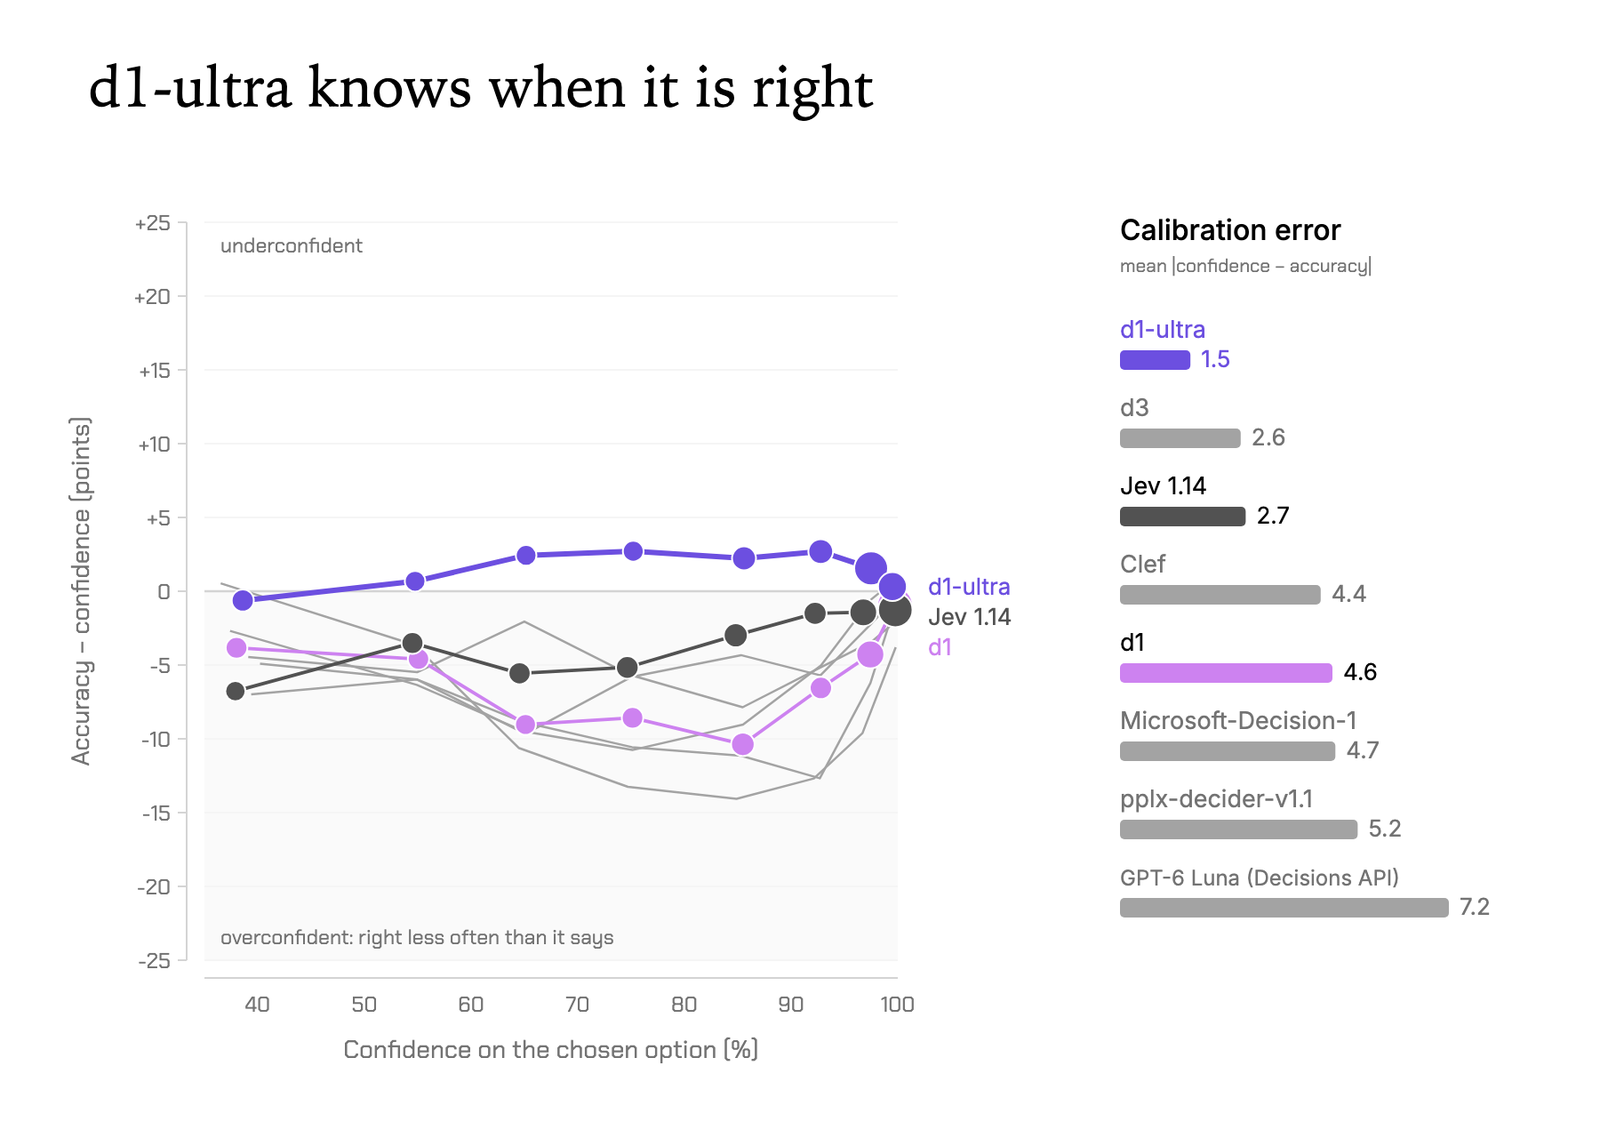
Read literally, the chart supports the strong form on Liquid's data: d1-ultra's line sits at or above zero from the 55% bin to the top, so in those bins it is right at least as often as it says (reported). Every other line sits below zero almost everywhere. The calibration errors on the right are 1.5 for d1-ultra against 2.6 for d3 and 2.7 for Jev 1.14 (reported).
What the chart does not tell you: which of the 112 evaluations feed it, how many answers sit in each bin, whether "mean |confidence − accuracy|" is weighted by bin size, and whether the answers are pooled across tasks. That last one turns out to matter.
The 112-evaluation suite is in the same state. The blog says "we compared it to our previous model d1 and Jev 1.14 across 112 unique evaluations"; the thread groups them into eight categories. No evaluation is named, no data or harness is published, and no per-evaluation score is given.
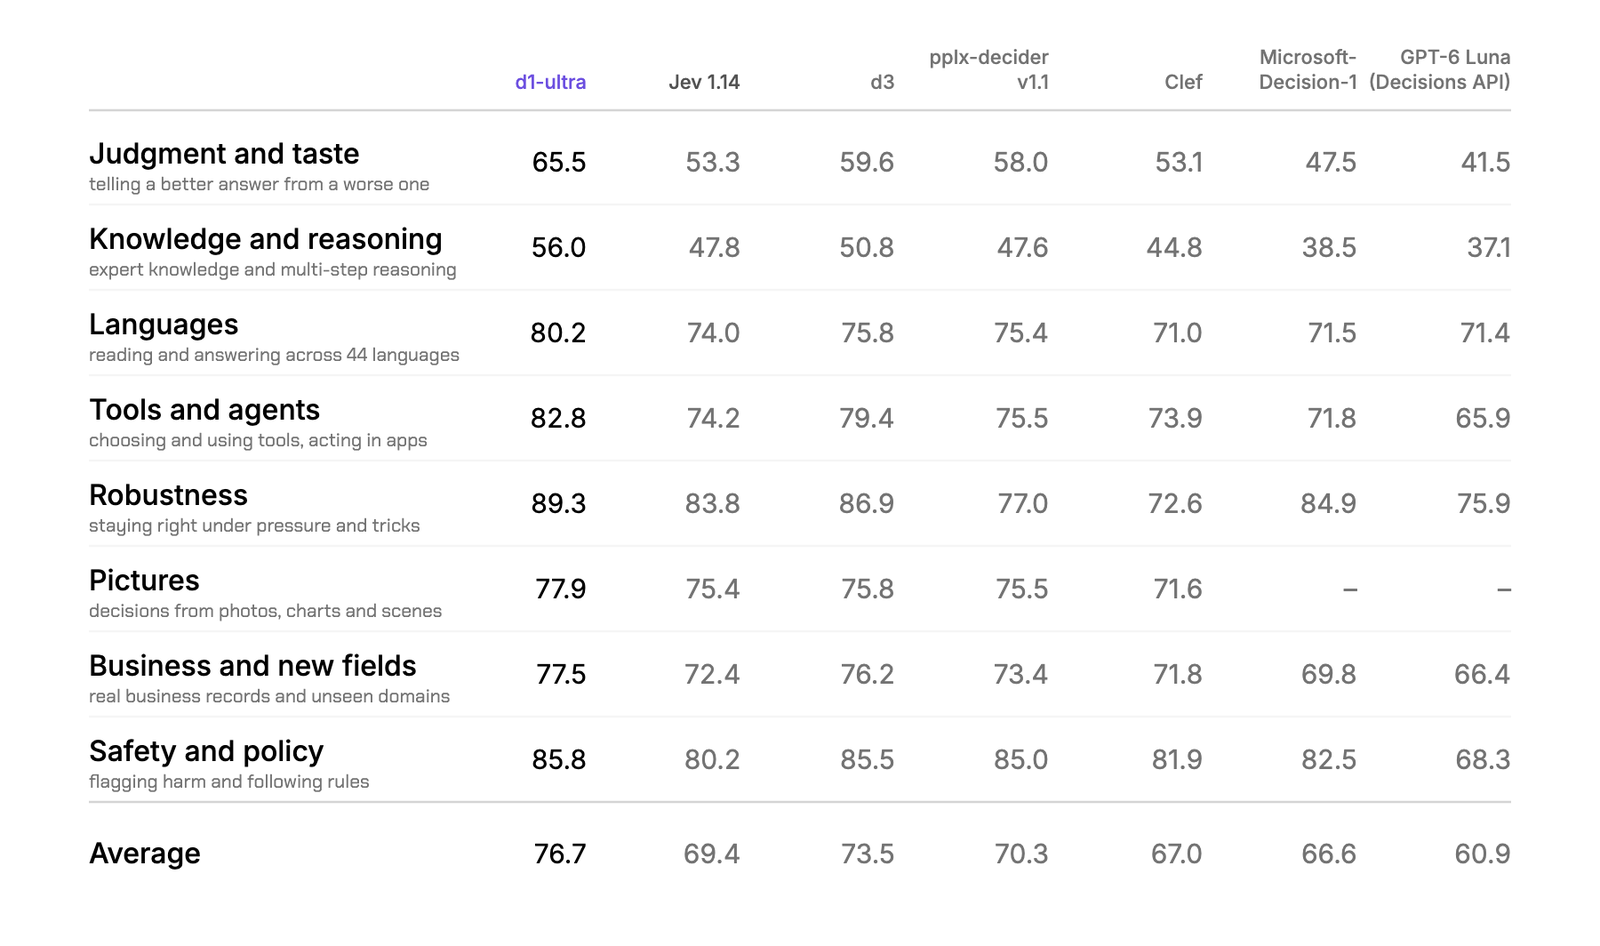
I can check the table's arithmetic. The "Average" row is not the mean of the eight categories: d1-ultra's eight average 76.9, not 76.7. It is the mean of the seven categories other than Pictures: 537.1 / 7 = 76.73 for d1-ultra, 69.39 for Jev 1.14, 73.46 for d3, and the same rule reproduces every column, including the two models with no Pictures score (measured, from the table's own cells). That is a fair choice, since two models cannot take images, but it is not written down. The leads are real on the table's terms and some are thin: 0.3 points over d3 on Safety and policy, 1.3 on Business and new fields, against 11.9 over Jev 1.14 on Judgment and taste (reasoned). With no per-evaluation counts and no error bars, a 0.3-point lead in a category average is not a result I would lean on. "d3", the best of the others in every row, appears nowhere else in Liquid's material and is not on AA's board, so I cannot say what it is.
The 65, recomputed
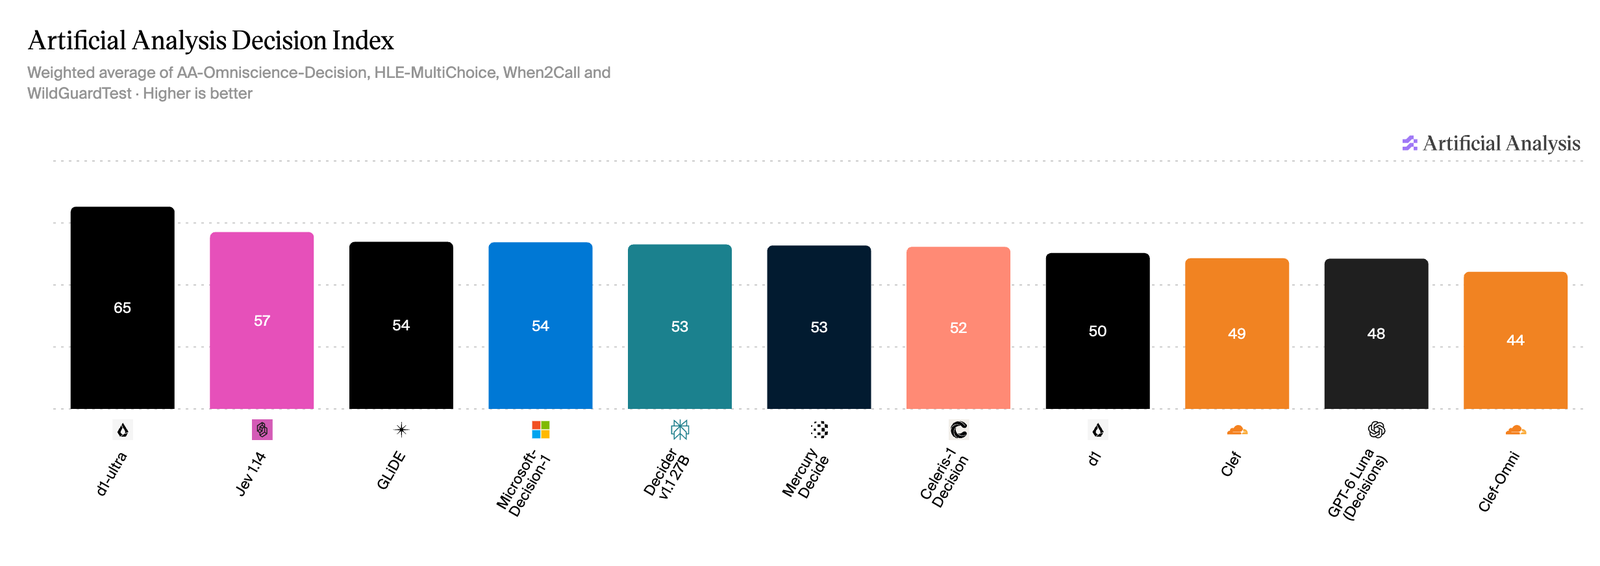
The Artificial Analysis Decision Index is not the community board Open d1 was ranked on. That one was a Hugging Face Space where d1-3B's score was Liquid's own run. This one is version 1.0, launched in October 2026, and AA's methodology says "all evaluations are conducted independently by Artificial Analysis." It is four text-only evaluations at 25% each:
| evaluation | what it is | metric |
|---|---|---|
| AA-Omniscience-Decision | 500 private questions, four answers plus "I don't know" | accuracy 12.5%, non-hallucination rate 12.5% |
| HLE-MultiChoice | the 513 text-only multiple-choice questions of Humanity's Last Exam | accuracy |
| When2Call | 3,423 of NVIDIA's 3,652 tool-use tasks: answer, call a tool, ask, or decline | accuracy |
| WildGuardTest | 835 rows, up to three yes/no safety questions each | mean F1 |
Non-hallucination rate is 100 × (1 − the share of not-correct answers that were wrong rather than "I don't know"). Nothing in it uses an image, so d1-ultra's multimodality is not part of the 65.
d1-ultra's sub-scores in the page data are 31.6, 84.50, 15.01, 92.58 and 95.35. Weighted 12.5 / 12.5 / 25 / 25 / 25, they give 65.248, which is the indexScore the page stores, 65.25 (measured). On the default view, which shows 11 decision models, it is first, and the next is Jev 1.14 at 57.07: a gap of 8.17 (measured), which is the blog's "at least 8 points". The page data also holds Jev 1.13 at 57.50, outside the default view, and against it the gap is 7.74 (measured), so "at least 8" holds for the rounded bars and not quite for the stored scores. Tick "Include language models" and five LLM configurations score higher: Claude Opus 5.5 at max effort scores 79.01, and Claude Haiku 5.5 at max effort scores 68.36 (reported, AA's runs). "#1" means first among decision models.
Where the 8.17 points over Jev 1.14 come from is the interesting part. Splitting the index by component (measured):
| component | weight | d1-ultra | Jev 1.14 | contribution |
|---|---|---|---|---|
| Omniscience accuracy | 12.5% | 31.6 | 33.8 | −0.28 |
| Omniscience non-hallucination | 12.5% | 84.50 | 37.16 | +5.92 |
| HLE-MultiChoice | 25% | 15.01 | 18.91 | −0.97 |
| When2Call | 25% | 92.58 | 80.84 | +2.93 |
| WildGuardTest | 25% | 95.35 | 93.07 | +0.57 |
Nearly three quarters of the lead is the non-hallucination rate. On the two components that measure knowing things, d1-ultra is behind Jev 1.14. The calibration bins show how. Omniscience's bins only hold answers that were not "I don't know", and d1-ultra has 211 binned answers of 500 against Jev's 377. With accuracy 31.6%, that is 158 right, 53 wrong and 289 "I don't know", 58% of the questions; Jev answers 169 right, 208 wrong and 123 "I don't know" (measured, from the bin counts and the scores). d1, its predecessor, scores a non-hallucination rate of 1.69: it almost never declined. So between d1 and d1-ultra, Liquid taught the model to pick "I don't know" when it does not know. That is a calibration behaviour, and the index rewards it with 12.5% of its weight. It is a legitimate thing to reward. It is not the "biggest gains are in tasks requiring expertise" story of the thread, at least not on this board.
Calibration on data I can see
AA's page plots a calibration curve too, from bins it publishes: for every model and every benchmark, the answer count, mean confidence and accuracy in each 0.1-wide bin. Its pooled curve gives each benchmark equal weight. I checked how: weighting each answer by one over its benchmark's answer count reproduces the page's pooled accuracy and confidence in every bin, to the last digit (measured).
On that pooled curve, the claim holds. d1-ultra's pooled ECE is 3.6 points; the next decision model, Jev 1.14, is 10.6, and the worst, Mercury Decide, 22.4 (all measured). d1-ultra's top bin, 4,418 answers at a mean confidence of 96.9%, is right 97.1% of the time. On AA's data, as AA draws it, d1-ultra has the lowest calibration error of the 13 decision models by a factor of three.
Now split it by benchmark (all measured, ECE in points, each benchmark's own answers):
| Omniscience | HLE | When2Call | WildGuardTest | mean of four | pooled | |
|---|---|---|---|---|---|---|
| d1-ultra | 15.2 | 34.6 | 4.6 | 2.5 | 14.2 | 3.6 |
| Jev 1.14 | 6.1 | 37.1 | 5.5 | 5.4 | 13.5 | 10.6 |
| GLiDE | 9.7 | 38.1 | 1.2 | 1.2 | 12.6 | 11.7 |
Averaged per benchmark, d1-ultra ranks fourth of 13, behind GLiDE (12.6), Jev 1.14 (13.5) and Celeris-1 Decision (14.1). The pooled number is three times better than any rival and the per-benchmark number is not, because d1-ultra's errors point in different directions on different benchmarks:
- Underconfident on three. On When2Call, answers it gives 86% confidence are right 93% of the time; on WildGuardTest, 86% becomes 94%; on Omniscience, 75% becomes 91% (measured, bin by bin). Most of Omniscience's 15.2 is this safe-side gap, measured on 211 answers.
- Badly overconfident on one. On HLE-MultiChoice, the 21 answers it gives 96% are right 5% of the time; the 30 at 86% are right 10% (measured). These are questions far past what the model knows, and it does not know that it does not know.
Pool them, and HLE's overconfidence lands in the same bins as When2Call's underconfidence, and the gaps cancel before ECE takes the absolute value. The pooled curve is not wrong; it is answering a different question, about a mixture that no deployment will ever see.
Two fair points in d1-ultra's favour. First, no decision model is calibrated on HLE: Jev 1.14 puts 94% on 52 answers that are right 2% of the time, and every model's HLE error is 34.6 points or worse (measured). Questions that far out of distribution break all of them. Second, the direction on the three benchmarks d1-ultra can actually do is the safe one. Read per benchmark, "when it says 90%, it's right at least 90% of the time" holds on When2Call, WildGuardTest and Omniscience in every bin above 0.8, and fails completely on HLE (measured). That is a better record than "lowest calibration error" suggests, and a worse one than "at least" without a qualifier.
For the threshold, that means: on tool routing or safety flags, a threshold set on paper automates less than it could and ships fewer errors than promised. On a task the model cannot do, the same threshold automates confident nonsense, and nothing in the probability tells you which case you are in.
The price, in context
d1-ultra lists at $0.042 per million input tokens, output $0.00, against $0.02 for d1 on Liquid's pricing page (reported). Jev also lists at $0.042 per million input tokens, which is the blog's "at the same price".
The index page gives cost per task from AA's own runs. d1-ultra's is $0.0000318, so $31.80 per million tasks; Jev 1.14's is $41.53 and d1's $15.14 (reported). At $0.042 per million tokens, d1-ultra's figure is 757 input tokens per task on average, and Jev's, at the same list price, about 989 (reasoned). So per task d1-ultra is about a quarter cheaper than Jev on this suite; the difference is how many tokens each tokenizer and template makes of the same task, not the rate. Median time per task is 93 ms for d1-ultra against 78 ms for Jev 1.14 and 63 ms for Celeris-1 Decision (reported), so it is not the fastest.
Some typical requests, all reasoned from the published rates:
- A 300-token support message with one routing question of about 50 tokens: 350 tokens, $0.0000147, so about $14.70 per million messages.
- The same message with five questions: five prompts, about 1,750 tokens, $0.0000735. Questions multiply the state.
- One 1024×1024 photo: "1.5 tokens per 32×32-pixel patch, so a 1024×1024 image costs 1,536 tokens" (the blog). Ten questions about it bill 15,360 image tokens, $0.000645, before any text. A reply under the post made the same point.
For scale against LLMs on the same tasks, AA's cost per task is $0.000184 for Claude Haiku 5.5 at low effort and $0.0513 for Claude Opus 5.5 at max effort (reported), about 6 and 1,600 times d1-ultra's (reasoned). Those models score higher on the index. They also take 1.4 and 3.6 seconds per task, where d1-ultra takes 93 ms (reported).
What is not disclosed
No parameter count or base model, no weights, no list of the 112 evaluations or the 44 languages, and no calibration method beyond "we specifically trained d1-ultra to produce more reliable probabilities": no loss, no temperature, no held-out set. RLCD was the same story for Jev. OpenRouter and Vercel are listed as "coming soon".
What I would do with it
If your decisions look like When2Call or WildGuardTest (pick an action, flag a policy breach, route a ticket), d1-ultra is the best-scoring decision model on the only independent board, and on AA's data its probabilities lean safe on exactly those kinds of task. I would still fit the threshold on a few hundred labelled examples of my own, and compute ECE per task type, never pooled. A pooled ECE across your routing, moderation and extraction questions can look excellent while one of them is confidently wrong.
If your decisions need knowledge, the picture is different. d1-ultra's Omniscience accuracy is 31.6% and its HLE accuracy 15.0%; what it does well there is decline. Give it an "I don't know" option and treat that answer as a route to a person. That is the behaviour the index rewarded, and it is the most useful thing a calibrated decision model can do.
If you need weights, Open d1 has the two Liquid checkpoints, built on LFM2.5-VL-3B and an encoder, and GLiNER2 Decide is an encoder you can read to the head. pplx-decider v1.1 and Clef-Omni and Microsoft-Decision-1 cover two of the rivals on this board, and what decision models cannot do is the general case of HLE's lesson.
22 October: RIPL
On 22 October Liquid announced RIPL, "real-time inference pipeline", which the post calls "our ultra low-latency inference engine". It is a serving engine, not a paper, not a training method, and not where d1-ultra's calibration comes from. I found no arXiv paper, no code and no RIPL page in Liquid's docs. The blog post cites itself as a blog article, and the engine is "available today for enterprise deployments" on request. It touches this article at one line of the thread: "RIPL supports d1, our decision models too!"
What it is for. Putting a model inside a request with a hard budget: ad query rewriting, search intent, reranking, fraud scoring, credit decisions, alt text. Two of the six use cases are prefill only, 128 tokens in and one label token out, and 1,000 in and one out. That is the shape of a decision model, which reads the prompt and returns scores without decoding anything. The thread says so under the intent case: d1 models "could be used for similar applications".
How it works is not disclosed. The blog says RIPL "optimizes the full path from request arrival to a complete generated response", and nothing about kernels, batching, scheduling or precision. What it does disclose is the measurement: p95 end-to-end latency under open-loop Poisson arrivals, which counts the time a request waits in the queue. That is why load matters. If requests arrive at rate and the engine serves one at a time in time , utilisation is , and with Poisson arrivals and a fixed service time the mean wait in the queue is the Pollaczek–Khinchine result:
Take LFM2.5-2.6B on a B200 with 1,024 tokens in and one out. Its unloaded p50 in Liquid's calculator is 6.13 ms. Served one at a time, 100 requests a second is and adds about 4.9 ms of mean queueing; 150 a second is and adds 35 ms; 200 a second is above 1, and the queue grows without bound (reasoned). The calculator reports a p95 of 88.85 ms at 200 a second, so RIPL must batch prefills (reasoned). The same formula explains "its performance advantage is greatest on the slowest requests": an engine with a shorter effective sits further from the knee at the same , and near the other engine's knee the ratio between them is unbounded. A speedup quoted at high load mostly says where the slower engine saturates.
The numbers, checked (reported: Liquid's runs on one B200; every ratio is my arithmetic on the values in the blog's page data). The blog's Figure 2 table reproduces the thread: Qwen3.5-0.8B on vLLM at 497.95 ms p95 against LFM2.5-1.2B on RIPL at 34.56 (14.4×, 32 in and 32 out at 1,000 requests a second), and 4,430.88 against 155.76 (28.4×, 256 in and 128 out at 400). The headline changes model and engine at once, and it picks the slowest rival. Against MiniCPM5-1B in the same table the ratios are 4.7× and 3.9×. In the 2B class, Granite 4.2 3B and MiniCPM5-2B give 3.2× and 3.3×, where Qwen3.5-2B gives 7.7× and 5.6×.
The use-case data separates the two, because each case also carries the same LFM on vLLM. The engine alone, at 500 requests a second: 7.0× on ad rewriting (24.1 against 169.7 ms), 6.8× on intent (2.5 against 16.9), 3.4× on reranking (6.8 against 22.8), 3.6× on fraud scoring (43.8 against 156.1). At 10 requests a second the same four are 1.7×, 3.7×, 2.8× and 1.5×. So the engine's gain does grow with load, as claimed, and at its largest it is about a third of "up to 20x" (reasoned). Credit decisioning, 8,000 tokens in, goes the other way: at 100 requests a second RIPL's p95 is 798.2 ms against vLLM's 563.7. "Sub 50ms" holds for the short shapes. "Below 8ms up to 500 requests/s" for reranking holds: 6.8 ms at 500, 8.0 at 600.
What it means for d1-ultra: not much yet. No d1 model appears in any RIPL number. The calculator's four models per GPU are all generative LFM2.5 (230M, 350M, 1.2B, 2.6B); the largest is smaller than d1-3B, and d1-ultra is an undisclosed "larger open-weight model". The nearest proxy is the 2.6B prefill-only shape above: p95 6.65 ms at 10 requests a second, 18.15 at 100 and 88.85 at 200 (reported). Each d1 question is billed as its own prompt, and the open d1 models run it that way, so five questions about a ticket are five requests and 100 requests a second is 20 tickets (reasoned). Nothing says d1-ultra's hosted API runs on RIPL, and AA's 93 ms median per task includes the network. One related change: Liquid's decision-model docs now list d1 and d1-ultra on OpenRouter and Vercel AI Gateway, but OpenRouter's public model list had no d1 entry on 23 October (measured).
What is new is the measurement discipline: open-loop arrivals, p95 and p99, end to end, and a same-model baseline in the data, which is better than most serving launches. The engine itself is closed and undescribed, and the headline multiple is not the engine's.
How I checked
Sources read on 16 October 2026: the launch thread and its replies through the fxtwitter mirror; the blog post and its images; Liquid's decision-model docs, its decision-model guide and its pricing page; the d1 Playground shell page; the Hugging Face model list for LiquidAI; and Artificial Analysis's index page and methodology.
The index page ships its data in the page itself: 28 entries, 13 of them decision models, each with sub-scores, indexScore, costPerTaskUsd, timePerTaskMs and calibrationBins, overall and per benchmark. I extracted it, recomputed every index score from the sub-scores and AA's weights, reconstructed the pooled bins from the per-benchmark ones (every bin matches), and computed ECE both ways in a short Python script. The bins for four models are committed with the second widget. The "I don't know" counts follow from Omniscience's 500 questions, its accuracy and its binned answer count; that the bins exclude "I don't know" is my inference, and it agrees with the non-hallucination rate for both models I checked.
I did not call the API; I have no key. Liquid's suite, its calibration chart, the price and the image token rate are Liquid's figures; every index score, cost and latency is AA's run. The first widget is synthetic.
For the 22 October section, read on 23 October: the RIPL thread (ten posts) and its first page of replies through the fxtwitter mirror, the blog post and the calculator page. The blog's figures are interactive embeds, not images, so there is no figure to copy; their data ships as three JSON blocks in the page (comparison-data, the use cases, calculator-data), which I extracted and from which I recomputed every ratio above. The calculator's rows are [requests/s, p50, p95, p99, saturated], as its own script reads them. An arXiv search for "RIPL" and Liquid's docs index turned up nothing on the engine, and the OpenRouter check is its public /api/v1/models list. Every latency is Liquid's run; I ran nothing on a GPU, and the queueing arithmetic is textbook, not a model of RIPL.