Z1T: sparse transformers for a chip that samples, not multiplies — and what 100x actually measures
mdjsonmcp2026-09-08 · 19 min · hardware · scaling-laws · performance
A 1:52 narrated explainer, drawn in code. Every number and picture in it is this article's own; the sources are below.
› transcript
Hi, I'm Wombat! The Z1 chip doesn't multiply matrices. It computes by sampling. Here's how Z1T fits a transformer onto it. Z1 computes by sampling, not multiplying. Z1T keeps a transformer's block shape and rebuilds every primitive inside it around 16 fixed neighbours per bit. Z1 is a fabric of pbits: random bits, each wired to sixteen fixed neighbours. Weight the neighbours' states by their couplings. The average is a tanh: the nonlinearity a network wants, sampled, not computed. One draw is one bit, so reading out a number means averaging many draws. A standard block assumes dense reach: a norm, dense feed-forward layers, softmax attention. Z1T swaps the norm for a tanh, the feed-forward for sparse tanh-linear units, and attention for a gated convolution with no softmax. Z1 can't do embeddings or positions efficiently, so those run on an FPGA on the same board. The sparse tanh-linear layers and attention gates run on Z1, as sampling. Residual adds go back to the FPGA, block after block. The FPGA also projects to logits. In this first version, it spends over ninety-five percent of the energy. The over a hundred times claim is one row: an H100 at ten percent utilization. At fifty and a hundred percent, it's twenty-eight and fourteen. All projected. Z1T keeps a transformer's shape and rebuilds its layers so sixteen fixed wires can sample them; the FPGA does the rest. To recap: a sampling chip, a transformer rebuilt to fit it, and an FPGA for the rest. Every source is in the full article. I'm Wombat. Bye!
Why read this
Notabletop 60%Reads Extropic's full energy table: "over 100x" is the 10%-MFU row only, both sides are projections, and the omitted logit layer is 463x the total.
- Checked against the source
- A new technique
- Explained from first principles
GPUs, kernels & systemsNothing to runResearch paper
How this was scored
- Is it new?
- 2 of 3: A real new idea, method or capability
- Can I trust it?
- 3 of 3: Reproduces the headline result, or shows from primary files it is wrong
- Can I run it?
- 1 of 3: API-only, gated or restrictive licence
- Will I understand it?
- 2 of 3: Mechanism from first principles with figures
- Can I act on it?
- 1 of 3: General advice
- Will it last?
- 1 of 3: Relevant for months
- Does it affect many?
- 1 of 3: A specialist community
- Only here?
- 2 of 3: A teardown or measurement few others did
Score 61 of 100, ranked 311 of 577 rated articles. Each question is answered 0–3 by hand, and a 3 is rare. How articles are scored
Z1T is Extropic's first attempt at running transformer-like models on Z1, the sparse probabilistic chip the company launched earlier this year. The post's own lede claims "over 100x energy efficiency gains vs GPUs, and a corresponding scaling law." A rounder number — up to 140x — has circulated separately from the post itself. Both trace back to the same place: a single cell in a three-row table, the row where the comparison GPU is running at 10% of its theoretical peak utilization. At the other two rows in that same table the multiplier is 28x and 14x. None of those numbers are measured on Z1 silicon.
That's the shape of this piece: what Z1 actually computes with, what a transformer becomes once its primitives are rebuilt around that computation, and exactly what "over 100x" turns out to describe once the table it comes from is read in full.
Z1: sampling as the computational primitive
Z1 is not a matrix-multiply accelerator with a lower clock and a smaller die. It computes by sampling. The chip is a graphical model of pbits — probabilistic bits, binary stochastic CMOS circuits whose state is biased by the pbits wired to them — programmed as an Ising model, the same energy function statistical physics uses for coupled spins:
Every pbit sits at a node of a fixed hardware graph , wired into the die at 16 couplings per node — not a configurable width, a physical constant. A single Z1 die has 8 cores, 269,568 pbits, and 2,135,904 of those hardwired coupling edges, running under one watt at a 50 MHz internal update clock. (One of the post's own image captions gives that edge count as 215,904 — evidently a dropped digit, since 2,135,904 is what appears twice elsewhere, including the footnote the energy numbers are built on.) The chip runs Gibbs sampling in place: each pbit repeatedly redraws its own value conditioned on its 16 neighbors, "executing a chromatic Gibbs sampling algorithm in-memory," in the post's words. There is no instruction stream computing a product — there is a physical system relaxing toward a distribution, and what you read out is a sample from it.
That has two consequences a GPU comparison has to sit with. First, a coupling can only be nonzero where the hardware graph actually has an edge — sparsity isn't a software choice on Z1, it's the shape of the silicon. A GPU gets its all-to-all reach from a cache hierarchy every core can address; Z1 has no such hierarchy, so 16 fixed neighbors is the entire radius of one pbit's computation. Second, a single readout of a pbit is one stochastic bit, not a number. Getting a usable real value means drawing repeatedly and averaging, and that average has finite precision that improves — slowly — with more samples.
Extropic's own encoding math makes the second point precise. For one tanh-linear unit — a visible pbit conditioned on 16 hidden neighbors — the conditional expectation is a tanh of the local field:
which is exactly the nonlinearity a neural network wants, sampled instead of computed. Recovering a real number from draws gives an empirical mean with a standard error that shrinks as , which the post turns into an explicit bits-of-precision bound: . Every extra bit of precision costs roughly four times the samples of the bit before it — and every sample has a publishing energy cost, 1.3×10⁻¹⁴ J, that a GPU's one-shot deterministic multiply never pays.
Continuous weights and activations get onto this substrate through dy4p encoding: four pbit streams, weighted 1/4, 1/8, 1/16 and 1/32, whose weighted sum approximates a 4-bit number, refined by exactly the same sample-averaging as above. A sparse matrix-vector product then becomes a layout problem — each output pbit spends its 16 physical couplings on 4 input values times 4 dy4p pbits per value — rather than a scheduling problem the way a GPU kernel is.
What "transformer-like" survives the substrate
A standard transformer block is self-attention, a norm, and a feed-forward network, and every one of those is built from dense matrix operations that assume the GPU's all-to-all reach. Z1T keeps the block-shaped, residual-connected structure of a transformer — stack these units, add the input back around each one — and rebuilds every primitive inside that shape around 16-way sparsity and sampling instead of dense linear algebra.
RMSNorm becomes Dynamic Tanh, a direct substitution the post justifies by noting each component of RMSNorm already resembles a tanh activation empirically:
The feed-forward network becomes exactly the tanh-linear unit above, with a sparse weight row laid out across the fabric rather than a dense matmul. Attention is the part that changes the most. Classic softmax attention needs a dense score matrix and work — nothing about that maps onto a fixed-degree graph. Z1T instead adapts gated convolutional attention (GCA), using 4-sparse projections and a running, convolution-based accumulation instead of an explicit attention matrix:
Y_t^i = tanh(Q_t^i) ⊙ (N_t^i / D_t^i)
N_t^i = conv1d(exp(K^i) ⊙ V^i, exp(w^i) − 1) + Σ_{j≤t} exp(K_j^i) ⊙ V_j^i
D_t^i = conv1d(exp(K^i), exp(w^i) − 1) + Σ_{j≤t} exp(K_j^i)
There is no softmax anywhere in this — the normalization is a running ratio instead — and every projection into it is sparse by construction. What's preserved is the shape of a transformer block and its residual stream; what's necessarily different is every operation that used to assume dense, all-to-all connectivity.
Z1 can't run all of this alone. The chip has no efficient way to do embeddings, residual adds, positional information, pooling, or the final projection to vocabulary logits, so Z1T runs as a disaggregated pipeline: sparse tanh-linear layers and attention gates on Z1, everything else on an FPGA co-processor riding the same board.
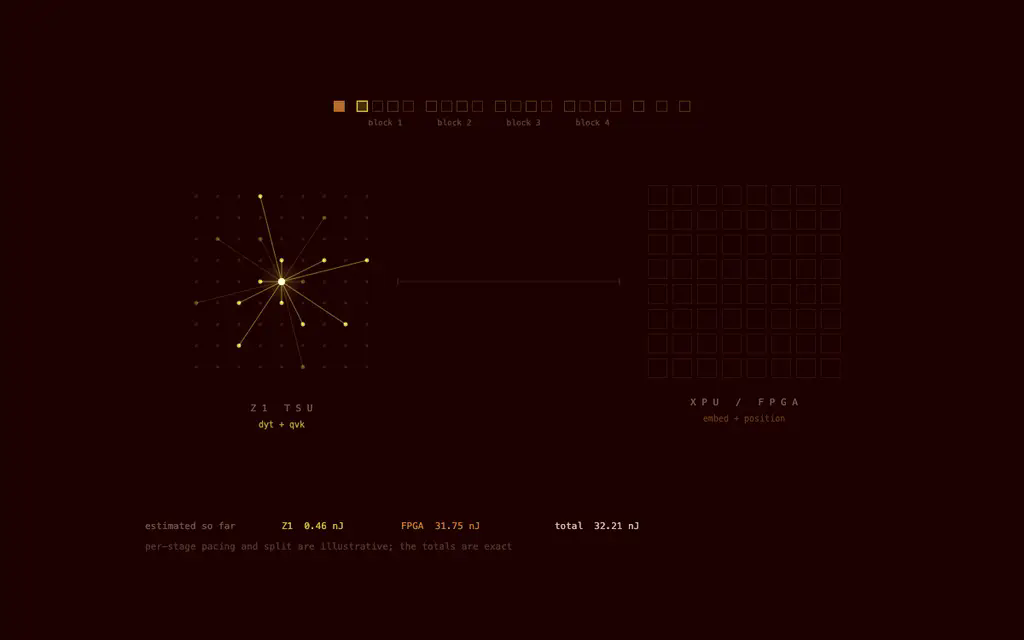
That split matters more than it sounds, because the post's own accounting shows the FPGA doing the vast majority of the energy work in this first version — more on that below.
The energy claim: what's actually measured, and what's a projection
This is the part worth being exact about, because the two sides of the headline comparison were produced by two different methods.
The H100 throughput numbers were genuinely measured: "we evaluated the speed with batch-1 sequential decoding of the model," on real hardware, dated in the post's own footnotes.
H100 baseline: NVIDIA H100 80GB HBM3, torch 2.7.0, dense-equivalent model,
D=512, L=4, 11.55M body parameters in fp16, measured 2026-08-12
The energy numbers on both sides of the comparison, though, are analytical models, not a wattmeter reading. The post's own words: "the following projections are based on theoretical chip energy consumption of Z1 based on our best estimates, which are anchored to reality from our experiments with similar pbits in X0" — X0 being a different, earlier prototype chip, not Z1 itself. The FPGA side of Z1T's number is labeled the same way:
Z1 sampling energy: 1.3e-14 J per sample
FPGA estimate: 0.2 pJ/matrix-multiply op, 3.0 pJ/scalar op, 1.5 W assumed static power
H100 reference: 32-bit floating-point peak energy 0.177 pJ per floating-point operation,
the same next-token step run densely, with no sparsity exploited,
model FLOPs utilization varied above
Even the H100 side of the energy figure is a peak-energy-per-FLOP constant multiplied through, divided by an assumed utilization — not a measured power draw either. What differs is what each side is anchored to: the H100 numbers rest on a shipping, extensively characterized chip; the Z1 numbers rest on Extropic's own internal estimate of a chip that, by the post's own description, hasn't yet run this workload for real. There is no reported measurement anywhere in this post of Z1T actually running on Z1 silicon.
With that framing in place, here is the table the "over 100x" and "up to 140x" numbers both come from, reproduced in full rather than as one cell:
| H100 utilization (MFU) | H100 energy / token | H100 / Z1T (system) | H100 / Z1 layers only |
|---|---|---|---|
| 10% | 40.9 µJ | ≈139× | ≈4,680× |
| 50% | 8.17 µJ | ≈28× | ≈935× |
| 100% | 4.09 µJ | ≈14× | ≈468× |
Z1T's own total is 294.52 nJ per token — 8.74 nJ of Z1 sampling plus 285.78 nJ of FPGA work, meaning the FPGA this version leans on for everything Z1 can't do is already responsible for more than 95% of the system's energy. "Z1 layers only" strips the FPGA out of the denominator entirely, which is why that column runs 30–35 times higher than the system-wide one at every row — it's comparing an H100 to a component, not to a system that could serve a request end to end today.
Read the table this way and the two headline numbers stop looking like a discrepancy and start looking like the same number described two ways. The post's own citation for real-world GPU utilization is Llama 3's own paper: "in LLMs such as Llama 3, MFU is around 40%." At that utilization the system-wide multiplier is roughly 35x — nowhere near "over 100x." The only row that clears 100x is the one where the H100 is running at a quarter of Llama 3's own cited real-world figure. "Over 100x" is the post's own conservative phrasing of that 139x cell; the "140x" that circulated separately doesn't appear anywhere in the post's text at all — the nearest real number is 139, and 140 reads like a round-number sanding of it, not a distinct measurement.
One more number belongs in this section, and it's arguably the most consequential one in the whole post. Both sides of every ratio above exclude the final dense logit-readout layer — the projection from hidden state to vocabulary, the one part of a forward pass no sparse trick here touches, because it runs entirely on the FPGA. Include it and the post says Z1T's own total rises to approximately 136.4 µJ per token — about 463 times higher than the 294.52 nJ headline figure, from adding back exactly one operation. The layer this comparison leaves out is not a rounding error; on the FPGA-heavy pipeline Z1T ships today, it would be most of a token's real cost.
The scaling law: what it actually is
The post claims "a corresponding scaling law," and runs two separate experiments to back it.
The first is Z1T-specific: sweep model size for the actual GCA architecture matched to Z1's constraints (4-bit weights, 4 incoming edges per output node), train on OpenWebText with the GPT-2 byte-pair tokenizer, and plot validation loss against training FLOPs.
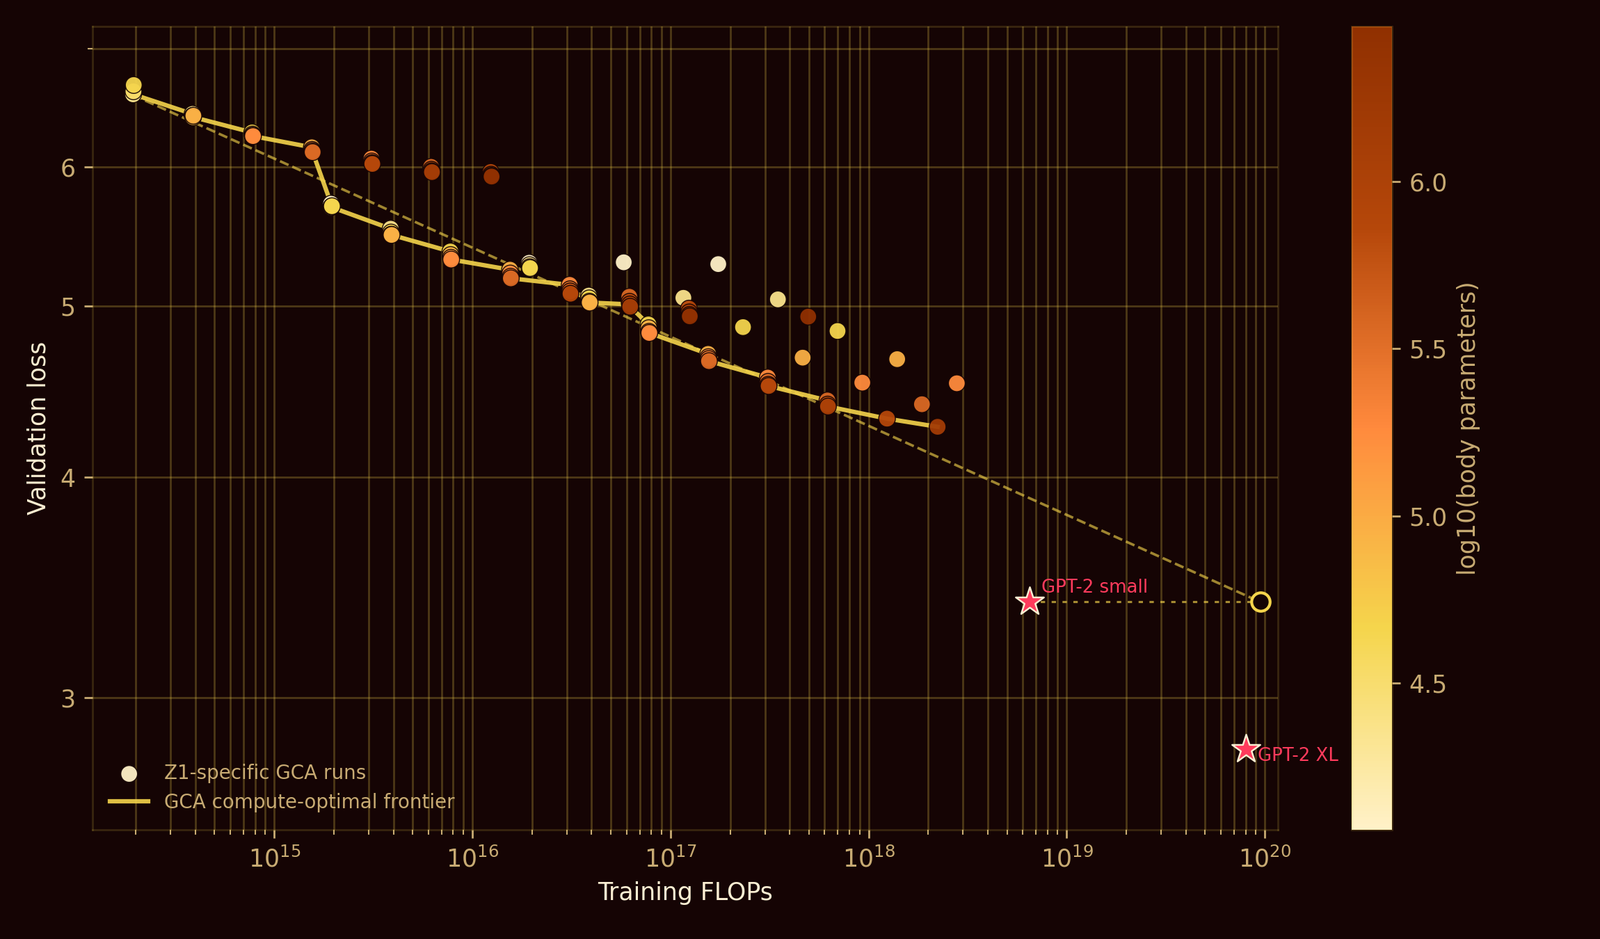
Two things worth being precise about here. First, the "GPT-2-small" star on that plot is 85 million parameters, which the caption is careful to note is "under the same convention" Extropic uses elsewhere — their own body-parameter count, excluding the embedding-to-vocabulary matrix, not the 124M figure GPT-2-small is usually cited at. Second, the headline claim built on this figure — "about an order of magnitude more FLOPs with our sparser Z1T model to achieve the same loss as a GPT-2 model," at an extrapolated 9.5×10¹⁹ FLOPs — sits past the right edge of the actually measured range. The dashed segment of that line is a fit continued forward, not a run that was executed and plotted.
The second experiment is more general and, by the post's own account, the one meant to establish the scaling law rather than just Z1T's own curve: a standard GPT-2-style decoder with one added knob, connectivity , controlling both the sparsity of every projection matrix and the width of a windowed attention mask. plus a fully dense baseline, sequence length 256, swept from 3×10¹⁴ to 1018 training FLOPs — a run that, as width increases, moves from about 5% sparse toward 99.8% sparse even though the node degree stays fixed, because a fixed-degree graph becomes proportionally sparser as the matrix around it grows.
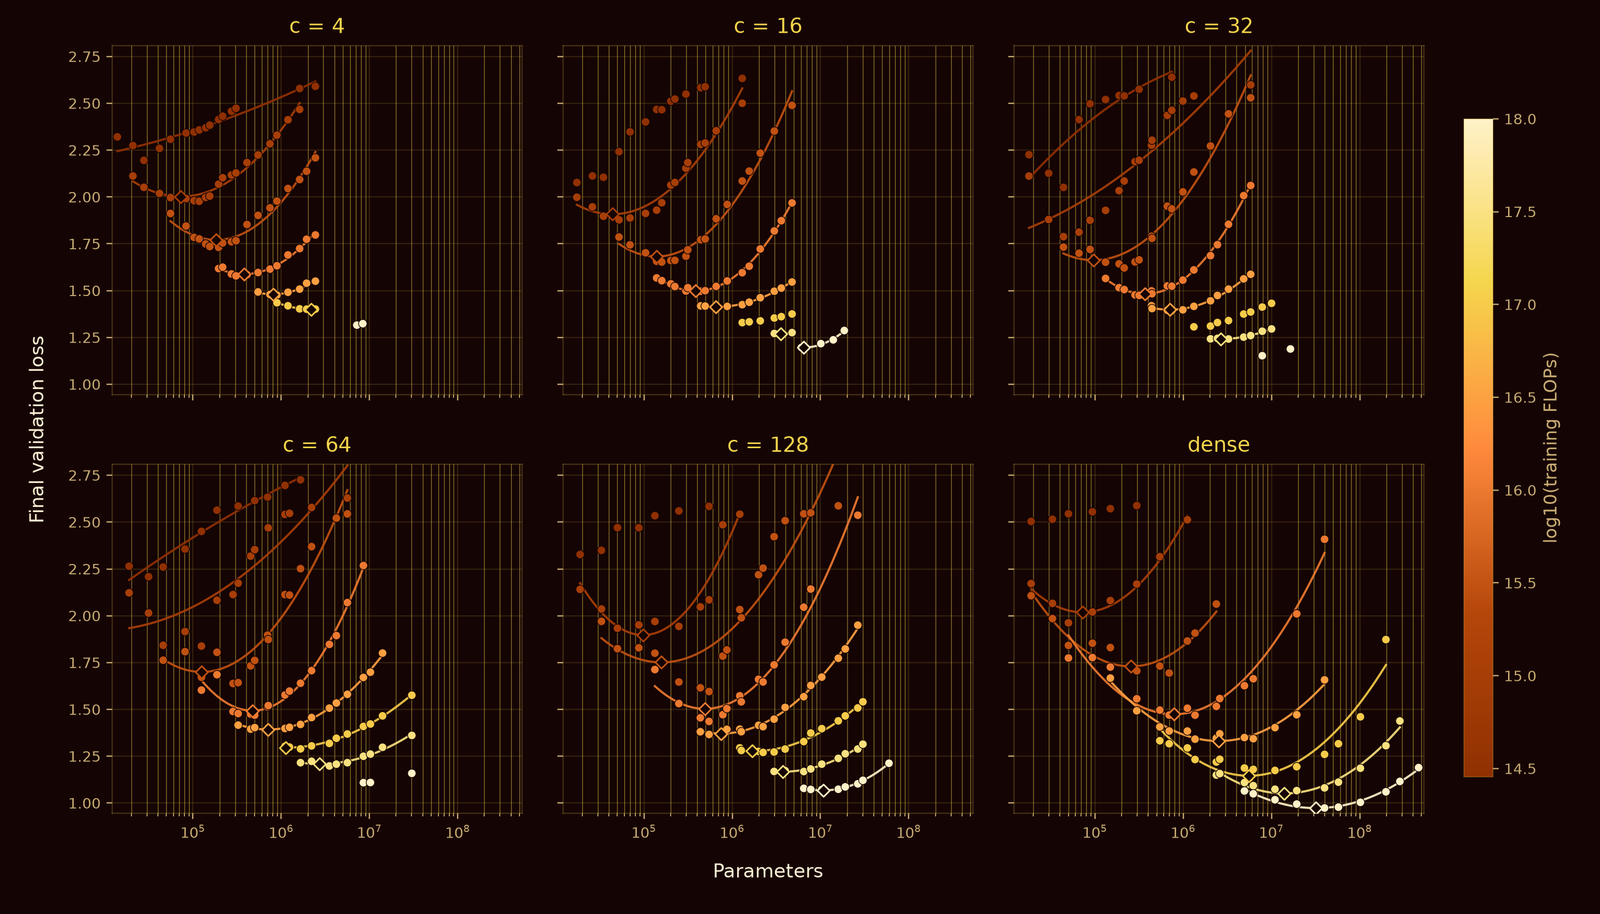
This is genuine scaling-law methodology — iso-FLOP curves with fitted minima, the same technique Hoffmann et al.'s Chinchilla paper used across 400+ models to fix model/data allocation. What's missing is the thing that usually follows that methodology: a printed functional form. Chinchilla published with fitted exponents; the Skaling law this site covered separately publishes an explicit correction to that form with its own fitted . Z1T's post states, in prose, that connectivity "parallels" the standard scaling trend and shows the frontier and iso-FLOP curves that would support fitting one — but no equation, no exponent for connectivity itself, appears anywhere in the piece. The fuller walk through what a scaling law claim looks like when the functional form is the point is a useful contrast: this post has the plots a scaling law needs and stops one step short of publishing the law itself.
Model sizes, benchmarks, and what's released
The featured Z1T configuration is small by any current standard: 4 layers, 512-dimensional hidden state, 1024-token context, 4 GCA heads, kernel size 4, sparse degree 4 — a shape chosen, per the post, because it was "our best-performing configuration for Z1 from our fairly broad agentically-driven explorations," not because it targets any particular deployment scale. Every quantitative result in the post is a validation loss curve on OpenWebText; there is no downstream task benchmark anywhere in it — no accuracy number on any standard eval, only the loss-versus-compute curves above.
What is genuinely released is real. Extropic states plainly that they are "open sourcing our training recipes for the sparse transformers used to produce our scaling laws, as well as open sourcing the weights for one of the larger training runs for Z1T," with working links to both a Hugging Face weights repository and a GitHub training recipe. For a first release built on pre-production hardware, shipping both is a real commitment, not just a claim — it's checkable independent of anything else in this piece.
What Extropic itself says isn't finished
The post's own outlook section is unusually direct about where the current numbers stop being representative of Z1's ceiling: "our energy estimates indicate that the FPGA consumes the vast majority (>95%) of the energy," and removing that bottleneck with a chip designed around Z1T from the start could, in their words, "potentially reach up to 1000x greater energy efficiency than GPUs" — a number that sits alongside the "Z1 layers only" column above (468–4,680x depending on MFU) as the aspirational ceiling if the FPGA dependency goes away, not a claim about the system that exists now. This is the fourth Extropic paper in a lineage of probabilistic-hardware work rather than a first attempt at the substrate itself, and the post frames Z1T explicitly as "an initial study in sparse neural-network and hardware co-design," with the current FPGA split described as a starting point Extropic expects future silicon to remove rather than a permanent architecture.
Checked, in one table
| Claim | Status |
|---|---|
| "Over 100x energy efficiency gains vs GPUs" (the post's lede) | Holds for exactly one row of the published table — 10% H100 utilization, ≈139×. Drops to ≈28× at 50% and ≈14× at 100%, both under 100x |
| "Up to 140x" (circulated separately from the post) | Doesn't appear anywhere in the post's own text — the nearest real number is ≈139×, at the same 10%-MFU row above |
| Z1's energy and latency figures are measured on Z1 silicon | Does not hold — explicitly "theoretical chip energy consumption... based on our best estimates," anchored to a different, earlier chip (X0), not Z1 running Z1T. The H100 throughput numbers are real measurements; the H100 energy figures are also a peak-energy-per-FLOP model, not a wattmeter reading |
| A "corresponding scaling law" | Real iso-FLOP methodology and a fitted compute-optimal frontier exist, but no closed-form equation or fitted connectivity exponent is published — unlike Chinchilla or the Skaling law this site covered separately |
| The GPT-2-small match point (9.5×10¹⁹ FLOPs) is a measured result | Does not hold — it's a log-log fit extrapolated roughly two orders of magnitude past the actually measured FLOP range (~2×10¹⁴–2×10¹⁸) |
| GCA and DyT are real architectural substitutions, not relabeled dense ops | Holds — both are specified in full, with equations, and matched to the hardware's 16-way degree constraint |
| Training recipe and weights are genuinely open | Holds — working Hugging Face and GitHub links, for one of the larger training runs |
| The excluded final logit layer is a minor omission | Does not hold — the post's own number for including it is ≈136.4 µJ/token, about 463× the 294.52 nJ headline Z1T figure |
The take
Z1's substrate is worth taking seriously on its own terms: a chip that computes by relaxing a physical system toward a distribution rather than executing an instruction stream is a genuinely different kind of machine, and the post explains it in real detail — the Ising energy function, the tanh-linear derivation, the dy4p encoding, the exact degree-16 constraint every operation has to respect. Z1T's response to that constraint is a legitimate piece of co-design, not a relabeling: gated convolutional attention and Dynamic Tanh are specific, motivated substitutions for the parts of a transformer that assumed dense, all-to-all reach, and they're documented precisely enough to check.
The efficiency numbers built on top of that substrate deserve the same precision the substrate itself gets. "Over 100x" and the "140x" that traveled without it are both one cell of a table whose other two cells say 28x and 14x, describing a hardware comparison built entirely from projected energy models rather than a measurement of Z1T running on Z1, at a GPU utilization four times below what the post's own citation gives for real LLM serving, excluding the one layer — vocabulary logits — that the post's own numbers say would dominate the total by nearly three orders of magnitude if it were counted. None of that makes the substrate uninteresting. It makes "over 100x" a number that describes a best case worth stating precisely, not a system-wide result worth repeating without its row.
For more on what a scaling law needs to actually claim, see the Skaling law's additive-form critique and the wider walk through 2026 scaling practice; for the attention-mechanism landscape GCA is joining, a field guide to the family covers where softmax-free, linear-time variants like this one sit relative to sliding-window and low-rank alternatives.
Sources: the Z1T post itself, including its full text, published energy and throughput tables, "Model details" and "Latency model details" footnotes, and referenced figures; Extropic's Z1 launch post, "From One to One Billion"; the Z1T weights on Hugging Face and the open training recipe on GitHub; Hoffmann et al.'s Chinchilla paper and Zhai et al.'s Attention Free Transformer, both cited by the post itself for the scaling-law methodology and the GCA lineage respectively; Grattafiori et al.'s Llama 3 Herd of Models, the post's own source for real-world GPU utilization. The energy-per-token and sampling-versus-matmul diagrams are original, built from the numbers and equations the post publishes; the three embedded figures are Extropic's own, downloaded and hosted locally for this piece.