2026-09-18 · 18 min · evaluation · calibration · llm · fraud-detection · benchmarks
On September 17, 2026, Hassan El Mghari — Developer Experience Lead at Together AI — posted a 12.8-second screen recording of a fraud pipeline: TypeSafe's Jev classifies 100 emails, and any email Jev is not sure about gets re-read by Kimi K3 on Together. His summary: "Jev classified 100 emails in 1.42 seconds, then I routed the uncertain cases to Kimi K3. The full pipeline got 96/100 correct for only ~$0.07." Eight hundred likes, fifty thousand views, and a pattern that is genuinely worth copying — a cheap decisive model in front of an expensive one, with a confidence threshold deciding who pays.
This site has already covered Jev three times: the product and its claims, the decoding mechanism that makes it fast, and what the ecosystem built in the first nine days. I am not re-running any of that here. This piece is about one question those three do not touch: does the structured extraction step actually help the downstream decision, and how would you know?
For a fraud claim, accuracy alone is not evidence. Fraud is an imbalanced problem, and a classifier that answers "not fraud" every time scores 99%-plus on any realistic base rate. So the only numbers that mean anything are the base rate, the confusion matrix, precision at a fixed recall, and where the threshold sits. The thread publishes one of those four. The app in the video publishes all of them, which is the good news and also the finding: the honest version of this result is on screen in the recording and did not make it into the post.
What is actually in the recording
There is no repository. I checked all 91 public repos under the author's GitHub account and
found no fraud, phishing, or Jev project; the app runs at http://localhost:3017 and the page
header links out to the dataset, not to source. So the primary source here is the video
itself, frame by frame. I pulled the 2920x2160 variant and extracted frames at 4 fps:
# 12.833s, 60fps, 2920x2160 — 51 frames is enough to read every counter
ffmpeg -i demo4k.mp4 -vf fps=4 hf/h%03d.png
The app is called Relay. Here is its state at t = 11.0s, with 99 of 100 emails resolved and one still with Kimi K3.
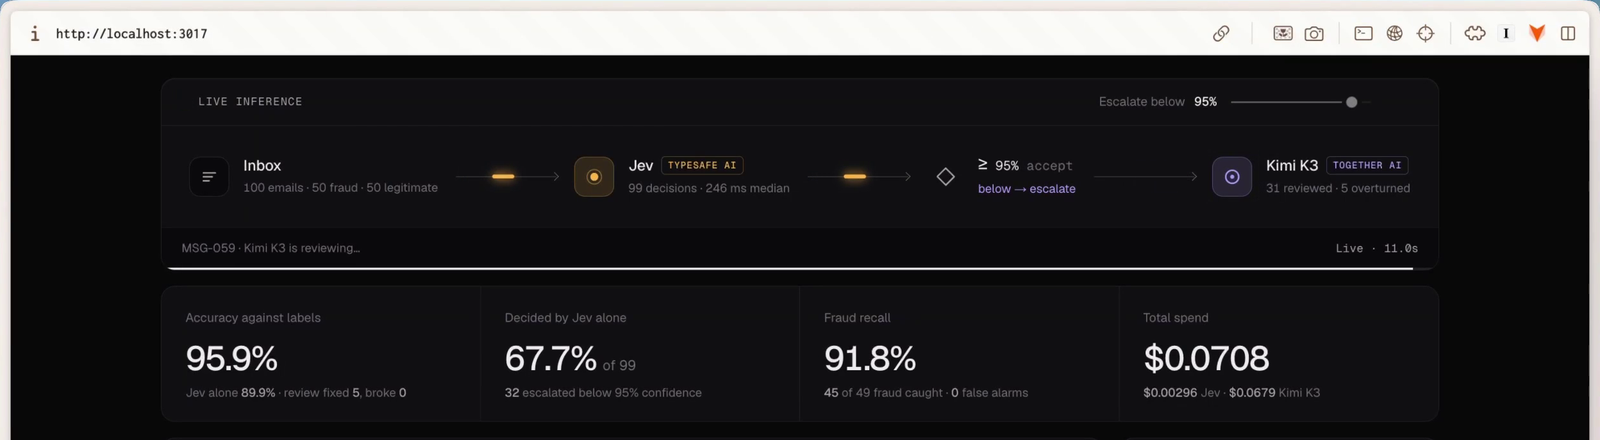
Read the inbox line first: 100 emails, 50 fraud, 50 legitimate. That is the base rate. It is 50%.
And read the app's own footer, visible in every frame where the page is scrolled down:
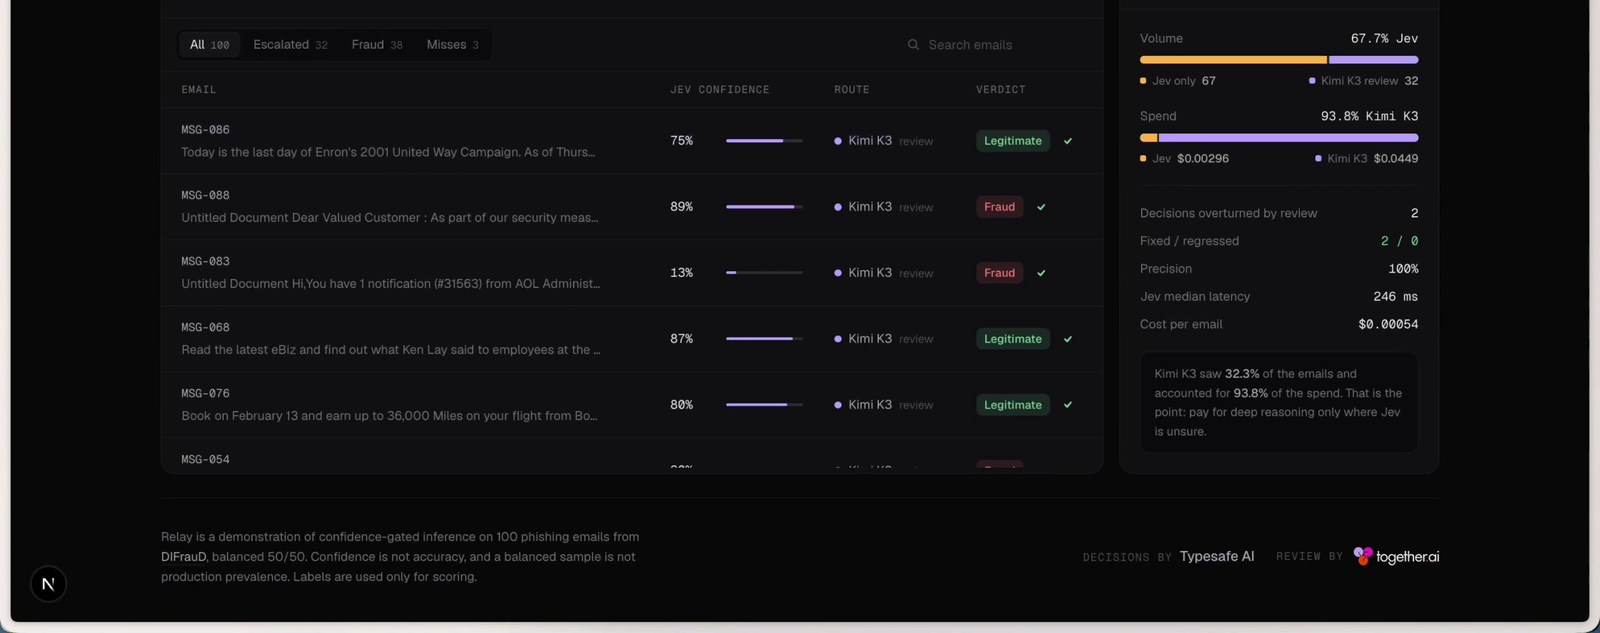
Relay is a demonstration of confidence-gated inference on 100 phishing emails from DIFrauD, balanced 50/50. Confidence is not accuracy, and a balanced sample is not production prevalence. Labels are used only for scoring.
That is three caveats, all correct, all stated by the person who built it, and none of them in the thread. The rest of this article is mostly arithmetic on top of that sentence.
The evaluation set is real, and public
DIFrauD is the Domain Independent Fraud Detection benchmark — a real corpus, MIT-licensed, on Hugging Face, 95,854 samples across seven domains. Its phishing split is 15,272 emails: 6,074 deceptive, 9,198 non-deceptive. The paper behind it is Boumber, Qachfar and Verma, "Domain-Agnostic Adapter Architecture for Deception Detection", LREC-COLING 2024 — the dataset card gives that conference citation and no arXiv ID, so I am not going to invent one.
This matters more than it sounds. The alternative — a fraud demo scored on emails a model
generated and a model judged — would be circular by construction, and a lot of demos are built
that way. This one is not. The email subjects visible in the recording are consistent with the
corpus: Enron-era internal mail ("Today is the last day of Enron's 2001 United Way Campaign", "Read the latest eBiz and find out what Ken Lay said to employees") on the
legitimate side, and 2000s-era phishing on the other. Real text, human labels, independent of
both models. Credit where it is due: this is the right eval set.
What is not right is the sampling. DIFrauD's phishing split is 39.8% deceptive. Relay draws a balanced 50/50 hundred out of it. Neither number is an inbox.
The confusion matrix nobody printed
The tiles in fig. 1 are enough to reconstruct the whole matrix, because one of them gives the false-alarm count directly. At t = 11.0s, 99 emails have resolved: 49 fraud, 50 legitimate. "45 of 49 fraud caught · 0 false alarms" fixes every cell.
| label: fraud | label: legitimate | ||
|---|---|---|---|
| verdict: fraud | 45 | 0 | precision 100% |
| verdict: legitimate | 4 | 50 | |
| recall 91.8% | specificity 100% | accuracy 95/99 |
The thread's final 96/100 implies the same shape once the last email lands: 46 true positives, 4 false negatives, 0 false positives, 50 true negatives. Precision 100%, recall 92%.
Now look at what that precision is standing on. It was measured on fifty negative examples.
Zero false alarms out of fifty is not a measurement of a small false-positive rate; it is the
absence of one. The exact one-sided 95% Clopper-Pearson bound for 0 successes in 50 trials is
1 - 0.05^(1/50) = 5.8%. Every false-positive rate from 0% to 5.8% is consistent with what
this run observed. At a 50/50 base rate, that entire interval still produces precision between
94% and 100%, so it does not matter. At any prevalence an inbox has, it is the only thing that
matters:
- alerts / 10k
- 4883
- real fraud
- 4592
- false alarms
- 291
Slide prevalence down to 0.5% with the false-positive rate at its 5.8% bound and precision lands at 7.4% — about a dozen false alarms for every real one, from a model whose measured recall has not changed at all. That is not a claim that Relay's false-positive rate is 5.8%. It is a claim that the run cannot tell you it is not, and that the difference between "0%" and "1%" — invisible in a 50-email sample — is the difference between a usable queue and an unusable one.
The fix is cheap and boring: draw the hundred at the prevalence you care about, or draw a thousand negatives and a hundred positives and report the two rates separately. DIFrauD has 9,198 non-deceptive emails sitting right there.
What the gate is actually gating
The threshold in the header slider reads "Escalate below 95%", and the column it thresholds is
labelled JEV CONFIDENCE. It is worth being precise about what that number is, because it is
not a probability that the answer is right.
From TypeSafe's own docs at docs.typesafe.ai/confidence:
The answer's
confidenceproperty collapses that shape into a single number from 0 to 1, so you can threshold on it without doing the math yourself. (Noul answers don't carry one.) [...] a flatter distribution means lower confidence.
So confidence is a sharpness statistic over the probabilities vector — how peaked the
distribution is — and it exists for Choice and Score but not for Noul. On a two-option
Choice, a confidence of 13% means the two probabilities are nearly equal, not that Jev
thinks there is a 13% chance of fraud. That is consistent with everything in the recording: I
transcribed every row I could read, and they split exactly where a hard gate at 95 would put
them.
Every per-email row I could read off the recording, transcribed by hand. Twenty of the 100 decisions are legible at some point in the 12.8 seconds: the Jev confidence, the route the gate chose, the final verdict, and whether the app scored it against the DIFrauD label. Five took the direct route and read 97-100%; fifteen were escalated and read 10-94%. All three legible misses are escalated rows that Kimi K3 reviewed and still got wrong.
| jev confidence | route | verdict | vs label | |
|---|---|---|---|---|
| MSG-002 | 10% | Kimi K3 | Legitimate | correct |
| MSG-012 | 78% | Kimi K3 | Legitimate | MISS |
| MSG-039 | 75% | Kimi K3 | Legitimate | MISS |
| MSG-052 | 87% | Kimi K3 | Fraud | correct |
| MSG-053 | 89% | Kimi K3 | Fraud | correct |
| MSG-057 | 93% | Kimi K3 | Legitimate | correct |
| MSG-061 | 94% | Kimi K3 | Legitimate | correct |
| MSG-068 | 87% | Kimi K3 | Legitimate | correct |
| MSG-069 | 31% | Kimi K3 | Fraud | correct |
| MSG-076 | 80% | Kimi K3 | Legitimate | correct |
| MSG-083 | 13% | Kimi K3 | Fraud | correct |
| MSG-086 | 75% | Kimi K3 | Legitimate | correct |
| MSG-088 | 89% | Kimi K3 | Fraud | correct |
| MSG-091 | 80% | Kimi K3 | Legitimate | MISS |
| MSG-049 | 78% | Kimi K3 | Fraud | not legible |
| MSG-081 | 99% | Jev direct | Legitimate | correct |
| MSG-082 | 99% | Jev direct | Legitimate | correct |
| MSG-098 | 99% | Jev direct | Legitimate | correct |
| MSG-099 | 97% | Jev direct | Fraud | correct |
| MSG-100 | 100% | Jev direct | Fraud | correct |
Twenty rows is a convenience sample, not a random one: it is whatever happened to be on screen while the page was scrolled. It cannot be used to estimate the confidence distribution over all 100 emails. What it does establish is the range on each side of the gate, and that at least three of the run's four residual errors sat in the escalated bucket rather than the accepted one.
Two things follow. First, the docs do not publish the formula — the same page says the
tradeoffs between different spread statistics are "a specialized topic that we'll keep to a
separate cookbook rather than this page, and will add the link here when we do!" So the
quantity being thresholded at 95% is an undocumented function of the distribution. If you want
a number you can reason about, probabilities is right there in the same response and means
what it says.
Second, and more to the point for anything with a cost model attached: a threshold on
confidence is not a threshold on accuracy unless something maps one to the other. That map
is a reliability diagram. I searched the entire 816 KB of docs.typesafe.ai/llms-full.txt —
the full documentation site as one file — for an expected calibration error, a Brier score, a
reliability diagram or a calibration curve:
curl -s https://docs.typesafe.ai/llms-full.txt -o ts.txt
wc -c ts.txt                                        # 835504
grep -c -iE '\bece\b|brier|reliability diagram|calibration curve' ts.txt   # 0
grep -o -i 'calibrat[a-z]*' ts.txt | wc -l          # 24
Twenty-four uses of the word, zero published measurements of the thing. The one calibration
number that exists anywhere in this story is an outside reimplementation's, and the ecosystem
piece covers it: pngwn/open-jev committed a metrics.json with ECE
7.3% before temperature scaling and 2.2% after. That is a different model. Nobody has published
one for Jev.
Where the four errors actually live
"Review fixed 5, broke 0" is a good number and it is doing less work than it looks like it is doing. It counts flips: escalated emails where Kimi K3 disagreed with Jev and turned out to be right. It does not count escalated emails where Kimi K3 agreed with a wrong answer, and those are the interesting ones.
Of the twenty rows I could read, three are scored wrong against the label — MSG-012 at 78%
confidence, MSG-039 at 75%, MSG-091 at 80%. All three took the Kimi K3 route. All three came
back Legitimate. The run ends with four misses — 96 of 100 — so at least three of the
pipeline's four residual errors are emails that the expensive model personally reviewed and
still got wrong.
That reframes the pattern. The thread describes routing to Kimi K3 "to be fully sure." What the run measured is that escalation moved 5 of 31 reviewed decisions and left at least 3 wrong — a review path that is useful and is not a backstop. Both of those can be true; only one of them is in the summary.
There is also an arm of the experiment that was never run. Relay measures Jev alone (89.9%) and Jev-plus-gate (95.9%). It never measures Kimi K3 alone on all 100, so nothing in the run tells you whether the pipeline is more accurate than simply sending everything to the big model — only that it is cheaper. At the measured $0.00219 per review, all-Kimi would have cost about $0.22 against the pipeline's $0.0708 — a real 3.1x saving, and a much smaller multiple than "a fast specialized model for the narrow task" tends to suggest. Three operating points, two of them measured:
| Configuration | Cost | Accuracy |
|---|---|---|
| Jev only, no gate | $0.00296 | 89.9% (measured) |
| Jev + 95% gate + Kimi K3 | $0.0708 | 95.9% (measured) |
| Kimi K3 on all 100 | ~$0.22 (my arithmetic) | never run |
The spend says there is no reasoning in the review
The panel in fig. 2 ends with a line of framing: "pay for deep reasoning only where Jev is unsure." The bill does not support the word "reasoning."
Two published prices and two measured totals are enough to check it. Jev is $0.042 per
million input tokens with output metered free (TypeSafe's models
page; jev-1.12). Kimi K3 on Together is $3.00 per million
input and $15.00 per million output (together.ai/models/kimi-k3,
2.8T parameters, 1.05M context, model id moonshotai/Kimi-K3). The app reports $0.00296 of
Jev across 100 emails and $0.0679 of Kimi K3 across 31 completed reviews.
Jev's line pins the state size: 0.00296 / (0.042/1e6) / 100 = 705 billed input tokens per
email. Both models are reading the same email. Feed that into Kimi's total and there is
essentially nothing left:
- input spend
- $0.0656
- left for output
- $0.0023
- a bare verdict token3 tok ✓
- a JSON label — {"verdict":"fraud"}8 tok ✗
- one sentence of justification30 tok ✗
- a short chain of thought300 tok ✗
At 705 input tokens per review, $0.0679 leaves about five output tokens each. Push the input length down to 300 tokens — a much shorter average than Jev's own line implies — and it is still only 86. And in the impossible limit where the input costs nothing at all, the ceiling is 146 tokens per review. There is no configuration of this arithmetic in which Kimi K3 emitted a chain of thought. It emitted a label.
That is not a flaw. A 2.8T-parameter model returning one structured verdict is a perfectly good use of a 2.8T-parameter model, and it is exactly why the escalation costs cents instead of dollars. It is only a problem for the sentence on the panel, and for anyone reading the demo as evidence that a reasoning model reasoned about the hard cases.
The other end of the same arithmetic: 31 reviews and 5 corrections is 6.2 reviews per fixed decision, at $0.0679 for the 5 — about $0.0136 per corrected decision, against $0.0000296 for a Jev decision. Kimi K3 saw 32.3% of the volume and took 95.8% of the bill. That ratio is the actual product here, and it survives every criticism above.
The published code is a different project, with no evaluation at all
If you want to read a Jev fraud path in source rather than in a video, the one that exists is
frankied003/fraud-jev — a Next.js control room
that races Jev against Claude on payment scoring. It is a useful contrast because it makes the
opposite tradeoff: real code, no evaluation.
Its Jev call in src/app/api/analyze/jev/route.ts uses four noul questions, which is the
primitive that returns an actual probability:
// src/app/api/analyze/jev/route.ts
const response = await client.systemOne({
  model: "jev-latest",
  state,
  questions: {
    fraud: noul({ task: "Is this payment likely fraudulent?", /* … */ }),
    ato: noul({ task: "Is this payment consistent with account takeover (ATO)?", /* … */ }),
    money_laundering: noul({ task: "Does this payment look like money laundering…?", /* … */ }),
    unusual_behavior: noul({ task: "Is this payment unusual for THIS user…?", /* … */ }),
  },
})
and thresholds them in src/lib/fraud.ts, in code, where a reviewer can see every cutoff:
// src/lib/fraud.ts
export function decideFromScores(scores: RiskScores, toCountry?: string): FraudDecision {
  if (
    scores.fraud >= 0.85 ||
    (scores.moneyLaundering >= 0.7 && scores.unusualBehavior >= 0.7 && scores.fraud >= 0.7)
  ) {
    return "BLOCK"
  }
  if (
    (toCountry && isOfacDestination(toCountry)) ||
    (scores.fraud >= 0.65 && scores.ato >= 0.65) ||
    (scores.moneyLaundering >= 0.65 && scores.unusualBehavior >= 0.65) ||
    scores.unusualBehavior >= 0.75
  ) {
    return "REVIEW"
  }
  return "ALLOW"
}
That is the shape TypeSafe's own docs recommend — thresholds in one file, probabilities rather
than a spread statistic, code doing the mapping. But the transactions are generated:
src/lib/payments.ts builds them with Math.random() and a comment that reads // Default stream: ~6% suspicious so most payments auto-pass. And src/lib/types.ts puts
suspiciousBias: number on every Transaction — a latent label, sitting in the type, never
read. A repo-wide grep for accuracy, correct, precision, recall and confusion returns
zero hits across the whole project. It is a latency and UX demo, and it does not claim
otherwise.
So the two public Jev fraud projects split the evidence between them. One has real labels, a real public corpus and a complete confusion matrix, and no source. The other has readable source, sane primitives and no evaluation whatsoever. Neither has both.
Small things that do not quite reconcile
None of these change the result. They are the kind of thing you only see by reading the frames.
- 31 or 32. The thread says "31 emails fell below that threshold." The app's tile says "32 escalated below 95% confidence" and the pipeline strip says "31 reviewed". The thread reports the in-flight count as the final count.
- One decision out of step. In the frame above, "Jev alone 89.9% · review fixed 5, broke 0" implies 94 of 99 correct, and the headline tile says 95.9%, which is 95 of 99. Two counters in the same frame disagree by exactly one decision. That is what a live-updating dashboard looks like mid-run, not evidence of anything worse.
- 1.42 seconds is wall clock, not latency. The app reports a 246 ms median for Jev. A
hundred of those in series is 24.6 seconds; 1.42 seconds is a parallel fan-out. Both numbers
are real and they measure different things. For scale, TypeSafe's own cookbook tables report
111-114 ms for a
Choice, so 246 ms on an email-sized state is unremarkable rather than slow. - Cost per email drifts during the run, $0.00054 at t = 5.7s to $0.00072 at t = 11.0s, because Jev's pass finished at 1.42s and the reviews stream in afterwards. Accuracy drifts the same way, 98.6% down to 95.9%, as the easy cases resolve first. Screenshot a live demo early and every number flatters it.
What I would want before believing this in production
Not much, and all of it cheap.
- The hundred at the right prevalence. Same code, same models, 1,000 legitimate emails and 50 fraudulent ones out of the same DIFrauD split. Report precision and recall separately. This is an afternoon.
- A reliability diagram for the gated quantity. Bucket Jev's confidence, plot accuracy per bucket, publish the ECE. Without it, "escalate below 95%" is a number chosen by feel, and no cost model can be attached to it.
- The missing arm. Kimi K3 on all 100, scored. Otherwise nobody knows whether the gate is buying accuracy or only saving money.
- The repo. Everything above is reconstructed from a screen recording, which is a ridiculous way to have to check a result that the author clearly measured properly.
The pattern deserves the attention it got. A calibrated-ish cheap model in front of an expensive one, with an explicit escalation budget, is the right architecture for a lot of production decisions, and Relay is a better-built demonstration of it than the thread lets on — it uses a real public corpus, it scores against real labels, and it prints its own caveats at the bottom of the page. The gap is entirely between what the app measured and what the summary said. Two extra sentences would have closed it.
What would change my mind
5 claims above, and what would falsify each
The 96/100 headline is uninformative without the base rate.
A run on the same pipeline at a prevalence below 5%, reporting precision and recall separately, that lands within a few points of the balanced-sample numbers. I would expect recall to hold and precision to move a lot; if precision holds too, the false-positive rate is genuinely near zero and the 50-negative sample was just too small to show it.
The false-positive rate is unmeasured, not zero.
Any evaluation with enough negatives to put a useful bound on it — a few hundred legitimate emails with zero false alarms would tighten the 95% bound from 5.8% to under 1% and make the precision projection above irrelevant.
The escalation to Kimi K3 emits a label, not reasoning.
A token count from the run, or a spend figure that does not fit $3.00 / $15.00 per Mtok at roughly 700 input tokens per email. Cached input at $0.30/Mtok would also break my arithmetic, though the email body is unique per call and cannot be cached. If the escalated emails averaged far fewer tokens than Jev's own spend implies, the ceiling rises — to 86 tokens at 300 input tokens, and never above 146.
At least three of the four residual errors were reviewed by Kimi K3.
The three I identified — MSG-012, MSG-039, MSG-091 — are transcribed from frames and could be misread; the committed JSON says exactly which. A per-email export from the run, which the app's download button suggests exists, would settle it in one file.
No calibration measurement for Jev has been published.
An ECE, Brier score or reliability diagram from TypeSafe. My check is a grep over
docs.typesafe.ai/llms-full.txtas of 2026-09-18, which is the whole docs site but not the whole company; a blog post or a model card would overturn it immediately.