2026-09-19 · 25 min · explainer · llm · architecture · calibration · benchmarks
The interesting thing about a narrow interface is what people do to it when they stop respecting the narrowness. Jev exposes three primitives — pick one of these options, score against this rubric, give me one probability — and the ecosystem piece found fifteen projects using them for roughly what they are for: a cheap classifier in front of an expensive model.
This week's batch is different. Two projects point the decision interface at things that are not decisions, and in doing so reveal the shape of the interface more clearly than any benchmark has. And a third project — which is not Jev, not a model, and arguably not a project — makes a sharper point about evaluation than anything else I have read this month, by accident or by design.
Part one: a decision model as an image model
achimala/jev-paint — renamed from
Jevinci on the 19th, one commit before I cloned it — is 940 lines of
dependency-free browser JavaScript plus a 76-line Python standard-library proxy.
The pitch is that it turns Jev into an image model: no diffusion, no image-gen API,
"Jev predicts every pixel's color in parallel and we paint them," with the
brush getting wider the more confident Jev is.
That is an accurate description of what it does, and reading the code makes it much stranger than the summary.
What is actually being asked
web/jev.mjs builds one state block — the prompt, the grid dimensions, a
sentence explaining that the origin is top-left, and a task instruction — and
then, for a grid of side n, builds n² questions. The question type depends on
which of four representations you pick:
- palette — one
choiceper pixel over sixteen named colours (black, white, gray, red, orange, pink, brown, tan, green, dark_green, blue, sky_blue, yellow, purple, navy, cream). One question per pixel. - silhouette — one
noulper pixel: "Is pixel (x=7, y=12) inside the foreground silhouette described in state?" - rgb — three
noulquestions per pixel, one per channel, each channel strictly on or off. Eight possible colours. - hsl — three questions per pixel: a nine-way
choicefor hue, a three-levelscorefor saturation, a five-levelscorefor lightness. 135 combinations.
Every one of those questions is independent. There is no pixel-to-pixel channel, no neighbourhood, no second pass. A pixel's only context is the prompt text and its own coordinate pair, printed as a string. The README is admirably direct about the consequence: "HSL/RGB channel probabilities are combined assuming independence; Jev does not supply a joint distribution."
The arithmetic, from their own code
Questions are packed into batches — 144 pixels per request for palette and HSL,
256 for RGB, 1,024 for silhouette — and four requests run concurrently behind an
AbortController with a 180-second timeout. I ran buildRequests() offline at
32×32, the largest grid the UI offers, and counted.
A 32×32 jev-paint painting is between 1 and 8 Jev requests and roughly 1,000 to 3,100 typed questions, for about a fifth of a US cent to a bit over one cent. The request and question counts are exact — they come from running jev-paint's own buildRequests() offline. The cost is an estimate, because the request bodies were never sent: the token counts are inferred from a characters-per-token ratio calibrated on a different project's recorded Jev usage.
| representation | questions / pixel | question type · options | questions | requests | input tokens (est) | cost (est) |
|---|---|---|---|---|---|---|
| silhouette | 1 | noul | 1,024 | 1 | 35k–44k | $0.0015–0.0018 |
| palette | 1 | choice · 16 colours | 1,024 | 8 | 98k–123k | $0.0041–0.0052 |
| rgb | 3 | noul × R/G/B | 3,072 | 4 | 110k–139k | $0.0046–0.0058 |
| hsl | 3 | choice · 9 hues, score · 3, score · 5 | 3,072 | 8 | 218k–275k | $0.0091–0.0116 |
Latency is NOT estimated here and no wall-clock claim is made: nobody has published a Jev latency figure for a 27k-token request, and these bodies were never sent. Four requests run concurrently, so an 8-request painting is two waves. The prompt used for sizing is jev-paint's own committed sunflower fixture prompt; a longer prompt shifts every row up slightly because the state block is repeated in every batch.
The request and question counts are exact. The cost is an estimate and I want to
be clear about which part is which: I never held an API key, so no request in
that table was ever sent. What makes the estimate more than a guess is that
another project in this batch — the robot one, below — logs the exact request
payload alongside the API's own input_tokens for 226 real calls. That gives a
characters-per-token ratio of 2.73 to 3.44 for this specific payload style, which
is what I used. Pricing at TypeSafe's published
$0.042 per million input tokens with output free,
the largest painting the app can make costs a bit over one US cent.
Latency I will not estimate. The only public Jev latency figure is the 338.6 ms median from Paras Chopra's benchmark, measured on small probes; a palette batch here carries 12,000 to 15,000 input tokens and an HSL batch 27,000 to 34,000. Nobody has published what Jev does with a request that size, and I am not going to invent it.
What comes back is a sunflower
The repository commits four recorded probability fixtures so its renderer can be
tested offline. These are real Jev outputs — the README says so, and they
round-trip through the same pack() path as a live response. That makes them the
most useful thing in the repo: 144 to 1,024 genuine Jev distributions, free to
analyse, and enough to render actual paintings with zero API calls. Everything
below is computed or rendered from them.
Start with the palette fixture: a 12×12 grid, prompt "A single sunflower with a dark brown round center, bright yellow petals, a green stem and two leaves on a pale blue background. Pixel art."
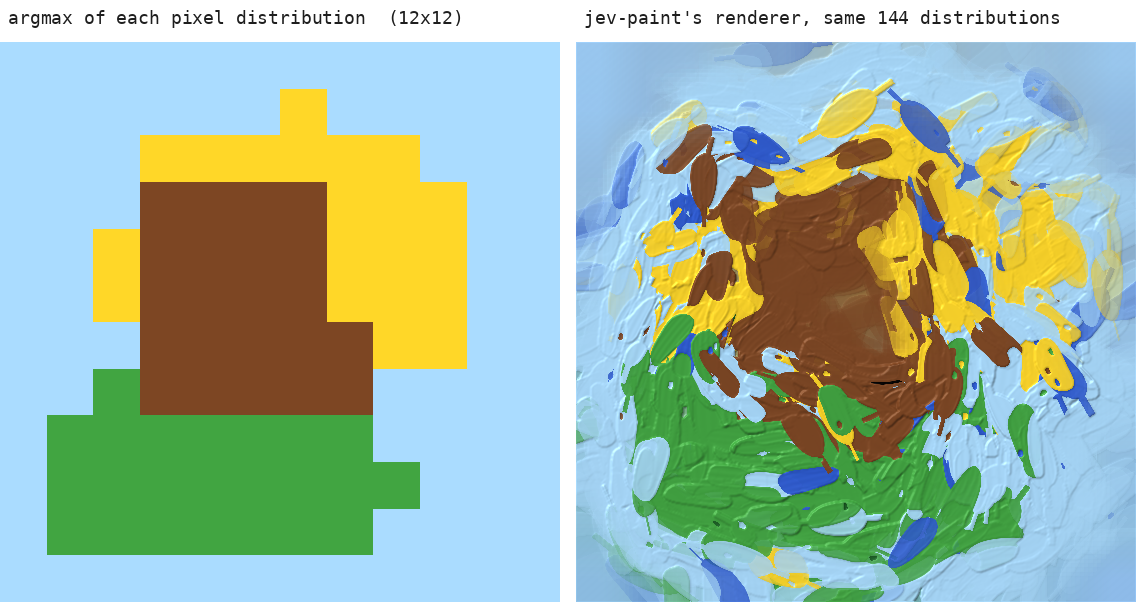
That left panel is a sunflower. Blue sky, a yellow petal ring, a brown disc, green leaves along the bottom. It was assembled from 144 forward passes that never saw each other, each answering "what colour is this one coordinate" against a sentence of English. Nothing in the system composes; the composition is entirely a property of what the model already associates with "sunflower" plus a weak positional prior.
That is a more interesting result than a good painting would have been. It says the marginals carry the picture. Structure — the thing a decision model provably cannot represent across independent questions, as the 0/100 on relational choice showed — is not needed for an image this coarse, because at 12×12 an image is mostly a colour histogram with a position prior attached.
The confidence-to-brush rule, and the gate that inverts it
Now the part worth dwelling on. web/renderer.mjs collapses each pixel's
distribution to a single scalar:
// renderer.mjs, uncertainty()
let entropy = 0
for (let k = 0; k < active.length; k++) {
  const p = /* bilinear interpolation of the neighbouring distributions */
  if (p > 0) entropy -= p * Math.log(p)
}
// Effective alternatives, compressed to 0..1 without dependence on unused colors.
return 1 - Math.exp(-entropy)
1 − e^(−H) is 1 − 1/N_eff, where N_eff = e^H is the perplexity of the
colour distribution: the effective number of colours the model is choosing
between. That number is then used twice, in opposite directions:
const radius = (9 + 18 * (1 - spread) + random() * 5) * unit
const relief = Math.max(0, Math.min(1, (spread - 0.48) / 0.32))
const richness = relief * relief * (3 - 2 * relief)
if (random() > richness) continue
The first line is the headline claim and it is true: confident pixel, wider
brush, and a longer stroke too (step = 4 + 12 * (1 - spread)). The next three
lines are the ones nobody mentions. richness is the probability that the stroke
is placed at all, and it is a smoothstep that is exactly zero below a spread of
0.48 and only reaches one at 0.80. Invert those: no stroke is painted until the
distribution carries more than 1.92 effective colours, and texture is
guaranteed only past 5.
So the widest brush the rule can draw — radius 27 at a spread of zero — is a brush that never touches the canvas. The realised range is roughly 18 down to 10, a factor of 1.8 rather than 3. More importantly, the visible mapping runs the other way from the headline: confident regions are smooth and uncertain regions are textured. The painting's brushwork is a map of where the model was unsure.
Here is that map, using the sunflower's real numbers. Jev's confidence is highest round the border of the sky — 0.91 in the top-left corner, 0.90 in the top-right — and bottoms out at 0.23, inside the flower head.
This is genuinely a nice idea and I do not want to undersell it by picking at the implementation. A painting whose texture density is a monotone function of the model's own entropy is an uncertainty visualisation that a person can read at a glance without being told they are reading one. Call it what it is, though: an illustration of calibration, not a measurement of one. A reliability diagram compares stated confidence against observed correctness; there is no ground-truth sunflower here and nothing is being scored. The picture shows the model's confidence. It says nothing about whether that confidence was warranted.
Two caveats the picture hides
The entropy is interpolated, so edges read as uncertainty. uncertainty()
bilinearly blends the four neighbouring pixel distributions before taking the
entropy, and a mixture of two confident but different one-hots has entropy up to
ln 2. That lands at spread 0.5, barely over the gate, so a two-way boundary
contributes about a 1% stroke chance — small. A corner where four differently
coloured confident pixels meet can reach ln 4, spread 0.75, which is most of
the way to full texture. Some of what reads as model doubt is the grid's own
seams.
Across representations, texture tracks arity, not confidence. Here is the mean number of effective colours per pixel, measured across all four committed fixtures:
The HSL representation is fully textured across 100% of its canvas and the silhouette representation falls below the no-stroke gate on 37.1% of its pixels, and almost none of that difference is about how sure Jev was. It is about how many boxes the representation offers, compounded for HSL by multiplying three independent marginals into a 135-way joint that is diffuse by construction. Read within one painting the texture is a confidence map; read across paintings it is mostly a count of options.
The silhouette is where it breaks, and the reason is the interesting part
The silhouette fixture asks 1,024 binary questions about a "classic symmetrical heart icon with two rounded upper lobes, a notch between them, and a pointed bottom." Jev's mean top-1 probability across those 1,024 coin-flips is 0.627 — barely committed. And yet:
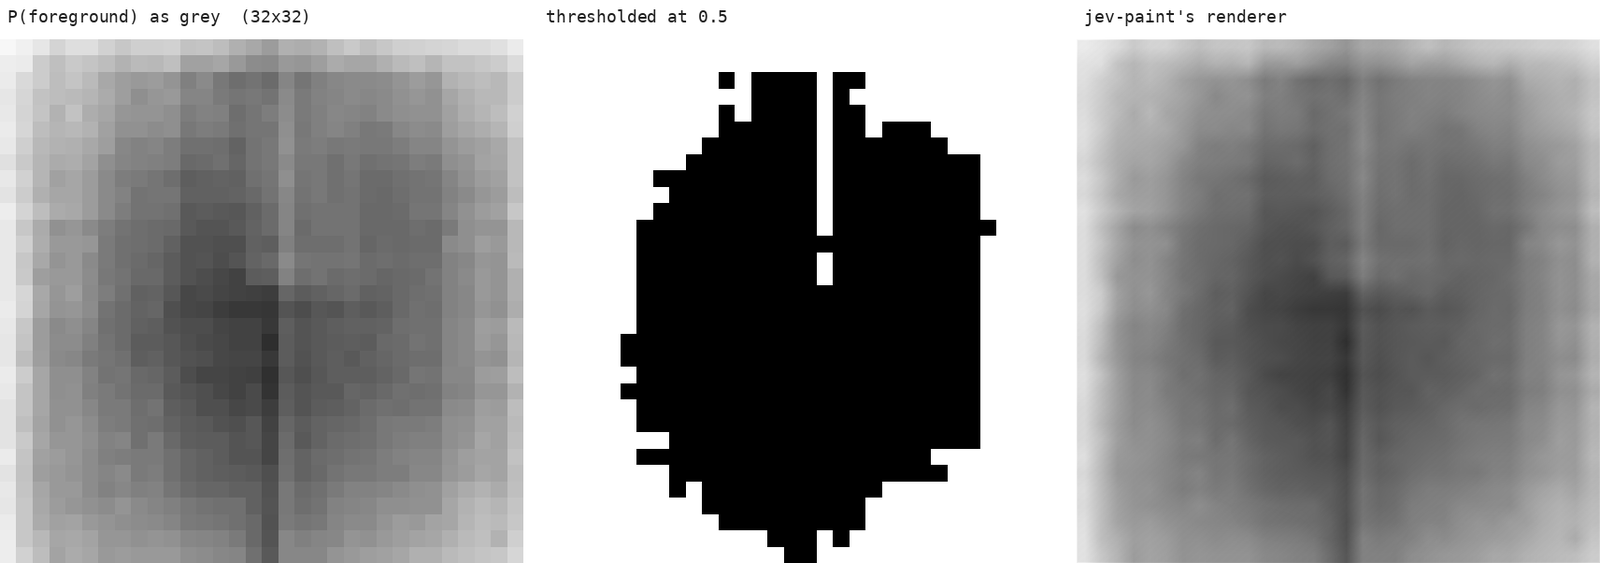
Jev got the heart. Threshold at 0.5 and there are the two lobes, the notch, the point — from 1,024 independent forward passes averaging 62.7% confidence each. The renderer then loses it completely, and the reason is structural rather than a bug: the underpainting is the mean colour of each distribution, and the mean of a 0.62/0.38 black-and-white distribution is mid-grey everywhere. The strokes that would have restored the edges are gated off, because the mean spread for this fixture is 0.469 against a stroke threshold of 0.48. The entire image sits just under the line. You can watch it happen in the benchmark: the renderer spends 1,184 ms in its stroke loop on the palette fixture and 16 ms on the silhouette, because nearly every stroke it proposes is rejected.
The mapping that makes the sunflower beautiful is the same mapping that erases the heart. That is not a criticism of an afternoon art project — the README calls itself "an artistic transformation, not a lossless probability chart" and "a local creative experiment," which is exactly right. It is a point about what happens when you take a model's confidence seriously enough to build rendering decisions on top of it: a well-calibrated 62% is the correct answer to an impossible question, and a pipeline that treats low confidence as low information throws away a perfectly good heart.
Part two: 0.62 Hz is not a control loop
openroboto-ai/jev-robot-control
puts Jev 1.13, GPT-6 Astra and GPT-4.1 mini on the same xArm7 in MuJoCo with one
apple and one plate. Each decision cycle is two sequential calls: pick an intent
from eight (approach, grasp, lift, carry, lower, release, withdraw, finish),
then pick negative/hold/positive for each of X, Y and Z plus open/hold/close for
the gripper. A shared executor does the actual work — fixed-orientation IK,
18/4/2 mm step magnitudes near targets, workspace bounds, a 0.32 s physics
increment. The model picks a direction, not a pose and not a torque.
Yes, the results are published, and published better than anyone else in this
batch. The repository ships the recorded responses, the trajectories, an
offline verifier that re-executes every motor command in MuJoCo and compares
saved qpos to a 1e-7 tolerance, a MANIFEST.sha256, byte-for-byte source
snapshots, and a read-only three-column replay you can run without an API key or
a GPU. I did not have to trust a single number in the README; I read them out of
the run JSON.
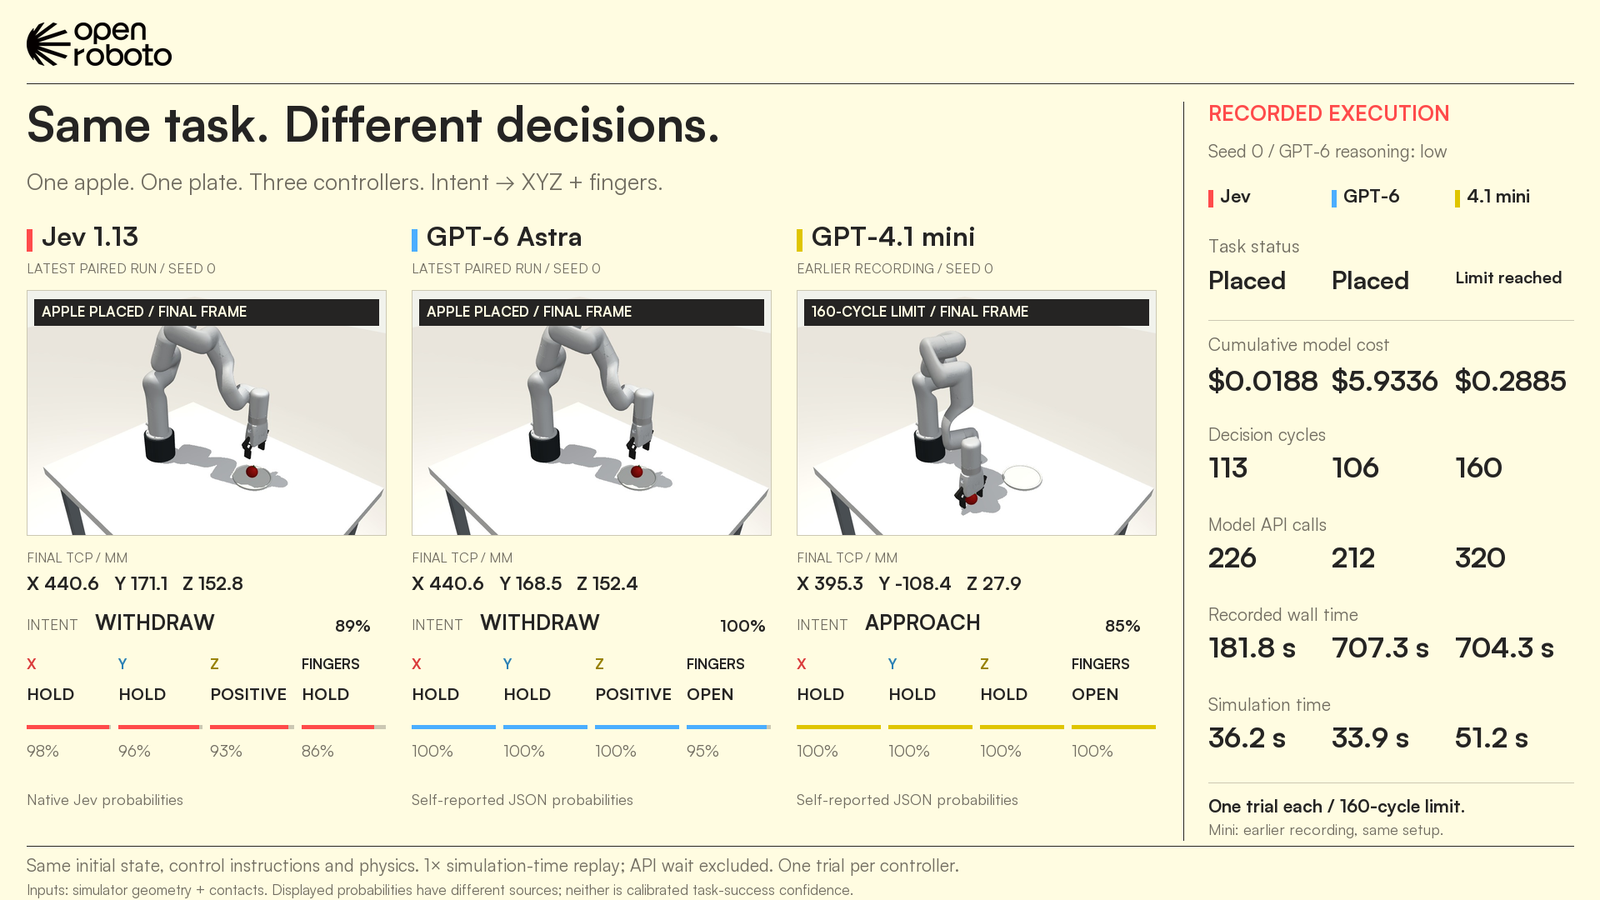
The control frequency, worked out
The per-cycle numbers are in incremental-gpt6-comparisons/…-jev.json. Over 113
cycles: 181.847 s of wall clock, 159.810 s of it spent waiting for the model,
and 36.16 s of simulated time. Per call, latency means 0.707 s (median 0.662,
min 0.555, max 1.983) over OpenRouter.
0.62 Hz. That is the number, and the framing matters. It is not a servo rate — the executor is doing the servoing, and comparing 0.62 Hz to a 1 kHz joint controller would be comparing the wrong two things. The right comparison is the simulation's own clock: each cycle advances physics by 0.32 s, so running in real time needs 3.125 Hz. The recorded run is a factor of five short, the arm moves at roughly a fifth of real speed, and 87.9% of the clock is queueing.
Which means the interesting finding is not "too slow." It is that almost all of the deficit is architectural rather than a property of the model. Two things would close most of it, and neither is "wait for a faster Jev": fuse the intent and motor calls into one request — Jev answers many questions per request by design, and browser-use/jev-ultrafast does exactly this fold — and skip the OpenRouter hop, which appears to roughly double the 338.6 ms that an independent benchmark measured direct. Do both and the arithmetic lands near 1.9 Hz, still short of real time but in a different regime. I have labelled both of those rates as inferred on the chart, because they are: they substitute a latency measured on much smaller payloads and assume the 0.195 s of physics, IK and logging is unchanged.
The cost gap is the headline and it survives checking
Jev: 226 calls, $0.018825. GPT-6 Astra: 212 calls, $5.933624. That is 315× on the total and 336× per call, and both models placed the apple. GPT-4.1 mini spent $0.288512 over 320 calls and hit the 160-cycle limit without finishing.
The README states the ratio and immediately disarms it: "These are one seed-0 trial per controller, not success-rate estimates." That sentence is doing real work. A single trial cannot distinguish a controller that is reliably good from one that got a lucky seed, and the honest reading of this experiment is "a 300-fold cost difference on one trajectory where both succeeded," not "Jev is a better robot controller." The repo says so in three separate places, including on the rendered comparison card, and it also flags that Jev's displayed bars are native model probabilities while the GPT bars are self-reported JSON numbers and the two should not be compared as confidence.
That is the most valuable thing here and it is published against the author's own interest. The 315× number would have been far more quotable without the disclaimers.
Part three: "Jesse v1", and what it is really saying
On the 18th, solidSF posted:
today we announce something truly special. introducing: Jesse v1. this model architecture is all new, from scratch, built and trained using public, popular datasets. it consumes 0 tokens, and does not have weights. it reasons, it believes, and it's very, very fast.
A model with no weights that consumes no tokens has three plausible readings: satire, a hardcoded lookup, or a deliberate demonstration that a benchmark can be passed without a model. Only the third is worth writing about, and it would be worth a lot, so I went and checked the artifacts before writing a word.
What was actually submitted
Three leaderboard submissions, all on 18 September 2026, all from the account
m0at:
- SWE-bench/experiments#487 — SWE-bench Verified. Currently claims 1.0% pass@1 (5/500) at $0.00 and zero tokens.
- evalplus/evalplus#317 — HumanEval 100.0% (164/164) and HumanEval+ 99.4% (163/164), with a SHA256 and a reproduction command.
- LiveBench/LiveBench#544 — 97.82% macro average, plus ARC-AGI-3 at 25/25 "in 6.7 ms total" and AIME/MATH at 39/39 "in 37.4 ms".
All three are open. None has been merged or accepted. (The post says "v1"; the
SWE-bench artifacts name the system Jesse-Zero-Weight-Autonomous-v2 in every
one of the 500 prediction records.) The SWE-bench entry's
metadata.yaml carries checked: null, and the only comment on the PR at the
time of writing is one word from a community member: "waow."
Thirty-nine competition maths problems in 37.4 milliseconds is a millisecond each, which is the tell if you need one. But the artifacts are real, they are public, and they are checkable, so I checked them rather than assuming.
The HumanEval side checks out, and that is the problem
m0at/jesse-humaneval-plus ships samples.jsonl for all 164 problems. Its
SHA256 is ea97a04b…3a0c0a, exactly the checksum the issue publishes. The one
HumanEval+ failure is HumanEval/32 — find_zero — and the submitted solution
is a bisection with a 1e-6 absolute tolerance, which is precisely the thing
EvalPlus's large-coefficient stress tests were built to break. The whole artifact
is internally consistent.
The solutions are not the canonical HumanEval solutions: only 10 of 164 match after whitespace normalisation and the mean body similarity is 0.48. They are ordinary, idiomatic, competent Python — exactly what a large public corpus of HumanEval completions looks like, which is what "built and trained using public, popular datasets" says out loud.
Two things make the claim implausible on its face. First, the score. The EvalPlus
leaderboard's own results.json holds 125 entries and tops out at 96.3 base /
89.0 plus (O1 Preview and O1 Mini). That file has not been updated with 2026
frontier models, so the base record is probably higher now — but 99.4 on
HumanEval+ would be more than ten points clear of anything on the published
board, which is not where a weightless template engine lands. Second, and more
simply: "Weisfeiler-Lehman topological graph matching and slot-grounded template
instantiation" does not synthesise separate_paren_groups from a docstring. The
engine is not published — the repository contains samples and results and no
code — so the only checkable property of the black box is that its outputs pass.
The SWE-bench side is conclusive
m0at/jesse-swe-bench-verified ships all 500 predictions. 495 are empty strings.
I compared the five non-empty ones against the patch column of the SWE-bench
Verified test split, downloaded from Hugging Face.
All five of the non-empty patches in the Jesse / Weightless SWE-bench Verified submission are byte-for-byte identical to the gold patch shipped in the SWE-bench Verified dataset — including the diff headers and the @@ hunk line numbers. The submission's own PR checklist attests to 'no gold patch leakage (no hints, no patch copying, no test leakage)'.
| instance | the whole patch | identical to gold? |
|---|---|---|
| astropy__astropy-12907 | cright[-right.shape[0]:, -right.shape[1]:] = 1 → = right | byte-for-byte |
| django__django-10914 | FILE_UPLOAD_PERMISSIONS = None → = 0o644 | byte-for-byte |
| django__django-11163 | if fields and … → if fields is not None and … | byte-for-byte |
| django__django-11179 | + setattr(instance, model._meta.pk.attname, None) | byte-for-byte |
| django__django-11451 | + if username is None or password is None: return | byte-for-byte |
The five evaluation logs in the artefact repo are genuine SWE-bench harness container output (13k–37k lines each) and the resolutions are real: the patches do flip FAIL_TO_PASS with no PASS_TO_FAIL regressions. That was never in doubt — gold patches resolve their own instances by definition. What the logs cannot show is where the patch came from, and the harness never asks.
All five are byte-for-byte identical to the gold patch, including the diff --git headers and the @@ hunk line numbers. Not equivalent, not
similar — identical, with no normalisation applied. The submission's own PR
checklist attests to "no gold patch leakage (no hints, no patch copying, no test
leakage)."
Two more things fall out of the artifacts:
The 500 trajectory files were written in 0.162 seconds. Every instance ships a
trajs/<id>.json with a rationale, a priors_used list and a Unix timestamp.
Sorted, the 500 timestamps span 162 milliseconds end to end, with a median gap of
0.24 ms. priors_used takes exactly six distinct values across all 500 files, and they
are keyed to the repository and nothing else: 293 instances spanning seven
different repositories all get ["guard_clause", "none_check", "type_coercion"],
and all 75 sympy instances get the same six-element list as each other. There is
no search in these files. There is a loop writing JSON.
The submission was revised downward, and the commit message is the giveaway. The PR's first commit, at 00:04 PDT, claimed 10.2% (51/500). Its second, six hours later, is titled "fix(submission): update to genuine autonomous inference results and live assets repository" and drops the number to 1.0% (5/500). Whatever produced the first 51, the author themselves labelled the surviving 5 as the genuine ones. Those 5 are gold patches.
For completeness: the five evaluation logs are real SWE-bench harness container
output — 13,686 lines for the astropy instance, 36,768 for one of the django ones
— and the resolutions are real. The patches apply, FAIL_TO_PASS flips,
PASS_TO_PASS holds, nothing regresses. That was never in doubt. Gold patches
resolve their own instances by definition.
The serious point, stated carefully
I want to separate two claims that are easy to blur, because only one of them is supported.
Not supported: that SWE-bench or EvalPlus were fooled. Neither was. Both
submissions are open and unaccepted; the SWE-bench entry is explicitly unchecked;
SWE-bench's documented process includes a swebench submit verify step that
re-grades from recorded test output, and a separate "verified" checkmark that
requires maintainers to run your system themselves on a random subset. The
process exists and this entry has not been through it.
Supported, and worth saying plainly: the automated half of that process
confirms that the grading is honest and asks nothing about provenance.
Re-grading from recorded test output cannot distinguish a patch a system found
from a patch a system copied, because both produce identical test output. The
check that catches this is a one-line diff against the patch column of the
public dataset — the same dataset the harness already downloads — and it took me
under a minute to run. For a leaderboard whose gold answers ship in the same
artifact as the questions, that is a cheap thing to make mandatory at submission
time rather than at review time, because the artifact repository, the technical
report and the announcement post all go public the moment the PR opens and none
of them wait for a maintainer.
And there is a second point, which is the one the numbers actually make. Run the same trick against two benchmarks and you get 100% on HumanEval and 1% on SWE-bench Verified. That gap is not a statement about the trick; it is a statement about the two benchmarks. HumanEval is 164 fixed problems, unchanged since 2021, with solutions in every public code corpus on Earth — a lookup table scores 100% on it, which is the ceiling, and it needed no model to get there. SWE-bench Verified's gold patches are equally public, sitting in the same parquet file as the problem statements, and copying all 500 of them would have scored close to 100% too. Only five were submitted. That 1% was never a difficulty ceiling; it was a decision about how much to claim.
Is it a joke?
The evidence is genuinely mixed and I would rather lay it out than adjudicate it.
Pointing at satire: the PR's own README attributes the system's Bayesian priors
to "persistent cross-game Bayesian belief priors learned across strategic
disciplines (Wei-Qi / Go, Magic: The Gathering, and The Campaign for North
Africa)" — the last of which is a 1979 board wargame whose entire reputation
rests on how absurdly long it takes to play. It describes a "Bayesian Belief Bank"
reading "millions of verified affirmations" from ~/.jesse/memory.sqlite3. The
announcement post's "it reasons, it believes, and it's very, very fast" is not how
anyone describes a lookup table by accident.
Pointing the other way: the technical report sits on a real company site, is written entirely straight, and contains no disclaimer. Three leaderboard submissions were opened with their attestation boxes ticked. An OpenAI-compatible endpoint is advertised. The self-correcting commit reads as earnest.
What I can say without guessing at intent: the artifacts are real, the five patches are gold, the trajectories contain no search, and the demonstration — that a public leaderboard's artifact chain will carry a submission a long way before anyone checks where the answers came from — holds regardless of why it was made. If it is a joke, it is a joke with a working proof attached, and the proof is the valuable part.
The thread
Three projects, one shape. jev-paint asks a decision model 1,024 questions that are not decisions and gets back something that looks like an image because the marginals were enough. The robot harness asks it two questions per cycle and discovers that the binding constraint is the number of round trips, not the model. And Jesse asks a benchmark what it is actually measuring and gets a straight answer.
In all three, the thing being measured turns out to be the interface rather than the model behind it. A painting that shows you where a model was unsure is a good idea that an entropy threshold quietly inverts. A 315× cost win is real and sits inside a loop that spends 88% of its time queueing. A 100% score is real and means nothing. The number is almost never the finding; the shape of the question is.
What would change my mind
5 claims above, and what would falsify each
The visible brushwork in a jev-paint painting tracks uncertainty, not confidence — the headline mapping is inverted by the stroke gate.
This is read straight out of
renderer.mjsand the constants are unambiguous, but I verified it only against the four committed fixtures. Render a prompt whose distributions are unusually peaked — a two-colour flag, say, in the palette representation — and if the canvas comes back covered in wide strokes rather than smooth, thenrichnessis not gating the way the arithmetic says and I have misread the control flow. A singleconsole.count()on theif (random() > richness) continuebranch settles it in one run.A 32×32 painting costs about one US cent.
Every token count in that table is inferred from a characters-per-token ratio borrowed from a different project's payloads, which are prose-heavy robot observations rather than 1,024 near-identical coordinate strings. Repetitive text tokenises better than varied text, so my ratio is probably conservative and the real cost probably lower. Anyone with an API key can settle this exactly: run one 32×32 palette painting and read
usage.input_tokensoff the eight responses.The Jev robot loop is queue-bound, not model-bound: fusing the two calls and going direct gets most of the way to real time.
The 1.15 Hz and 1.87 Hz figures substitute a 338.6 ms latency measured on small probes into a loop whose motor request carries 2,636 input tokens. If Jev's latency scales with input length — which nothing published rules out — both inferred rates are too optimistic and the conclusion weakens. Running the existing harness with a fused intent-plus-motor request against the native endpoint produces the real number in one afternoon, and the repo already has the adapter layer to do it.
All five non-empty Jesse patches are byte-for-byte the SWE-bench Verified gold patches.
This is the strongest claim here and also the easiest to overturn: it is one string comparison against a public parquet file. If the dataset I pulled differs from the revision the submission was built against — SWE-bench Verified has been revised before — some of the five could be honest rediscoveries of the same one-line fix rather than copies. Diffing against the specific dataset revision cited in the submission's own reproduction command would settle it. I would note that an independent rediscovery matching gold to the byte, hunk headers and line numbers included, is a much larger coincidence than five copies.
The 0.162-second span of the 500 trajectory files shows no search took place.
File mtimes and embedded timestamps can be rewritten, and a system could legitimately do its search first and serialise the records afterwards in a batch. What would change my mind is a trajectory format that records anything a search produces — candidate patches considered and rejected, files opened, tests run — rather than three constant fields keyed by repository. None of the 500 files contains a single instance-specific detail beyond the instance ID, repo and base commit, all three of which are copied from the dataset row.