2026-07-10 · 12 min · inference · mixture-of-experts

Why read this
Solidtop 85%How Colibri runs a 744B MoE in 25 GB of RAM by streaming experts from 370 GB of NVMe, why it is disk-bound, and the community speeds from 0.08 to 6.8 tok/s.
- Runs on a laptop CPU
- A lasting reference
- A new technique
Inference & servingApache-2.0Practitioner tool
How this was scored
- Is it new?
- 2 of 3: A real new idea, method or capability
- Can I trust it?
- 1 of 3: Spot-checks a few numbers
- Can I run it?
- 2 of 3: Open code or weights with real limits
- Will I understand it?
- 2 of 3: Mechanism from first principles with figures
- Can I act on it?
- 2 of 3: A concrete recipe, numbers or comparison
- Will it last?
- 2 of 3: A reference for a year or more
- Does it affect many?
- 1 of 3: A specialist community
- Only here?
- 1 of 3: Some original analysis
Score 56 of 100, ranked 398 of 577 rated articles. Each question is answered 0–3 by hand, and a 3 is rare. How articles are scored
GLM-5.2 is a 744-billion-parameter model — backbone-only; counting its multi-token-prediction layer it is 753B, which is why some write-ups quote that instead. Loaded the normal way, its weights want hundreds of gigabytes of fast memory — data-center territory. Colibri is a single-file, pure-C engine, zero external dependencies, that runs that same model on a consumer machine with about 25 GB of RAM. Not a distillation, not a smaller sibling — the full 744B checkpoint, answering correctly, on a box that costs less than one H100's cooling fan.
Before the "how," the honest headline: this is a feasibility feat, not a usable-speed setup. Cold, Colibri decodes at roughly 0.05–0.1 tokens per second — that is 10 to 20 seconds per token. Warm, with every trick engaged, the best real community result is about 0.37 tok/s, still ~3 seconds per token. And "25 GB of RAM" is only true if you also have ~370 GB of fast NVMe for the experts. Keep both numbers in the same sentence or the claim is misleading.
Why this is even possible: extreme sparsity
Colibri does not compress 744B parameters into 25 GB. It exploits the fact that, at any moment, almost none of those parameters are doing work. GLM-5.2 is a Mixture of Experts: each MoE layer holds 256 experts, but a router picks only a small top-k of them per token. Across the model, only about 40B of the 744B parameters activate for a given token, and of those, only ~11 GB of weights actually change from one token to the next — the routed experts. Everything else (attention, shared experts, embeddings — the "dense" ~17B) is used on every token.
That split is the whole design. Split the model by how often each piece is touched:
- The dense core (~17B params) is touched every token → keep it resident in RAM, int4-quantized to ~9.9 GB.
- The routed experts (21,504 of them: 75 MoE layers × 256, plus the MTP head, ~19 MB each at int4) are touched rarely and unpredictably → leave them on disk (~370 GB) and fetch only the handful a token actually routes to.
The second enabler is quantization. The original FP8 checkpoint is ~756 GB; Colibri's offline converter requantizes it to int4 (the experts) so the dense core fits in ~9.9 GB of RAM and the expert store shrinks to ~370 GB on disk. Sparsity says you rarely need most experts; quantization says the ones you do need are small enough to stream. You need both.
The three-tier memory, made visible
So the memory hierarchy has three tiers: the int4 dense core resident in RAM, an LRU cache of hot experts in RAM, and the full expert store on disk. When the router picks an expert, one of two things happens. If that expert is already in the RAM cache (or pinned), it is a hit — served at memory speed. If not, it is a miss: a disk read of ~19 MB that sits on the critical path of that token. The token cannot finish until the bytes arrive.
Route a token through one MoE layer and watch it resolve. Scrub the token, resize the cache, toggle hot-expert pinning, and watch the LRU fill and evict:
This is the entire performance story in one picture. The router picks its experts; the cache absorbs the ones you keep re-using; everything else is a disk fetch. A cold token — nothing cached — reads about 11 GB from disk (75 layers × ~8 experts × ~19 MB). At a typical NVMe rate of ~1 GB/s, that read alone is ~10 seconds, which is exactly why cold decode lands at 0.05–0.1 tok/s. Decode is disk-bound, not compute-bound: the CPU sits waiting on I/O. This is the same memory-wall intuition as ordinary LLM inference, pushed to its limit — except the "memory" the decode waits on is a spinning queue of NVMe reads instead of GPU HBM.
Colibri softens the disk with the usual systems tricks: an LRU cache so repeat experts stay hot, an
async readahead that reads the next block of experts while the current one is still multiplying (so
compute and I/O overlap), the OS page cache acting as a free second-level cache, and a RAM safety
budget — the cache is auto-sized from MemAvailable at startup so it fills spare memory without ever
triggering an OOM kill. None of these change the physics of a cold miss; they just make misses rarer.
Budget the RAM and the disk together
Because the "25 GB" number is the seductive, misleading one, it is worth drawing to scale. On a 25 GB machine the resident footprint is the 9.9 GB int4 core plus an auto-sized LRU expert cache plus a safety headroom — and the 370 GB of experts sit on disk, roughly 15× larger than the entire RAM. Slide the cache size and see how little of the model is ever in memory at once:
That 15× gap is the point. Colibri did not shrink GLM-5.2 to fit in RAM; it arranged for only the in-use ~4% to be in RAM at any instant, and made disk the backing store for the rest. Take away the fast NVMe and there is no engine — which is why quoting the RAM figure without the disk figure sells a fiction.
Buying speed back: warm cache, MTP, and pinning
Cold decode is the floor, not the experience. Three things stack on top of it, and it is worth being precise about what each one is.
A warm cache is just locality: real prompts re-route to the same experts, so after a few tokens the
hottest experts live in RAM and the miss rate drops. Pinned hot experts make that permanent — Colibri
records which experts your usage actually routes to (a .coli_usage file) and pins the hottest ones in
spare RAM, so the engine literally gets faster the more you use it.
MTP is the subtle one. GLM-5.2 ships a native multi-token-prediction head — a lightweight draft model that proposes several future tokens, which the main model then verifies in one batched forward. Colibri runs it natively at int8 (this matters: at int4 the draft head's predictions are so degraded that acceptance collapses to 0–4% and speculation never engages; at int8 it reaches ~39–59% acceptance, community-measured). The payoff is 2.2–2.8 tokens per forward — but note that is a speculation/acceptance rate, the number of tokens you get out of one main-model pass, not tokens per second. It amortizes the fixed per-forward cost; it does not make the disk faster. On a cold cache MTP can even be a net loss, because verifying extra draft tokens routes to more experts (~660 → ~1100 expert-loads/token) — so speculation only pays once the cache and pins are warm.
Stack them, and honestly label which rungs are measured versus an illustrative split:
The endpoints are real community numbers; the per-factor decomposition in the middle is illustrative (Colibri's README reports the endpoints, not the split). The takeaway is the seconds-per-token column: the best result available when this was written, 0.37 tok/s on a Ryzen AI 9 Framework 13 with a warm cache, MTP and pinning, is still about one token every three seconds. (That ceiling has since moved a long way — see what changed — though the streaming floor has not.) A different community machine — an M5 Max with 128 GB of RAM — reaches 1.06 tok/s, but only because far more RAM lets far more experts stay resident, which just confirms the thesis: the disk is the bottleneck, and RAM buys you out of it.
Colibri is the engine, not the model
Keep the two things distinct. GLM-5.2 is the model — the 744B MoE, its routing, its MTP head, its training. Colibri is an engine that runs that model's forward pass in pure C on tiny hardware. The cleverness is entirely in the systems layer: how to lay out weights on disk, when to read them, what to cache, how to overlap I/O with compute, how to quantize the head so speculation survives. It reimplements GLM-5.2's forward pass faithfully — MLA attention with a compressed KV cache (~57× smaller than dense), DeepSeek-V3-style routing, native MTP — but adds nothing to the model's capability. Same weights, same answers; the contribution is fitting them onto a laptop.
What changed since July
The version of Colibri this article was written against was a single-file C engine that ran one model. Six weeks later it is a different kind of project, and three of the changes bear directly on the argument above.
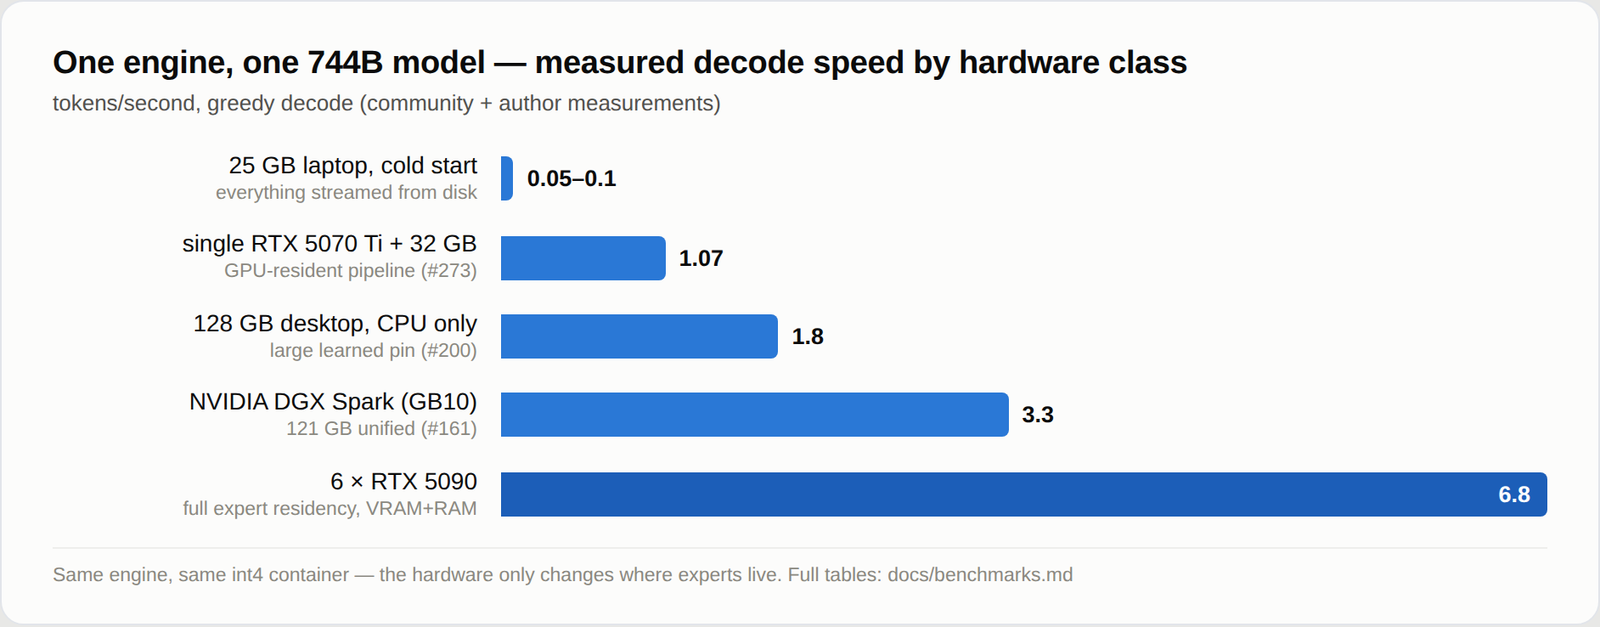
The ceiling moved a long way; the floor did not. The repo now reports 5.8–6.8 tok/s on 6× RTX 5090 with full expert residency (TTFT ~13 s), ~1.8 tok/s on a 128 GB CPU-only desktop, and 1.07 tok/s on a single RTX 5070 Ti. The 25 GB dev box is still 0.05–0.1 tok/s cold, described in the README as "the proven floor where this project started, and still the honest baseline."
Read that ladder carefully, because it does not contradict the thesis — it confirms it. Every rung is bought with memory. The six-GPU number is what happens when the experts stop being streamed at all, at which point Colibri is no longer doing the interesting thing; it is a competent C inference engine on hardware that did not need the trick. The interesting regime is still the bottom of that ladder.
Two drives instead of one. The most direct attack on the bottleneck: put a second copy of the model on a second SSD and read from both.
And a research posture that is rarer than any of the engineering. The README now carries a table of open hypotheses with, for each, the evidence so far and the experiment still needed — and the framing is explicit: "Colibrì treats an optimization as a hypothesis until a controlled end-to-end A/B shows otherwise." Contributors are asked to record hardware, commit, exact command, cache state, expert hit rate, bytes read and quality check, change one variable, and publish the negative results too. The line I would put on a poster: "A well-controlled failure is more valuable here than an unexplained fast number."
That posture produces the single most useful correction to this article. The MTP section above says speculation only pays once the cache is warm. The repo now has a number for the other end: MTP has measured a 32% loss at around 85% expert hit rate, listed as an open problem with "map the break-even surface" as the required experiment. So it is not monotone — speculation loses when the cache is cold and can lose again near residency, and the profitable band in between has not been mapped. That is a sharper and less comfortable claim than the one I made in July, and it comes from the project reporting against itself.
Two smaller things worth knowing. O_DIRECT is documented as drive-dependent rather than a universal win. And the engine now spans CPU, CUDA, Metal and NUMA placement in one runtime, with the honest caveat attached — a fast CPU and low residency can erase the GPU wins entirely.
The take
Colibri is a lovely demonstration of a real principle: a sparse MoE's active footprint, not its parameter count, is what a runtime has to hold in fast memory. Because GLM-5.2 fires only a few of its 256 experts per layer per token, and because int4/int8 quantization shrinks both the resident core and each streamed expert, the working set collapses from hundreds of gigabytes to ~10 GB of RAM plus on-demand disk reads. That is genuinely clever, and it is pure C with zero dependencies, which makes it a beautiful object to read.
But be clear-eyed about what it buys. It buys access, not speed: you can hold a conversation with a 744B frontier model on a 25 GB machine, at the pace of a few seconds per token, provided you also own a 370 GB fast disk. The bottleneck is not going away — it is the physics of pulling ~11 GB across NVMe for every cold token — and the caching, pinning and speculation only push against it. As an existence proof that extreme sparsity plus aggressive quantization can put a frontier model on consumer hardware, Colibri is compelling. As a way to actually use one at interactive speed, it is not there, and it is refreshingly honest about that.
Built from the Colibri repository (JustVugg; Apache-2.0) and its README. All throughput and hardware figures are community-reported single test cases, not official benchmarks: cold ~0.05–0.1 tok/s and MTP 2.2–2.8 tok/forward on the dev machine; 0.37 tok/s (Ryzen AI 9, Framework 13), 1.06 tok/s (M5 Max, 128 GB), 0.11 tok/s (Core Ultra 7, 24 GB) from community runs. Architecture figures — 744B total, ~17B dense, 9.9 GB int4 core, 21,504 experts, ~370 GB on disk — are from the repository README. The interactive diagrams are illustrations of the mechanism, not measurements.