2026-07-08 · 8 min · vector-search · quantization · retrieval
Why read this
Nichelast 15%Explains HNSW descent and quantize-then-refine behind zvec's embedded vector search, and why its 8,475 QPS is not a like-for-like comparison.
- Runs on a laptop CPU
- Explained from first principles
Developer tools & infraApache-2.0Practitioner tool
How this was scored
- Is it new?
- 0 of 3: Repackaging or news of a known thing
- Can I trust it?
- 0 of 3: Restates claims
- Can I run it?
- 3 of 3: Open, permissive, runs on reader hardware with instructions
- Will I understand it?
- 2 of 3: Mechanism from first principles with figures
- Can I act on it?
- 1 of 3: General advice
- Will it last?
- 1 of 3: Relevant for months
- Does it affect many?
- 1 of 3: A specialist community
- Only here?
- 0 of 3: Same as the press release
Score 33 of 100, ranked 558 of 577 rated articles. Each question is answered 0–3 by hand, and a 3 is rare. How articles are scored
zvec is Alibaba's open-source (Apache 2.0, Tongyi Lab) in-process vector database — it links into your app as a library instead of running as a server. The pitch is "SQLite for vectors": no cluster, no network hop, one embedded engine that does approximate nearest-neighbour (ANN) search over embeddings. The core is C++ (built on Proxima, Alibaba's older vector-search engine), with SDKs for Python, Node.js, Go, Rust, and Dart/Flutter and builds for Linux (x86_64/ARM64), macOS (ARM64), Windows, and Android.
The headline number is a throughput claim: on VectorDBBench's Cohere 10M set (10M vectors, 768-d) a 16-vCPU / 64-GiB instance serves 8,475 QPS, roughly 2× the next-fastest entry on that board. That is the top bar in the cover figure. Two mechanisms do the work, and neither is unique to zvec — they are the two levers every fast ANN index pulls. This post explains both from first principles, then puts the self-reported numbers up in full.
Why nearest-neighbour search is hard
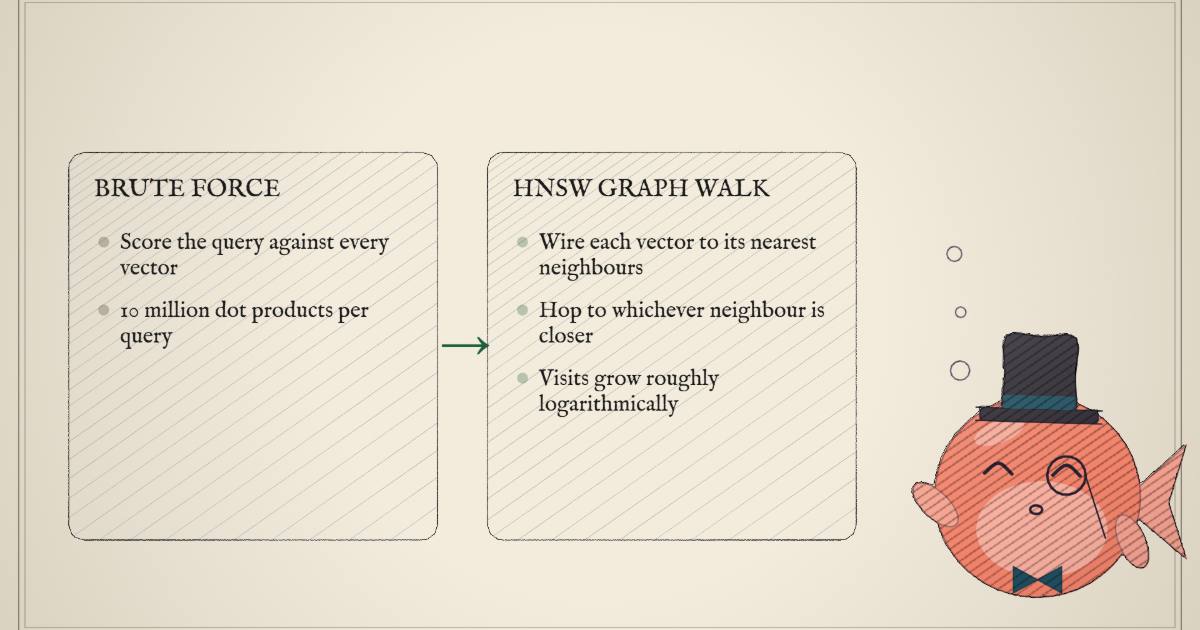
The naive query is brute force: score the query vector against all stored vectors, keep the top-. That is distance computations per query. At and 768 dimensions, each query touches ten million dot products — correct, and far too slow to serve at thousands of QPS.
The standard fix is a graph index. zvec's default is HNSW (Hierarchical Navigable Small World): wire every vector to its nearest neighbours, then answer a query by walking the graph — start somewhere, repeatedly hop to whichever neighbour is closer to the query, stop at a local minimum. You compute distances only to the nodes you actually visit, and that count grows roughly logarithmically with , not linearly. Step through one descent:
That is the first lever: visit fewer vectors. The graph decides which candidates to score. It trades a small, bounded loss in recall (you can land on an approximate neighbour, not the exact one) for skipping the overwhelming majority of the dataset. ef-search is the knob — a larger search frontier means more nodes visited, higher recall, lower QPS. The benchmark run uses --ef-search 118 with --m 50 (m = neighbours per node in the graph).
Quantize to make each score cheap
The graph decides how many distances you compute. Quantization decides how expensive each one is. A 768-d fp32 vector is 3072 bytes; scoring it is a 768-wide float dot product. Compress it and both the memory footprint and the per-distance cost drop:
- int8 (scalar quantization) — 768 bytes/vector, a 4× shrink. Distances become int8 dot products with a tiny quantization error. This is what the headline run uses.
- int4 / fp16 — zvec also exposes 4-bit and half-precision codes for tighter memory/accuracy tradeoffs.
- RaBitQ (1-bit, added in v0.3.0 via the SIGMOD 2024 method) — one bit per dimension, 96 bytes for 768-d, a 32× shrink. A distance collapses to a
popcount. RaBitQ's selling point is a theoretical error bound that, its authors argue, keeps recall high without a re-ranking pass.
The catch: aggressive codes distort distances, so the ranking off the compressed vectors is wrong. zvec's answer is the refiner (the --is-using-refiner flag). Retrieve a broad shortlist using the cheap quantized distances, then re-score just that shortlist with the original full-precision vectors and return the exact-scored top-. Coarse pass to go fast, fine pass to stay accurate. Toggle refinement off and watch a true neighbour fall out of the result:
The refiner is why the benchmark can run int8 codes and still report high recall: the int8 pass is only a filter, and the returned order is decided by full-precision math on a handful of survivors. RaBitQ is the more aggressive bet — it aims to skip that refine step entirely, which is a stronger claim and the one I'd want independent numbers on before trusting.
What zvec actually ships
The two levers above sit inside a fuller engine. The index and quantization menu:
| Layer | Options |
|---|---|
| Index | HNSW (dense + sparse), IVF, Flat (brute-force), HNSW-RaBitQ, Vamana / DiskANN (on-disk) |
| Quantization | fp16, int8, int4, RaBitQ (1-bit) |
| Distance | full-precision refiner pass over any quantized index |
| Retrieval | dense + sparse vectors, multi-vector queries, full-text search with hybrid fusion |
Systems details that matter for the throughput story:
- CPU auto-dispatch. zvec detects
AVX2,AVX512, andNEONat runtime (via itsailegokernel library) and dispatches the SIMD distance kernels accordingly — so the same binary uses Ice Lake AVX512 on the benchmark box and NEON on ARM. int8 L2 distance is computed in batches. - Persistence. A write-ahead log (WAL) for crash recovery; RocksDB holds metadata and the scalar index; vectors live in auto-scaling mmap'd segment files.
- Concurrency. Many concurrent readers; writes are single-process exclusive — the embedded, single-writer model, same as SQLite.
- Filtered search. Scalar predicates are pushed into the HNSW traversal instead of filtering after the fact, so a filtered query doesn't first retrieve then discard.
The exact config behind the headline run, as published:
# VectorDBBench · Cohere 10M (10M × 768-d) · Alibaba Cloud g9i.4xlarge (16 vCPU / 64 GiB)
zvec-bench \
  --index hnsw \
  --quantize-type int8 \
  --m 50 \
  --ef-search 118 \
  --is-using-refiner \
  --threads 12-20
# → 8,475 QPS, index build ≈ 1 hour
The Python surface is the usual embedded-DB shape — a CollectionSchema to declare fields and the vector index, Doc objects to insert, and a VectorQuery to search — so wiring it into a RAG loop is a library import, not a service to stand up.
The numbers, in full
The cover chart is the VectorDBBench QPS ranking, with zvec highlighted at the top:
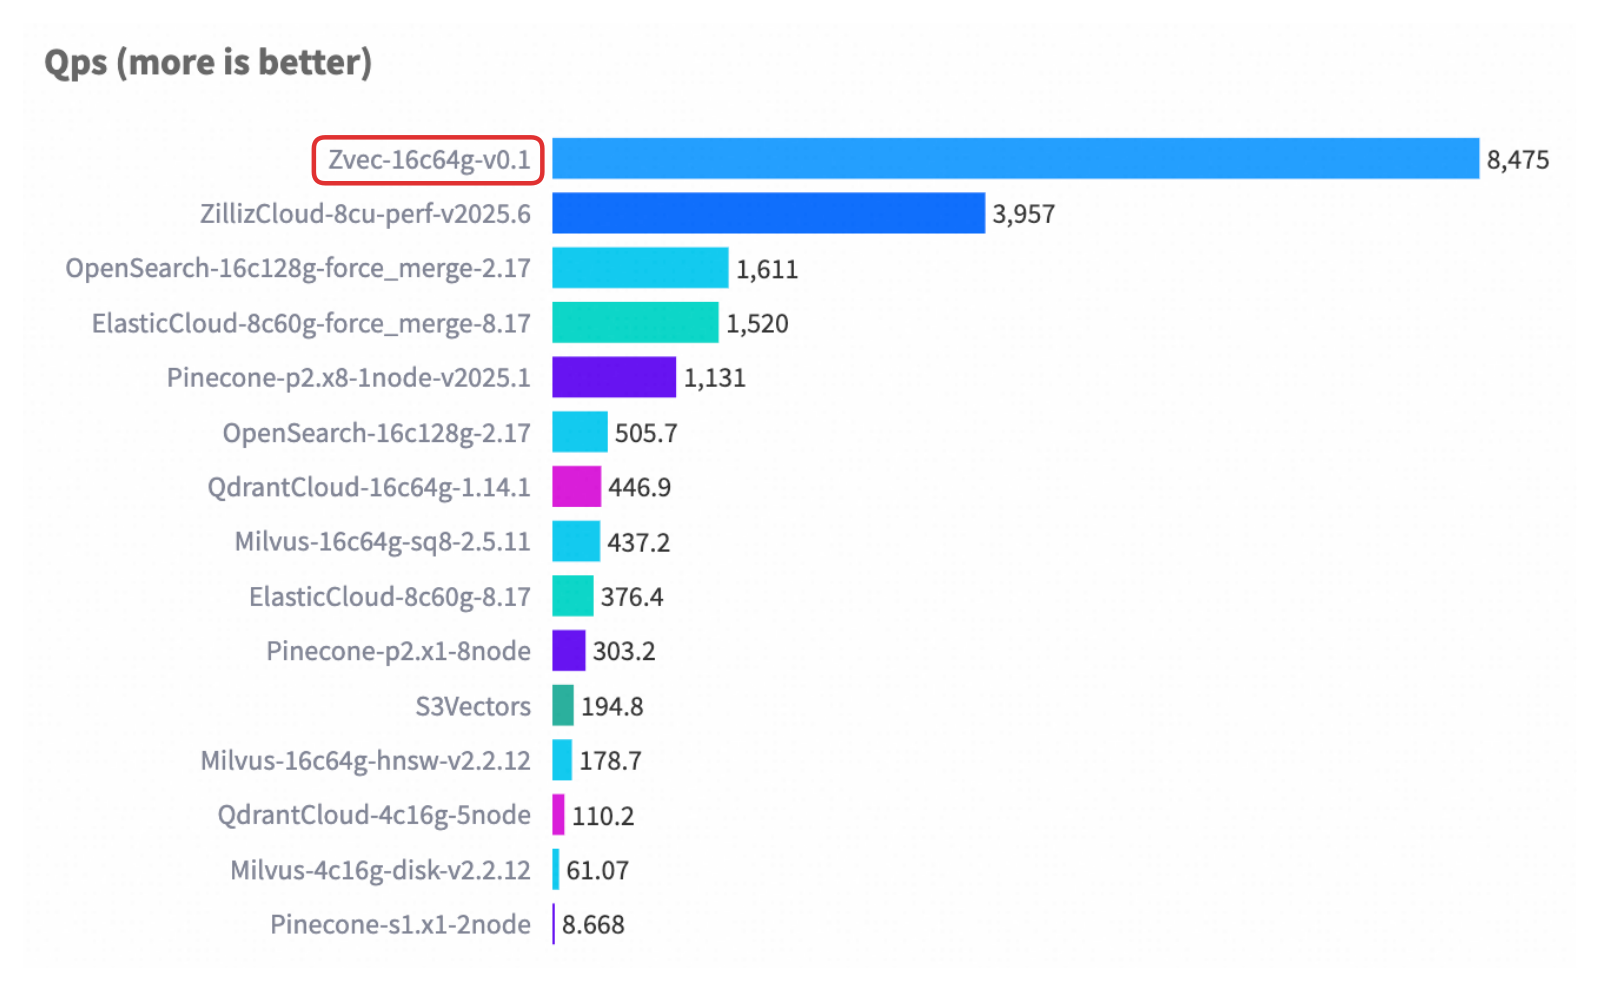
Only the top of the field, redrawn so the gap is legible. The label suffixes (16c64g, 8cu-perf, p2.x8-1node) are each entry's own hardware and version — this is a leaderboard of different setups, not one controlled sweep:
QPS is the throughput axis; VectorDBBench measures it at a matched recall level per entry, and that recall panel isn't shown on this chart, so treat the ranking as "throughput at comparable accuracy" rather than raw speed at any accuracy. The * rows (OpenSearch, ElasticCloud) use force_merge, a build-time optimisation that trades index time for query speed. zvec's own build is the ~1-hour figure above.
The take
The genuinely interesting thing about zvec is not the top bar — it's the form factor. An embedded, Apache-2.0, single-file-ish vector engine with real SDKs across five languages, that runs on-device down to Android, is a useful thing to have for local RAG where standing up Milvus or a managed cloud is overkill. "SQLite for vectors" is the right mental model, and the single-writer/many-reader concurrency model matches it exactly.
The 8,475 QPS is real but oversold by the framing. It is an in-process number — no network — sitting on a chart next to managed services that pay round-trip latency, on hardware that varies row to row. The mechanisms getting it there are the standard two: a graph index that visits a logarithmic slice of the data, and int8 quantization with a full-precision refiner so the cheap codes only filter while exact math decides the final order. Both are well-understood; zvec's contribution is a clean, SIMD-dispatched, embeddable implementation of them, plus a newer RaBitQ 1-bit path whose "high recall without re-ranking" claim is the one I'd hold out for independent verification on. For a team that wants vector search inside the application binary, it's worth a real evaluation — just run VectorDBBench yourself, on your hardware, against your recall target, before believing any single bar.
Built on the zvec release (Alibaba Tongyi Lab, Apache 2.0) — GitHub README, zvec.org docs, and the v0.3.0 notes. All QPS numbers are self-reported via VectorDBBench on Cohere 10M; the two interactive diagrams are illustrations of greedy graph descent and quantize-then-refine, not measured traces. The benchmark figure is reproduced from the project's published chart for commentary.