2026-09-22 · 27 min · explainer · architecture · mixture-of-experts · training · continual-learning · benchmarks
The name is the worst thing about it.
volotat/mini-AGI is a byte-level
language model by Alexey Borsky that trains from scratch on a single RTX 3070
Laptop GPU with 8 GB of VRAM, keeps its weights as files on disk and pages them
onto the card as it reads, and grows its own expert pool while training. The
first commit is dated 19 September 2026. It is three days old. Its README says,
in bold, in the fifth line: "as of now this is a small toy-level model."
It also says the weights are not published, that the run is 4.5% of the way through its first pass over the corpus, and that the code was mostly written by Claude Opus 5 under the author's direction. None of that is hidden. The claims that travelled outward — learns while reading, 8 GB, 169 experts grown by itself, forgetting from 2.23 nats to 0.0067 — are the README's, accurately quoted, with the caveats left behind.
- license
- MIT
- branch
- main
- tests
- none found
- source
- 455.6 kB
- commit date
- 2026-09-22
by size of tracked source at this commit, file counts in brackets; docs, data and vendored trees excluded
local clone, 2026-09-22 at 96784b7 — branch, commit, commitDate, fileCount, hasTests, languages, license, licenseFile
So: no sneering at the name, and no repeating the framing either. The interesting
question is what is checkable. I cloned the repository at
96784b7, read the ten
thousand lines of Python, and put every number in the README against the evidence
the repository commits beside it. Some of it reproduces exactly. One central
piece of evidence is not there at all.
What an expert is here, and how many a character can see
Start with the architecture, because "169 experts" means nothing without it.
A character does not go through a fixed stack. It goes through two dense
prelude blocks and then through one weight-shared recurrent block applied up
to 24 times, each application picking its own experts. config.yaml sets
n_prelude: 2, n_recur: 1, n_coda: 0, max_steps: 24 — which is where the
README's "up to 26 block-applications per character" comes from, 2 + 24 × 1. A
PonderNet halting head stops each character independently, so easy bytes take one
row and hard ones take many.
An expert is a SwiGLU MLP and nothing more:
# minagi/pool.py
class Expert(nn.Module):
    def __init__(self, d_model, d_ff, depth=1):
        self.w1 = nn.Linear(d_model, d_ff, bias=False)   # 512 -> 2048
        self.w3 = nn.Linear(d_model, d_ff, bias=False)
        self.w2 = nn.Linear(d_ff, d_model, bias=False)   # 2048 -> 512

    def forward(self, x):
        return self.w2(F.silu(self.w1(x)) * self.w3(x))
Three matrices of 2048 × 512 is 3,145,728 parameters, and 169 × 3,145,728 = 531,628,032 — which is the 531.6M the README prints for the expert pool, to the decimal. That part is a multiplication and it checks out. If you want the first-principles version of what this mechanism is, Mixture of Experts, from scratch builds exactly this — a router, a pool of MLPs, a sparse forward pass — from one dense feed-forward layer.
Here is the thing the README states only obliquely, and it is the most important structural fact in the project. Routing is two-level, and a character never sees 169 experts.
# minagi/paged.py — PagedPool.__init__
# the VRAM slots - fixed in number, their contents swapped
self.w1 = nn.Parameter(torch.zeros(self.resident, d_ff, d_model))
self.w3 = nn.Parameter(torch.zeros(self.resident, d_ff, d_model))
self.w2 = nn.Parameter(torch.zeros(self.resident, d_model, d_ff))
self.slots = [-1] * self.resident          # slot -> expert id
The parameter tensors on the card are sized by resident, which is 32. The
per-character router picks top-8 out of those 32 slots — add_experts says it
plainly: "The per-character router does not change size — it addresses slots,
not experts." A separate segment router decides, once per 2,048 characters
of reading (segment_chars) or once per 64 characters of writing
(reselect_chars), which 32 of the 169 get to be on the card at all.
So the honest shape of the claim is: a 540M-parameter model where any given character can reach about 109M of it, and the other 431M is a candidate set that a slower scheduler draws from. That is not a criticism — it is the entire point of the design, and it is why the pool can keep growing on 8 GB. But "169 experts" and "top-8 routing" are facts about two different routers.
Where the 169 came from, and why it is not a ceiling
runs/samples.txt is 3.5 MB of committed training log, one block per sample,
each carrying the character count and the live expert count on the same line. It
is the single best thing in the repository. 750 blocks, from the first session on
16 September — three days before the repository existed — to 408.1M
characters read at commit 4549e97. It grows, so every figure below names the
commit it was read at.
The README's snapshot reproduces from it exactly. At step 155,706, 318.1M characters, the log reads 169 experts, train loss 0.6809, held-out 0.8336 ± 0.0331 nats, 1.2026 bits/byte. Every one of those is the README's table, unrounded and unmoved.
Three things the staircase says that the number does not.
It shrinks. Nine of the sampled points are smaller than the point before
them, sixteen experts deleted in total, and the largest single drop is 142 → 137
at 202.5M characters. prune.survival_chars is 100,000,000 — an expert is
deleted when nothing has admitted it to the card for a hundred million
characters — and the first prune in the log lands at 196.5M, which is the first
moment an expert born in the run's first hundred million characters could
qualify. The arithmetic of the pruner's window is visible in the log.
It is capped by a constant. growth.every_chars is 2,000,000 and growth.k
is 1, so nothing in this design can add faster than one expert per two million
characters. From 64 at the start, the ceiling at 318.1M characters is 223. The
run is at 169. Roughly a third of the growth decisions were refused — which is
what the five brakes (room, used, earning, fits, honest) are for, and
the best evidence in the repository that they fire.
And it is already stale — twice over, while this was being written. The
README says 169. When I first read the committed log its last block said 179,
at 357.7M characters, having touched 180 twice and come back down. Re-reading it
at commit 4549e97 the last block is 175, at 408.1M — four fewer experts
across 50M more characters. The number that travelled is a snapshot of a quantity
that moves in both directions, and the log is append-only, so any figure quoted
from it needs a commit beside it.
The forgetting figure: 2.2300 → 0.0067
This is the claim the whole design rests on, and the one that needs the most care.
It is not a before-and-after of one run. It is two arms of a controlled probe.
The model reads 524,000 characters of chess and nothing else, at batch 1, and the
quantity measured is the mean change in held-out loss on the seven subjects it
did not read. One variable moves between the arms: training.trunk_lr_mult,
the multiplier on the learning rate of the trunk — embeddings, attention,
routers, halting head — which is the part every character passes through and
which the README says carries 97.6% of the squared gradient norm.
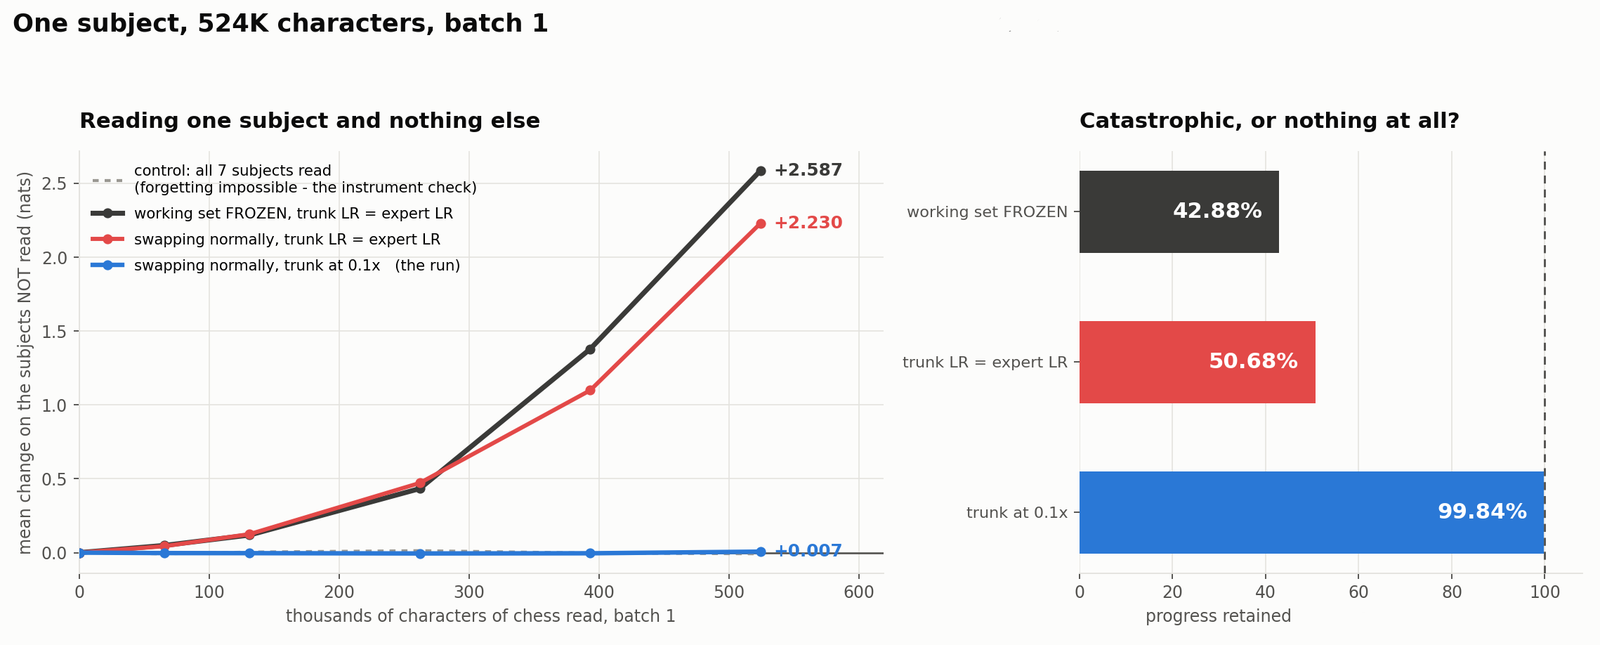
The effect between the arms is real and it is enormous. +2.23 against +0.007 is not a rounding argument; it is the difference between losing most of what the model knew and losing nothing visible. And the second finding underneath it is sharper than the headline: freezing the working set — removing the one property that makes a pool a pool — costs only 0.3571 nats of the 2.5871, 13.8% of the effect. In that arm 93 of 136 experts received no gradient at all and the model collapsed anyway. Sparsity is not what prevents forgetting here. A learning rate is.
Now the part that needs arithmetic.
The denominator is not published, but it is recoverable
"Retained vs chance" is a ratio, and the README prints the numerator and the ratio and never the denominator. It does not have to: given a change δ and a retained fraction r,
where is the chance loss and the held-out loss the probe started from. Each published row therefore implies its own denominator, and if all three rows came off one probe at one checkpoint they have to agree.
They do. The frozen arm implies 4.5292 nats, the equal-learning-rate arm implies 4.5215, and those two agree to 0.0077 nats — which for a quantity near 4.5 is a coincidence I would not bet against twice. The third row implies 4.1875, and it is the only one that disagrees, for a boring reason: its numerator is rounded. 99.84% of a 4.5215-nat span needs δ = 0.0072, not 0.0067, and the figure itself prints +0.007.
Set — the uniform-byte baseline, which is the right ceiling for a model whose entire alphabet is the 256 byte values — and nats/char. The committed log passes through 1.02 somewhere between 140M and 200M characters read, which is exactly the stretch of the run where the pool held the 136 experts that the probe's own right-hand panel names. Everything is consistent. The denominator is just "how far above chance the model had got when the probe started", and it is about 4.52 nats.
So: forgetting of what, measured how. Of the seven held-out subjects the probe deliberately did not read, measured as the mean rise in their held-out nats/char over a 524,000-character single-subject read at batch 1, expressed as a fraction of the model's distance above a uniform-byte baseline at the checkpoint the probe started from. That is a well-posed metric and I could not have written that sentence from the README alone.
And then the number itself
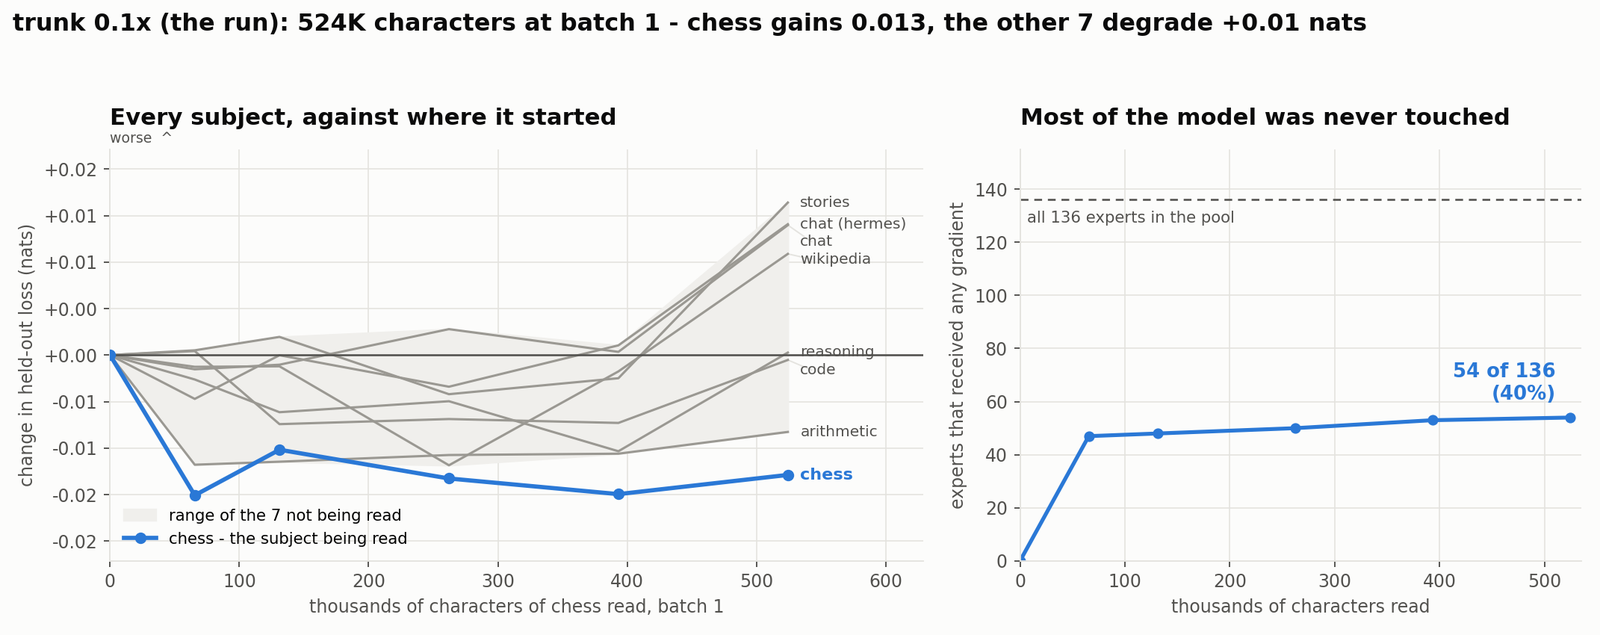
Two sections after the forgetting table, in its benchmarks, the README states its own instrument resolution, and it is unusually honest about it:
The same configuration run twice lands about 0.014 apart, because the expert dispatch is not deterministic on CUDA. Treat about 0.03 as the threshold for a real difference, not the error bar printed beside one score.
The claimed forgetting is 0.0067. That is 48% of the run-to-run variance the repository admits to, 22% of the threshold it tells you to use, and 20% of the standard error printed beside the headline held-out loss. The control arm — all seven subjects read, where forgetting is impossible by construction — drifts −0.0077, which is larger in magnitude than the treatment.
None of that damages the result. It changes what the result is. The probe establishes that forgetting fell below the instrument, not that it is 0.0067 nats. "No measurable forgetting over half a million characters of one subject, against +2.23 nats at the same measurement without the fix" is the true sentence, and it is a strong one. The README half-knows this: the left panel of the second figure is drawn with a ±0.02-nat axis and a band rather than a point, which is the correct way to show a quantity you cannot resolve. The table then prints four decimal places anyway.
What is missing
Here is where the repository stops being able to support the claim, and it is worth stating without hedging because nothing else in this article turns on it.
The eval that produced those numbers is not in the repository. train.py
exposes three subcommands — read, stream, ponder-probe — and ponder-probe
measures decision depth against character difficulty, not forgetting. There is no
massed-read script, no per-arm runner, no saved probe output. The figures are
committed as PNGs; nothing that made them is.
The code knows this. It cites evidence by path, five times, and none of the paths exist:
$ git -C mini-AGI grep -ohE '(runs|tools)/[A-Za-z0-9_./-]+' -- '*.py' | sort -u
runs/cl/                          # pool.py:10  - "Measured, not assumed: see runs/cl/"
runs/corpus_index.json
runs/dashboard.png
runs/expert_history.jsonl
runs/results/birth_schemes.json   # paged.py:787 - the recombination comparison
runs/samples.txt                  # the only one committed
runs/training_progress.png
tools/birth_probe.py              # paged.py:822
tools/capture_routing.py          # pool.py:389
tools/chess_legality.py           # train.py:1415
tools/plot_progress.py            # plasticity.py:47
tools/plot_routing.py             # train.py:2004
$ ls mini-AGI/tools
ls: cannot access 'mini-AGI/tools': No such file or directory
.gitignore explains it: runs/* with a single !runs/samples.txt exception,
and tools/ is simply absent from the tree. So the answer to if the repo
publishes the eval, reproduce the arithmetic; if it does not, say so plainly is:
it does not. What it publishes is the figures, the percentages, and — through
those percentages — enough structure to recover the denominator, which is how the
section above exists at all. That is more than most projects give you and less
than the claim needs.
One more gap, of a different kind. The paging telemetry that would answer does this actually work is computed every chunk and printed to stdout:
# train.py, in the reader's progress line
+ f"  | {swapped/max(did,1):.1f} experts loaded "
  f"onto the card per chunk, RAM hit rate {rp['hit_rate']:.2f}"
write_samples does not write it. Grep the committed log for "experts loaded"
and you get zero hits. The one number that would tell you what the disk-paged
design costs in practice is the one number the artefact does not carry.
Is disk paging workable, or a latency cliff?
Both, and which one you get is decided by a scheduler, not by the design.
The arithmetic is unambiguous. _rearrange parks a departing expert with a
blocking .to("cpu") and fetches an arriving one with a blocking .to(dev), one
at a time, no CUDA stream, no pinned memory, no prefetch. An expert on the card is
36 MiB — weights, exp_avg and exp_avg_sq, all fp32 — so a swap is 72 MiB
across PCIe with nothing overlapped, and a full 32-slot turnover is 2.25 GiB.
Set that against the two cadences the model actually runs at.
| window | characters | at the log's median 793 char/s | full turnover, ~10 GB/s PCIe | |
|---|---|---|---|---|
| reading | segment_chars | 2,048 | ≈ 2.6 s | ≈ 0.23 s → 9% |
| writing | reselect_chars | 64 | ≈ 0.10 s | ≈ 0.23 s → 230% |
While reading a corpus, the working set is re-chosen once every 2,048 characters
and the text stays on one subject for a whole passage, so demand is stable and
hysteresis (margin: 0.10, dwell_chars: 2048) keeps the set from churning on
noise. Even a worst case is a tenth of the window. Workable.
While generating, the set is re-chosen every 64 characters, and a full turnover costs more than twice the window it is serving. The design knows this. The README's own generation clip says "in this clip nothing swapped, because the prompt had already pulled the right experts onto the card." That is the good case stated as a caveat, which is the correct way round — but it is also the only case shown.
So the honest answer is: the cliff is real, the design is built to stay off it, and the repository publishes no measurement of how often it succeeds. The telemetry exists, in the training loop, formatted, and goes to a terminal.
Two engineering details worth stealing regardless of what you think of the rest. Adam's moments travel with the expert rather than staying with the VRAM slot — leave them behind and every swapped expert inherits a stranger's momentum while the loss curve keeps looking healthy. And an expert already on the card stays in the slot it is in, matched by identity rather than position, because demand comes back sorted and the order churns while the set barely moves.
Where the model actually is
Against the corpus it is reading, not against anything else.
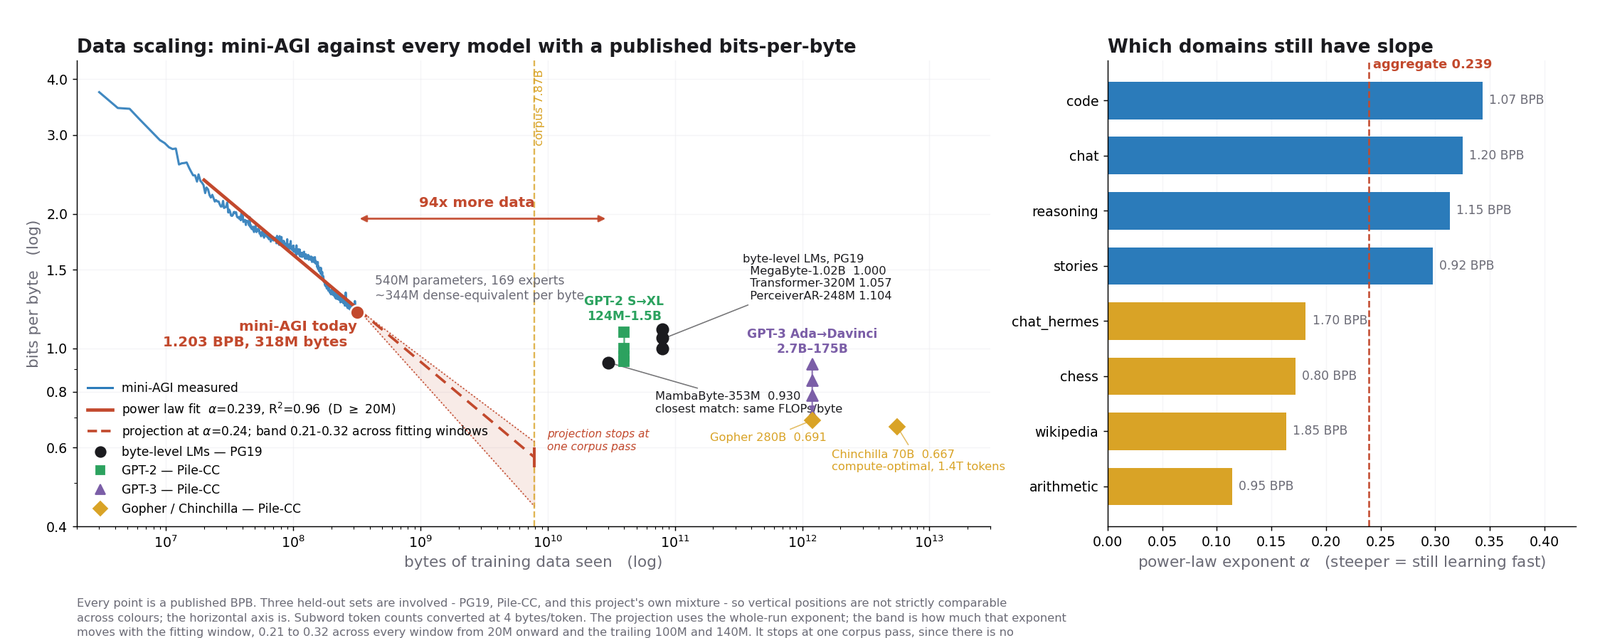
The fit is L ∝ D^-0.239 with R² 0.96, between Kaplan's 0.095 and Chinchilla's
0.28, and the chart draws a band from 0.21 to 0.32 rather than pretending to one
exponent, because the answer depends on where the fit starts. MambaByte-353M,
the closest like-for-like, read 94× more data.
The README's projection table is the part I most wanted to check, and it reproduces cleanly once you see that every row is remaining work from the snapshot, not total:
against a published "~10". The 0.51B, 0.75B and 1.92B rows land on 2.9, 6.4 and 23.8 days against published 3, 6 and 24. Four for four.
Which makes one other sentence in the README checkable, and it does not survive.
The run is still reading its first pass over the corpus, the weights go up once it has been through all of it, which is a couple of weeks away at the current rate.
The corpus is 7,879M characters. The log's last block is at 408.1M — 5.18%, the figure the log prints itself. The remaining 7,471M characters at the log's own median rate of 793 char/s is 109 days, and at the fastest rate the run has sustained recently, 882 char/s, it is 99. Using the README's own 778 char/s it is 112. Not a couple of weeks: about sixteen of them. Everything else in that paragraph is accurate — the pass is unfinished, the weights are unpublished — but the date attached to it is off by an order of magnitude, by the same arithmetic the README uses correctly four rows earlier.
What it produces
Since the repository commits the sample history, here is the model reading and writing. The two clips are the repository's own captures; the text below them is the README's own sample, which is the honest way to show it, because the README says where in training that sample came from and I would otherwise be guessing.
The text it produces, continuing a story about a cherry tree:
They worked together and saw their favorite shore. One day, they wanted to play with their favorite shore. They wanted to play with it, but
Grammatical, on-topic, and it repeats itself. The README says so in the same breath, which is the tone of the whole document: "which is a fair picture of where the model is at 243M characters." That is the anchor for this sample — 243M, not the snapshot figure quoted earlier in this piece.
The log's last block, read at commit 4549e97, is 408.1M characters and 175
experts: held-out 0.8006 nats/char, 1.1551 bits/char, perplexity 2.23, repeating
33% of its 8-grams. For scale, a
well-trained byte-level model on general English lands near 1.0 bits/byte and the
best compressors go below 0.9. It is not there. It is also 5.18% of one pass into
a corpus it has never finished, on a laptop.
What I would actually take from this
- Read the two-level routing, not the expert count. The interesting design is a slow segment router that chooses 32 experts out of the pool per passage and a fast per-character router that picks 8 of those 32, with the pool itself bounded by a disk quota rather than by VRAM. "169 experts" is a number that moves in both directions and that no character ever sees.
- The learning-rate result is the finding, and it is cheap to try. One multiplier on the trunk's learning rate, separating the shared path from the sparse one, taking single-subject forgetting from catastrophic to unmeasurable. That is a two-line change in any MoE fine-tune, it costs nothing, and it is testable in an afternoon on hardware you already have.
- Recombination as an initialiser deserves a paper on its own. Whole hidden units drawn from sixteen parents, because a clone is redundant and a random init is useless. The evidence for it is a JSON file that is not in the tree, so somebody should just run the comparison.
- Do not quote 0.0067 nats. Quote "below the noise floor, against +2.23 nats without the fix." The first is a number the instrument cannot see; the second is the actual result and it is bigger.
- Wait for the weights. They are not published, the corpus pass is 4.5% done, and the honest estimate for finishing it is about four months rather than two weeks. That is fine. A three-day-old experiment that ships its training log, states its own noise floor, and writes the least flattering sentence about its own gate test is in better shape than most things with weights.
What would change my mind
7 claims above, and what would falsify each
A character routes through 8 of the 32 resident experts, never 8 of 169.
PagedPool.__init__sizesw1,w3andw2as(self.resident, d_ff, d_model)withresidentset frompool.resident: 32, andadd_expertsstates that the per-character router addresses slots rather than experts. If a forward pass can reach a non-resident expert — instrumentPooledMLP.forwardand log the distinctuidvalues hit within one chunk, and see whether the count can exceed 32 — then the routing is one-level and this section is wrong about the model's effective width.The pool's growth is capped at one expert per two million characters, and the run uses about a third of that.
config.yamlsetsgrowth.every_chars: 2_000_000andgrowth.k: 1. From 64 experts, the ceiling at 318.1M characters is 223 and the log says 169. If a run with the shipped config ever exceeds 64 + chars/2M, the cap is not binding and I have misreadAutoGrow.step. The committed log's own first three million characters already break it — 64 to 80 — which is evidence the early sessions were not using the committed setting, and if that is instead a bug in my reading of the file then the whole ceiling line on the chart moves.The 'retained vs chance' denominator is about 4.52 nats, implying a starting held-out loss near 1.02 nats/char against ln(256).
Two lines of arithmetic: 2.5871 ÷ (1 − 0.4288) = 4.5292 and 2.2300 ÷ (1 − 0.5068) = 4.5215. If the probe's baseline was published anywhere I missed, or if
chancein that code means something other than a uniform distribution over the alphabet — a unigram baseline, say, which would be lower and would put L₀ higher — then the reconstruction is wrong even though the two arms still have to agree with each other. Publishingruns/cl/settles it in one command.0.0067 nats is below the resolution the repository states for itself.
The README puts run-to-run variance at 0.014 for an identical configuration and tells the reader to treat 0.03 as the threshold for a real difference; the control arm's own drift is −0.0077. If the massed-read probe is deterministic in a way the training loop is not — fixed seeds,
torch.use_deterministic_algorithms, dispatch forced through a stable path — then its resolution could genuinely be finer than the training run's and the fourth decimal could mean something. The probe script would show it. It is not in the repository.The forgetting experiment's code and raw data are not in the repository.
git ls-filesreturns 40 paths.train.py --helplistsread,streamandponder-probe, andcmd_ponder_probemeasures halting depth.tools/does not exist;runs/contains one file. If a branch, a release asset, or a later commit carries the probe, this section is out of date rather than wrong — and I would rather it were out of date.One expert swap moves 72 MiB across PCIe synchronously, and a full working-set turnover moves 2.25 GiB.
3 × 2048 × 512 = 3,145,728 parameters; on the card that is weights plus
exp_avgplusexp_avg_sqin fp32, so 36 MiB, and_rearrangemoves a leaver out and an arriver in with plain blocking.to()calls. If a later commit overlaps these on a side stream with pinned buffers, or if the optimiser state is held in bf16 on the card, the per-swap figure falls and the writing-cadence row in that table stops being alarming. Measuring it needs only the counter the training loop already prints.Finishing the first corpus pass is about 110 days away at the run's own rate, not a couple of weeks.
7,879M − 408.1M = 7,471M characters remaining at commit
4549e97; the committed log's median reading rate is 793 char/s and its recent median 809. Divide. If the corpus is re-scoped, if the run moves to a larger card, or if "been through all of it" means a target bits-per-byte rather than a completed pass, the estimate is answering the wrong question. The README's own scaling table uses exactly this arithmetic and lands within 5% of its published days on all four rows, which is why I trust the method and not the sentence.
Nothing here was executed — there is no CUDA GPU in the machine this was written on. Every measurement is read out of volotat/mini-AGI at commit 96784b7, cloned rather than summarised, MIT-licensed, copyright 2026 Alexey Borsky. The expert trajectory, held-out losses, reading rates and per-subject figures come from runs/samples.txt, the only run artefact the repository commits; the tier sizes, growth cap and prune window are derived from config.yaml and the tensor shapes in minagi/paged.py and minagi/pool.py. The three figures and both clips are the repository's own, reproduced under academic use; the clips were transcoded from the committed GIFs and otherwise unaltered. Architecture background: Mixture of Experts, from scratch. The project's own reading list is worth the click — Shazeer 2017 for the pool, Switch Transformers for the dispatch, PonderNet for the depth, ZeRO-Infinity for the paging, and Kim et al. 2025 for adding experts to a live MoE.